Power BI connector
Easily send marketing, sales, and finance data to Power BI.
- Centralize all your data integrations in one place
- Prepare your data before sending it to Power BI
- Enjoy responsive, human support for any challenges


Enjoy seamless Power BI data integration
Connect and transform data in one place
Simple setup with no coding required
Get fresh data and avoid dashboard slowdowns
Coupler.io Power BI connector in numbers
data sources available
Easily collect data from different apps and combine it in GUI with no programming skills required.
dashboard templates
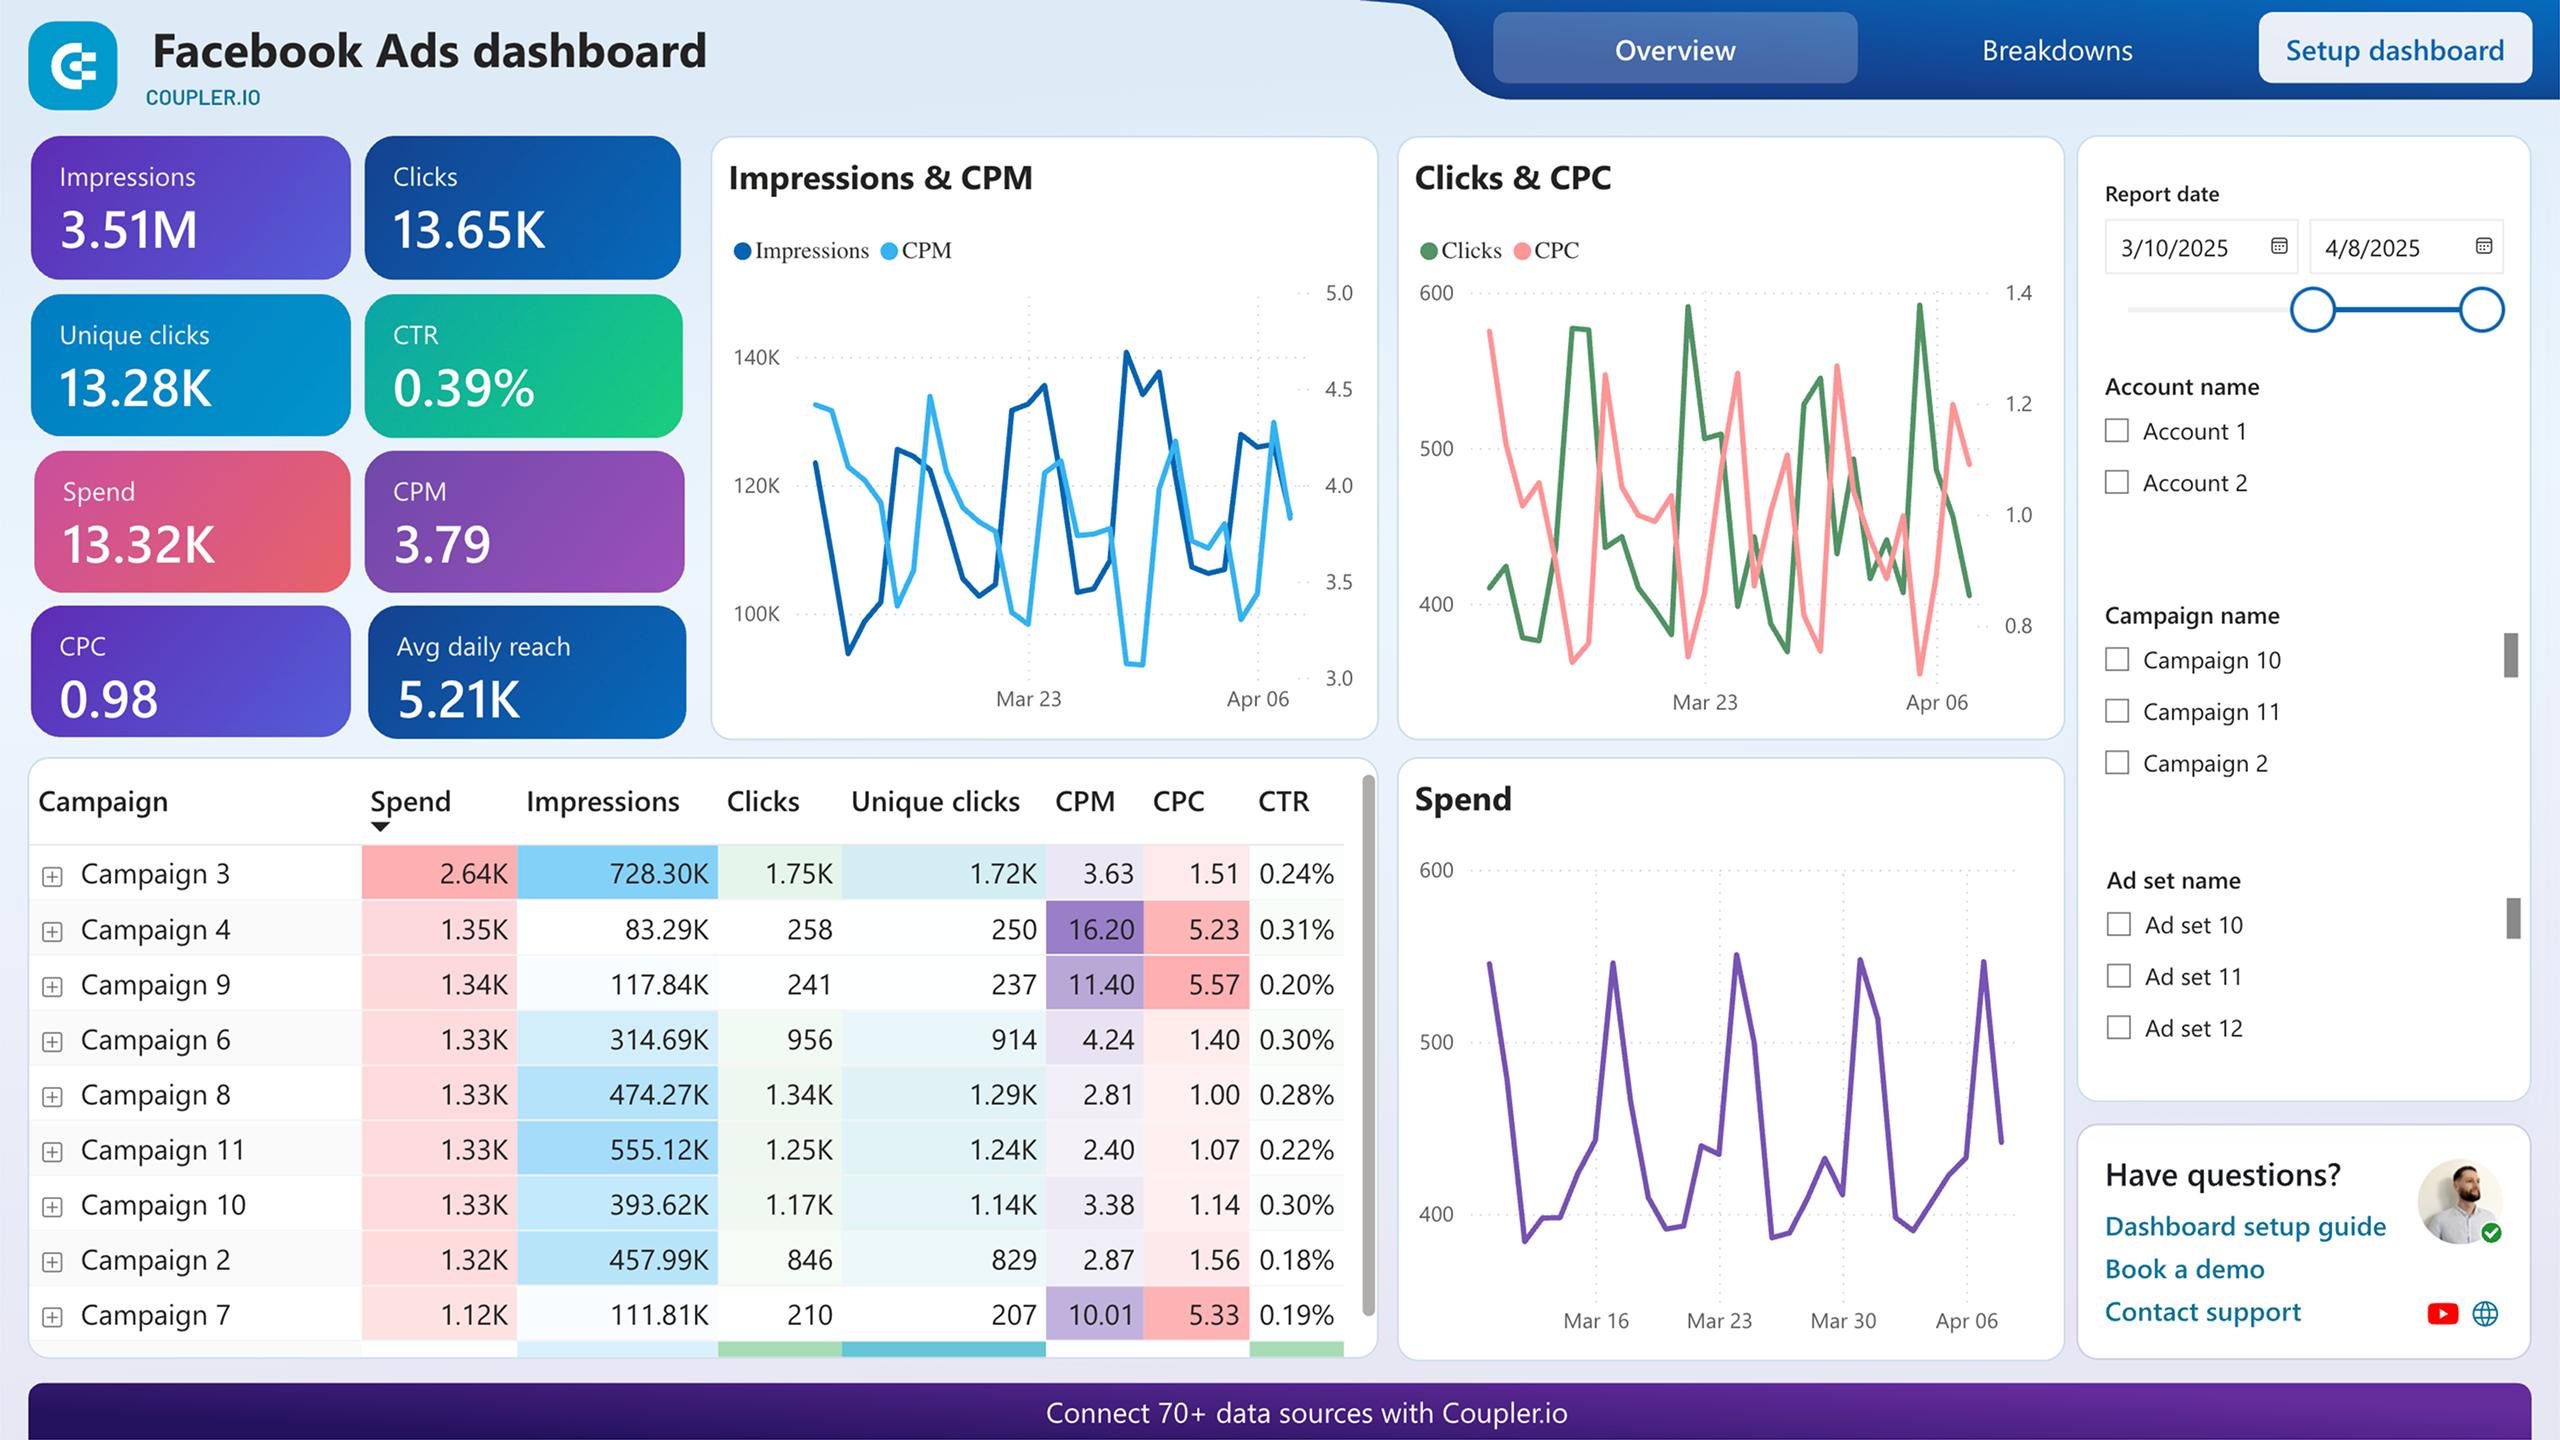
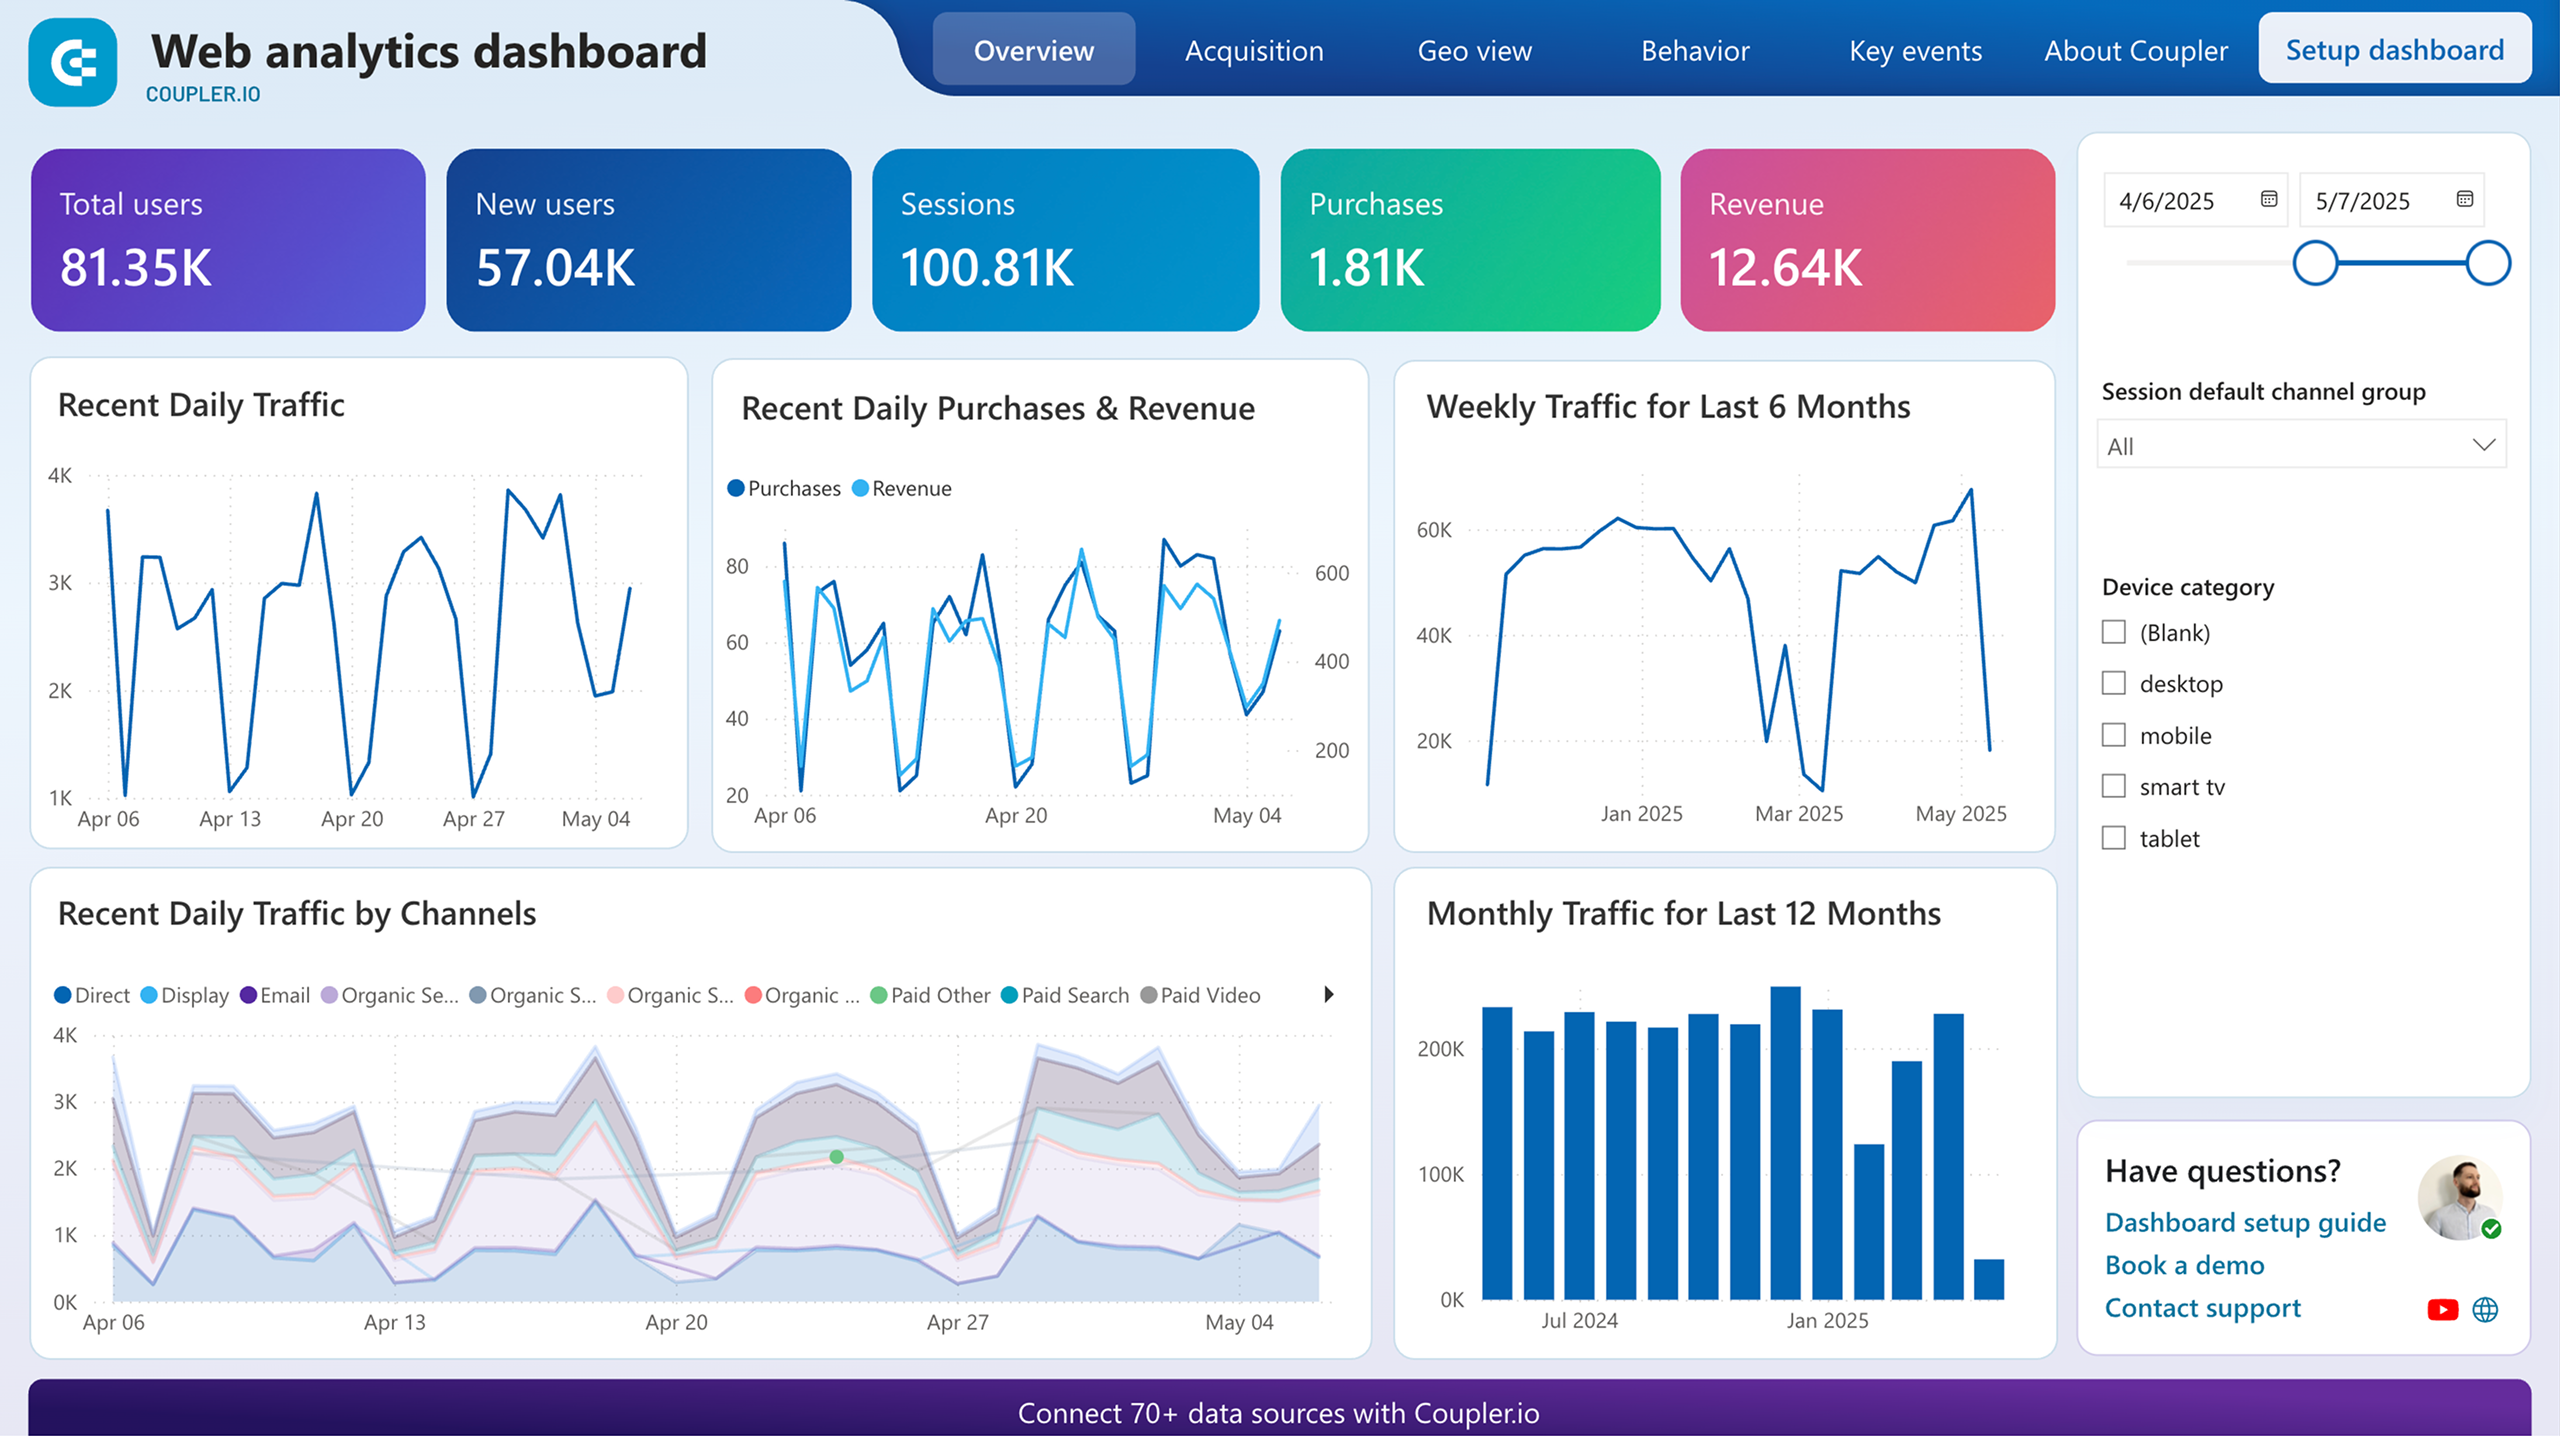
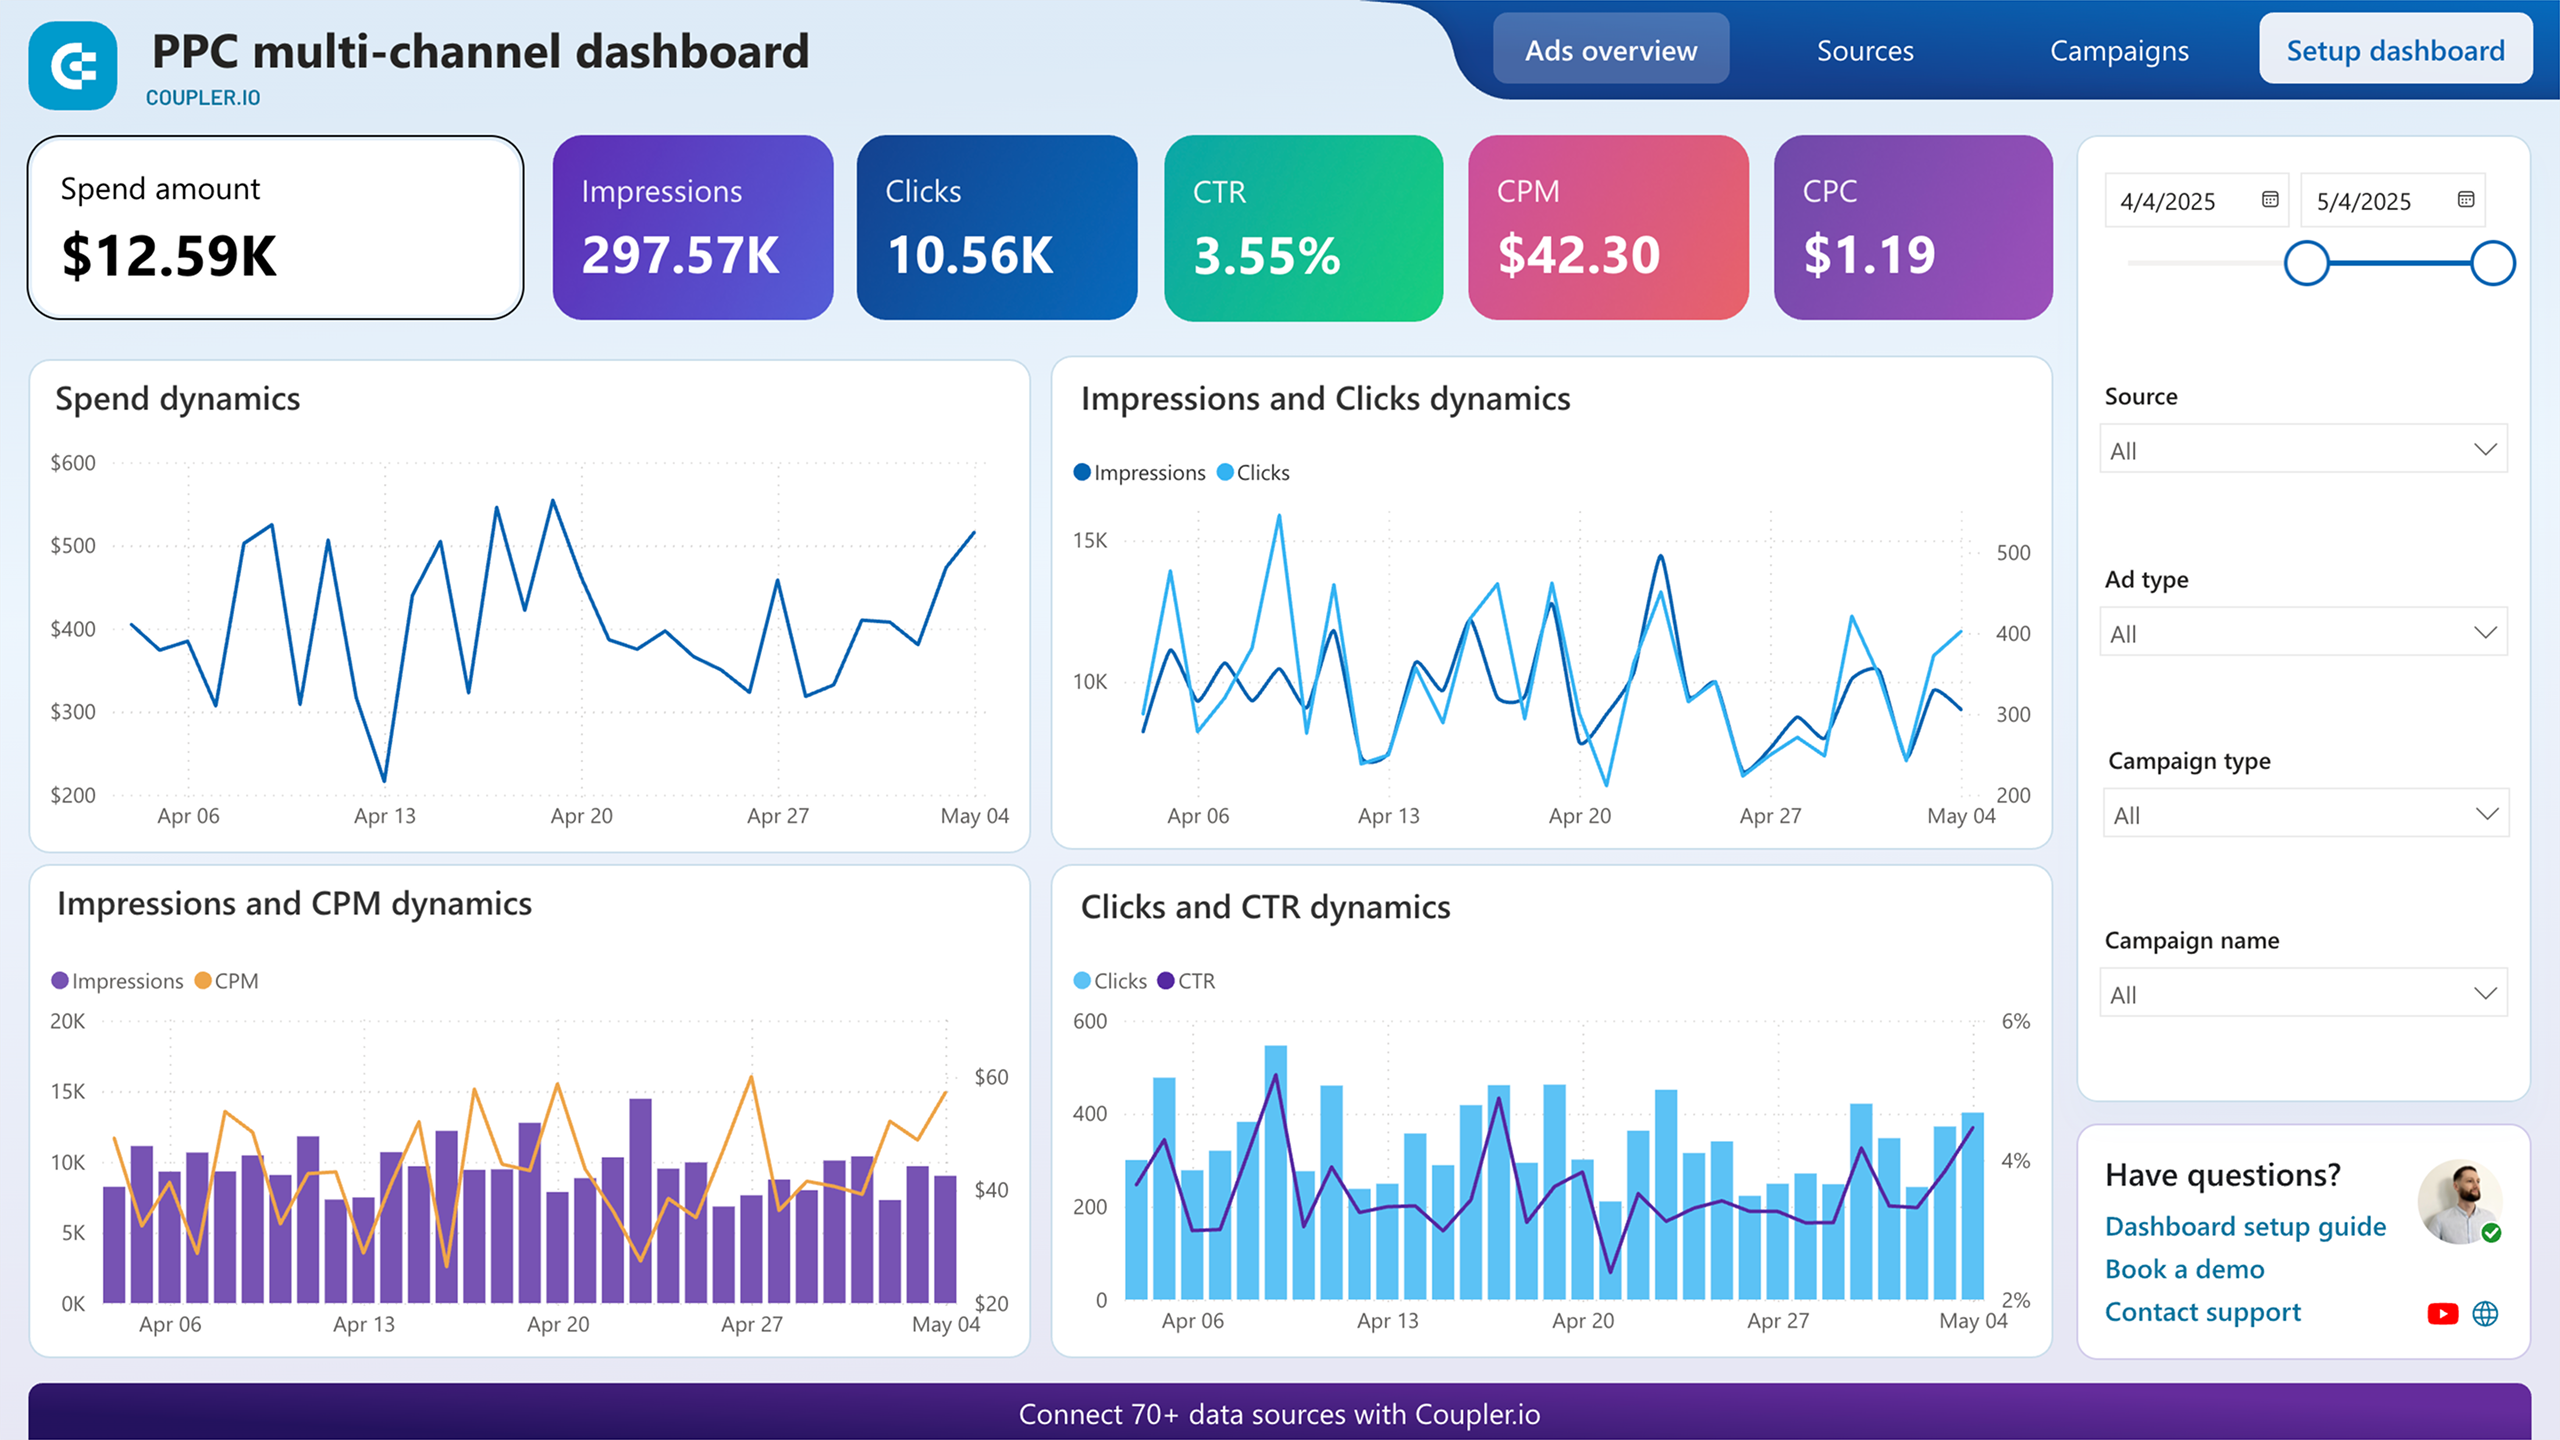
Save time on report creation with a vast dashboard template library for Power BI to analyze marketing, sales, finance, and other business areas.
fastest refresh frequency
Enable automatic data refresh with the shortest update frequency of 15 minutes to replenish your dashboards with the freshest data.
support satisfaction
Our support team comprises humans you can address in case of integration-related issues or questions.
users
Join thousands of happy users who value Coupler.io for its flexibility and agility.
on review platforms
Over 500+ real user reviews on Capterra, and Trustradius prove Coupler.io to be a recommended solution for converting raw data sets into meaningful reports.
Select your data source
All sources
-
ActiveCampaign
-
Airtable
-
Amazon Ads
-
Amplitude
-
Apple Search Ads
-
Asana
-
BigQuery
-
Bing Ads
-
Braze
-
Calendly
-
CallRail
-
Campaign Monitor
-
Chargebee
-
Chartmogul
-
ClickUp
-
Clockify
-
Confluence
-
CSV
-
Delighted
-
Dropbox
-
Facebook Ads
-
Facebook Page Insights
-
Facebook Public Data
-
Freshservice
-
GoHighLevel
-
Google Ads
-
Google Analytics 4
-
Google Business Profile
-
Google Calendar
-
Google Drive
-
Google PageSpeed Insights
-
Google Search Console
-
Google Sheets
-
Harvest
-
HubSpot
-
Instagram Ads
-
Instagram Insights
-
Instagram Public Data
-
Intercom
-
Jira
-
JSON
-
Klaviyo
-
Lemlist
-
LinkedIn Ads
-
LinkedIn Company Pages
-
Mailchimp
-
MailerLite
-
Mailtrap
-
Marketstack
-
Microsoft Excel
-
MySQL
-
Omnisend
-
OneDrive
-
Pinterest Ads
-
Pipedrive
-
Piwik Pro
-
Plausible
-
PostgreSQL
-
QuickBooks
-
Quora Ads
-
Recurly
-
Redshift
-
Reply.io
-
Salesforce
-
Sendgrid
-
Shopify
-
Slack
-
Snapchat Ads
-
Square
-
Stripe
-
Tableau
-
TikTok Ads
-
TikTok Organic
-
TimeTonic
-
Trello
-
Typeform
-
Vimeo Public Data
-
WooCommerce
-
Wordpress
-
Wufoo
-
X (Twitter) Ads
-
Xero
-
Yahoo Finance Price
-
YouTube
-
Zoho Billing
-
Zoho Books
-
Zoho Campaign
-
Zoho Desk
-
Zoho Expense
-
Zoho Inventory
-
Zoho Invoice
Early access sources
-
100ms
-
7shifts
-
Acuity Scheduling
-
Adjust
-
Adobe Commerce (Magento)
-
AgileCRM
-
Aha
-
Aircall
-
Akeneo
-
Alpha Vantage
-
Apify Dataset
-
Appcues
-
Appfigures
-
Appfollow
-
AppsFlyer
-
Apptivo
-
Ashby
-
AWIN Advertiser
-
BambooHR
-
Basecamp
-
BigMailer
-
Bitly
-
Blogger
-
BlueTally
-
Box
-
Braintree
-
Breezy HR
-
Brevo
-
Brex
-
Bugsnag
-
Buildkite
-
Bunny, Inc.
-
Cal.com
-
Campayn
-
Canny
-
Capsule CRM
-
Captain Data
-
Castor EDC
-
Chameleon
-
Chargedesk
-
Chargify
-
Churnkey
-
Cin7
-
Circa
-
Circleci
-
Cisco Meraki
-
Clazar
-
Clockodo
-
Close.com
-
Cloudbeds
-
Coassemble
-
Coda
-
Codefresh
-
Coin API
-
CoinGecko Coins
-
CoinMarketCap
-
Concord
-
Copper
-
Countercyclical
-
Customer.io
-
Customerly
-
Datadog
-
Deputy
-
Ding Connect
-
DockerHub
-
Dolibarr
-
Drip
-
Dwolla
-
e-conomic
-
Easypost
-
Easypromos
-
Elasticemail
-
EmailOctopus
-
Employment-Hero
-
Encharge
-
Eventbrite
-
Eventee
-
Eventzilla
-
Everhour
-
Exchange Rates Api
-
EZOfficeInventory
-
Factorial
-
Fastbill
-
Fillout
-
Finage
-
Financial Modelling
-
Finnhub
-
Finnworlds
-
Fleetio
-
Flexmail
-
Flexport
-
float
-
Flowlu
-
Formbricks
-
FreeAgent
-
Freightview
-
FreshBooks
-
Freshcaller
-
Freshchat
-
Freshdesk
-
Freshsales
-
Front
-
Fulcrum
-
Fullstory
-
Gainsight Px
-
GetGist
-
GitBook
-
Gitlab
-
Glassfrog
-
GoCardless
-
Goldcast
-
Gong
-
Google Classroom
-
Google Forms
-
Google Tasks
-
Gorgias
-
Greenhouse
-
greytHR
-
Guru
-
Harness
-
Height
-
Hellobaton
-
Help Scout
-
HiBob
-
HoorayHR
-
Hub Planner
-
Humanitix
-
Huntr
-
Incident.io
-
Inflowinventory
-
Insightful
-
Insightly
-
Invoiced
-
Invoiceninja
-
Iterable
-
JobNimbus
-
Jotform
-
Judge.me Reviews
-
JustCall
-
Katana
-
Keka
-
Kissmetrics
-
Kit
-
Lago
-
Leadfeeder
-
Less Annoying CRM
-
Lever Hiring
-
Lightspeed Retail
-
Linear
-
Lob
-
luma
-
MailerSend
-
Mailgun
-
Mailjet Mail
-
Mailjet SMS
-
Mantle
-
Mention
-
Merge
-
Metabase
-
Metricool
-
Microsoft SharePoint Lists
-
Microsoft Teams
-
Miro
-
Missive
-
MixMax
-
Mixpanel
-
Mode
-
monday.com
-
Mux
-
My Hours
-
n8n
-
Navan
-
Nexiopay
-
NinjaOne RMM
-
NoCRM
-
Northpass LMS
-
Notion
-
Nutshell
-
Nylas
-
Okta
-
OnceHub
-
OnePageCRM
-
OneSignal
-
Onfleet
-
Open Exchange Rates
-
Opinion Stage
-
Opsgenie
-
OPUSWatch
-
Orb
-
Oura
-
Outbrain Amplify
-
Oveit
-
Pabbly
-
Paddle
-
Pagerduty
-
PandaDoc
-
Paperform
-
Pardot
-
Partnerize
-
PartnerStack
-
PayFit
-
Paystack
-
Pendo
-
Pennylane
-
PersistIq
-
Phyllo
-
Picqer
-
Pinterest Organic & Shopping
-
Pipeliner
-
Plaid
-
Planhat
-
Polygon Stock API
-
PostHog
-
Postmark App
-
PrestaShop
-
Pretix
-
Primetric
-
Printify
-
Productboard
-
Productive
-
Qualaroo
-
Railz
-
RD Station Marketing
-
Recharge
-
Recreation
-
Recruitee
-
referralhero
-
RentCast
-
Repairshopr
-
Retail Express by Maropost
-
Retently
-
RevenueCat
-
Revolut Merchant
-
Ringcentral
-
Rocket.chat
-
Rocketlane
-
Rootly
-
Ruddr
-
Sage HR
-
Salesflare
-
Salesloft
-
SavvyCal
-
Secoda
-
Segment
-
Sendinblue
-
Sendowl
-
SendPulse
-
Sentry
-
Serpstat
-
Shippo
-
ShipStation
-
ShopWired
-
Shortcut
-
Shortio
-
Sigma Computing
-
SimFin
-
SimpleCast
-
Simplesat
-
Smaily
-
SmartEngage
-
Smartreach
-
Smartsheet
-
Solarwinds Service Desk
-
Sonar Cloud
-
SparkPost
-
Split.io
-
SpotlerCRM
-
Squarespace
-
Statsig
-
Statuspage
-
StockData
-
Strava
-
SurveySparrow
-
Survicate
-
Systeme
-
Taboola
-
Tavus
-
Teamtailor
-
Teamwork
-
Tempo
-
Testrail
-
Thinkific
-
Thinkific Courses
-
Thrive Learning
-
Ticketmaster
-
TicketTailor
-
TickTick
-
Timely
-
Tinyemail
-
Todoist
-
Toggl
-
Track PMS
-
Tremendous
-
Trustpilot
-
Twelve Data
-
Twilio
-
Twilio TaskRouter
-
Ubidots
-
Unleash
-
UpPromote
-
Uptick
-
Uservoice
-
Vantage
-
Veeqo
-
Visma Economic
-
Vitally
-
VWO
-
Waiteraid
-
Web Scrapper
-
When I Work
-
Workable
-
WorkflowMax
-
Workramp
-
Wrike
-
X (Twitter) Public data
-
Yotpo
-
You Need A Budget (YNAB)
-
Younium
-
Zendesk Talk
-
Zenloop
-
Zoho Analytics Metadata Api
-
Zoho Bigin
-
Zoho CRM
-
Zonka Feedback
-
Zoom
Why you should choose Power BI for your reporting
Advanced data analysis capabilities
Support for machine learning and natural language processing
Role-based access control (RBAC)
Custom visualizations
Scalability for enterprise needs
Mobile-friendly dashboards
How to connect your data with the Power BI connector?
Get ready-to-use data to build insightful and auto-updated dashboards in Power BI!
Quick start with Power BI dashboard templates
about your case. It doesn't cost you a penny 😉
What is a Power BI connector?
Whatever kind of dashboard you need to produce in Power BI, Coupler.io will simplify everything for you. There is no need to copy data manually from your preferred applications to Power BI. You can also use pre-configured Power BI dashboard templates to speed up the reporting process even further. These templates contain all the necessary metrics for marketing, sales, and other use cases. You will just need to connect to your data sources and Power BI to automate your reporting process.


