QuickBooks Data Connector
Connect, consolidate, and automate QuickBooks across entities and currencies — send your data to Sheets, Power BI, dashboards, warehouses, or AI tools automatically.


How to set up your QuickBooks integration
Get more from QuickBooks data — export, consolidate and analyze it your way

Export
Consolidate
Report and analyze
Integrate QuickBooks with these destinations


What data you can export from QuickBooks?
-
Account
-
Attachable
-
Bill
-
BillPayment
-
Budget
-
Class
-
CompanyInfo
-
CreditMemo
-
Customer
-
Department
-
Deposit
-
Employee
-
Estimate
-
ExchangeRate
-
Invoice
-
Item
-
JournalEntry
-
JournalCode
-
Payment
-
PaymentMethod
-
Preferences
-
Purchase
-
PurchaseOrder
-
RefundReceipt
-
SalesReceipt
-
TaxAgency
-
TaxCode
-
TaxRate
-
Term
-
TimeActivity
-
Transfer
-
Vendor
-
VendorCredit
Why QuickBooks users love Coupler.io?
Move faster
Trust your numbers
Uncover deeper insights
Empower your team
Connect and grow
It was a win-win for everyone. Our clients were thrilled to have their numbers at their fingertips, any time of day or night, without having to consult QuickBooks or their bookkeeper. Our company freed up plenty of resources, improved the customer lifetime value, and found a way to stand out among other competing services.

Let your QuickBooks data work for you
💼 For finance professionals
🌟 For business owners
Use Coupler.io dashboards templates
Coupler.io offers a range of ready-to-use interactive dashboard templates designed to streamline your reporting and analytics. Explore our template gallery and connect your QuickBooks to start using the plug-and-play dashboard right away.

Monitor income and expenses from your multi-currency QuickBooks Online account on one interactive dashboard. Review revenue breakdowns and cost trends across currencies.


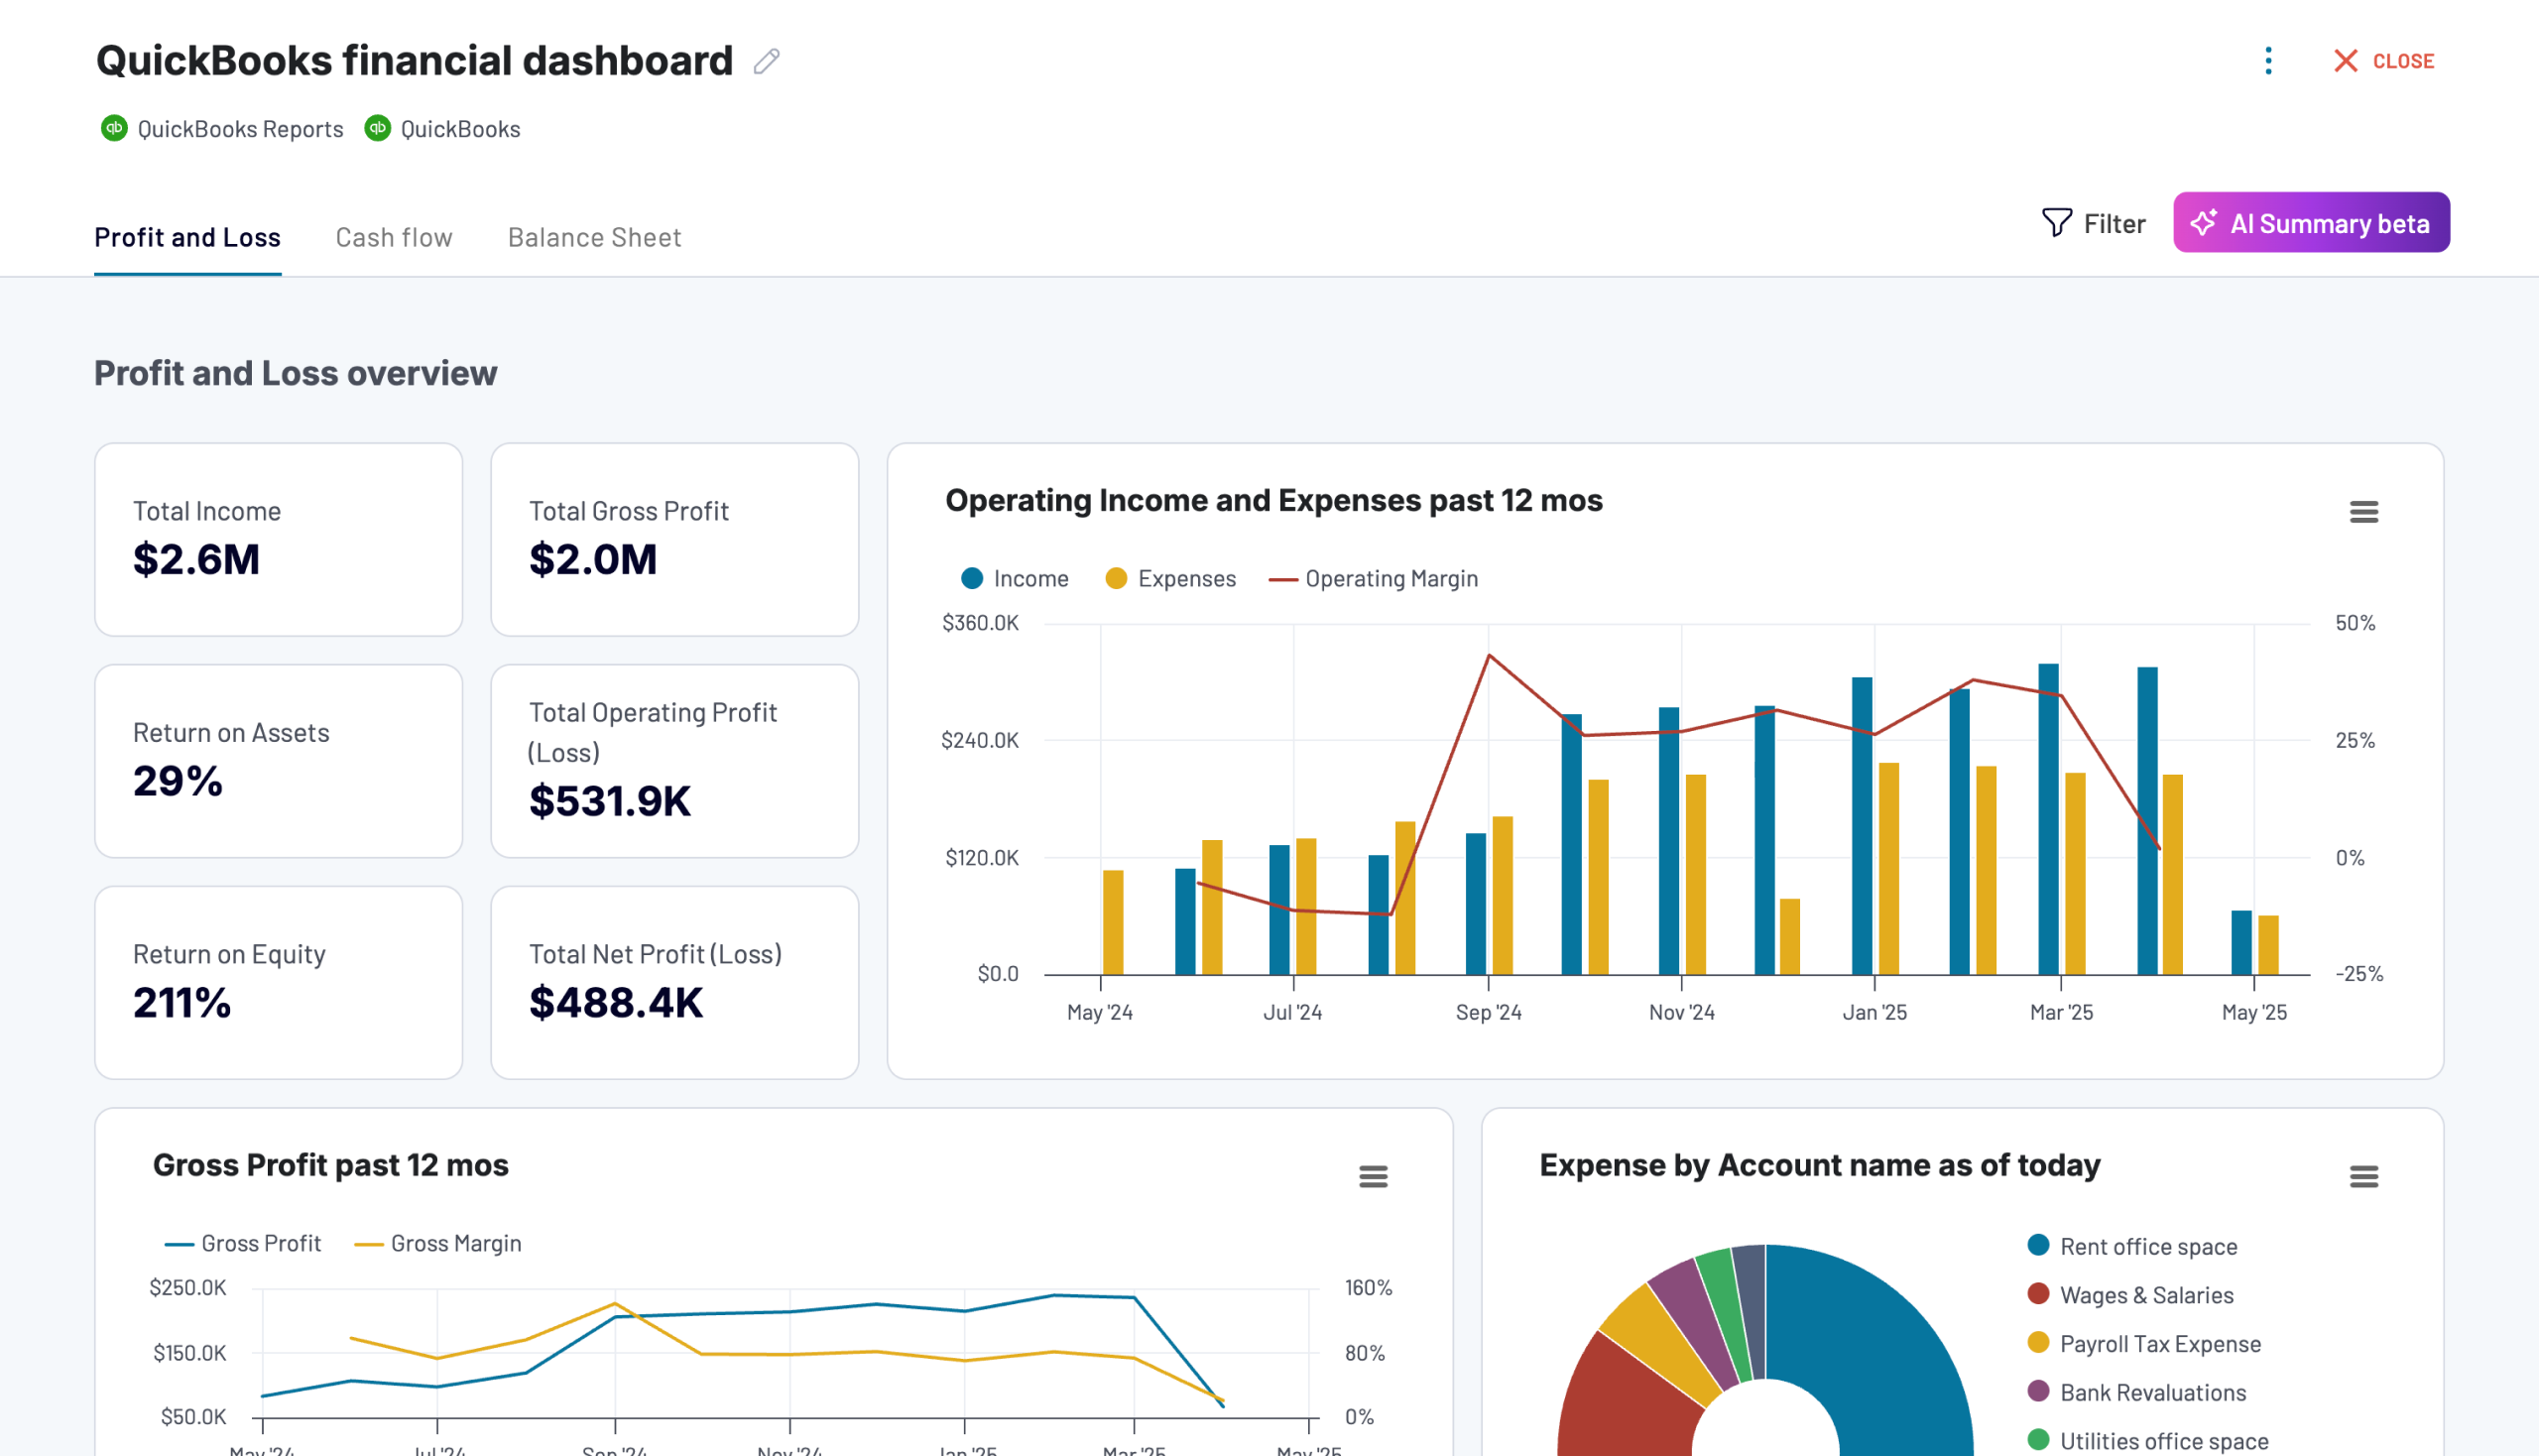
Tracks earnings, monitor cash flow, and analyze balance sheet changes with a dedicated dashboard that provides a clear picture of your business finances.


Get a clear snapshot of your business finances, including cash flow, P&L, balance sheets, and bank accounts, powered by data from QuickBooks Online.

about your case. It doesn't cost you a penny 😉
Data set templates gallery
Track yearly revenue by customer and class to identify top clients, analyze class-level performance, and understand sales distribution across your business segments.
Review your business’s financial performance across the past 12 months. This dataset includes separate views for net, gross, and operating profit trends, along with a detailed breakdown of revenues and expenses by account.
Track invoice status, payment progress, and outstanding balances to evaluate billing performance and cash inflow.
Analyze invoices alongside item-level data to monitor billing status, amounts due, and product-specific performance. Please note that invoices with line items have duplicates for invoices featuring more than one SKU
Compare detailed profit and loss records for the current and previous months to monitor income, expenses, and profitability
Gain a comprehensive breakdown of income and expenses across the year, with grouped financial insights and key profitability metrics
Review the structure of your chart of accounts by classification, type, and activity status to ensure consistent categorization and identify unused accounts
Track outstanding and paid bills by vendor, due date, amount, and balance to manage payables and maintain healthy cash flow
about your case. It doesn't cost you a penny.
Blend QuickBooks data with marketing and sales data


