Income statement dashboard examples and reporting templates
Gain complete visibility into your financial performance with automated income statement reporting dashboards that consolidate data from QuickBooks or Xero. Track revenue streams, monitor expenses by category, analyze profit margins, and make strategic decisions based on real-time financial insights.
Income statement dashboards for every need


about your case. It doesn't cost you a penny 😉
Choose your income statement dashboard template to kick off
What is an income statement dashboard?
Modern income statement dashboards go beyond showing basic revenue and expense figures by breaking down financial performance by product lines, customer segments, time periods, and categories. With automated data refreshing through Coupler.io, these dashboards ensure you're always working with the most current financial information without manual data entry. This creates a single source of truth that helps finance teams, executives, and stakeholders understand the company's financial trajectory at a glance.

What reports should be included on a meaningful income statement dashboard?
A comprehensive income statement reporting dashboard should include several key reports that provide a complete picture of your company's financial performance. Based on our analysis of QuickBooks and Xero-based dashboards, we recommend incorporating these four essential report types:
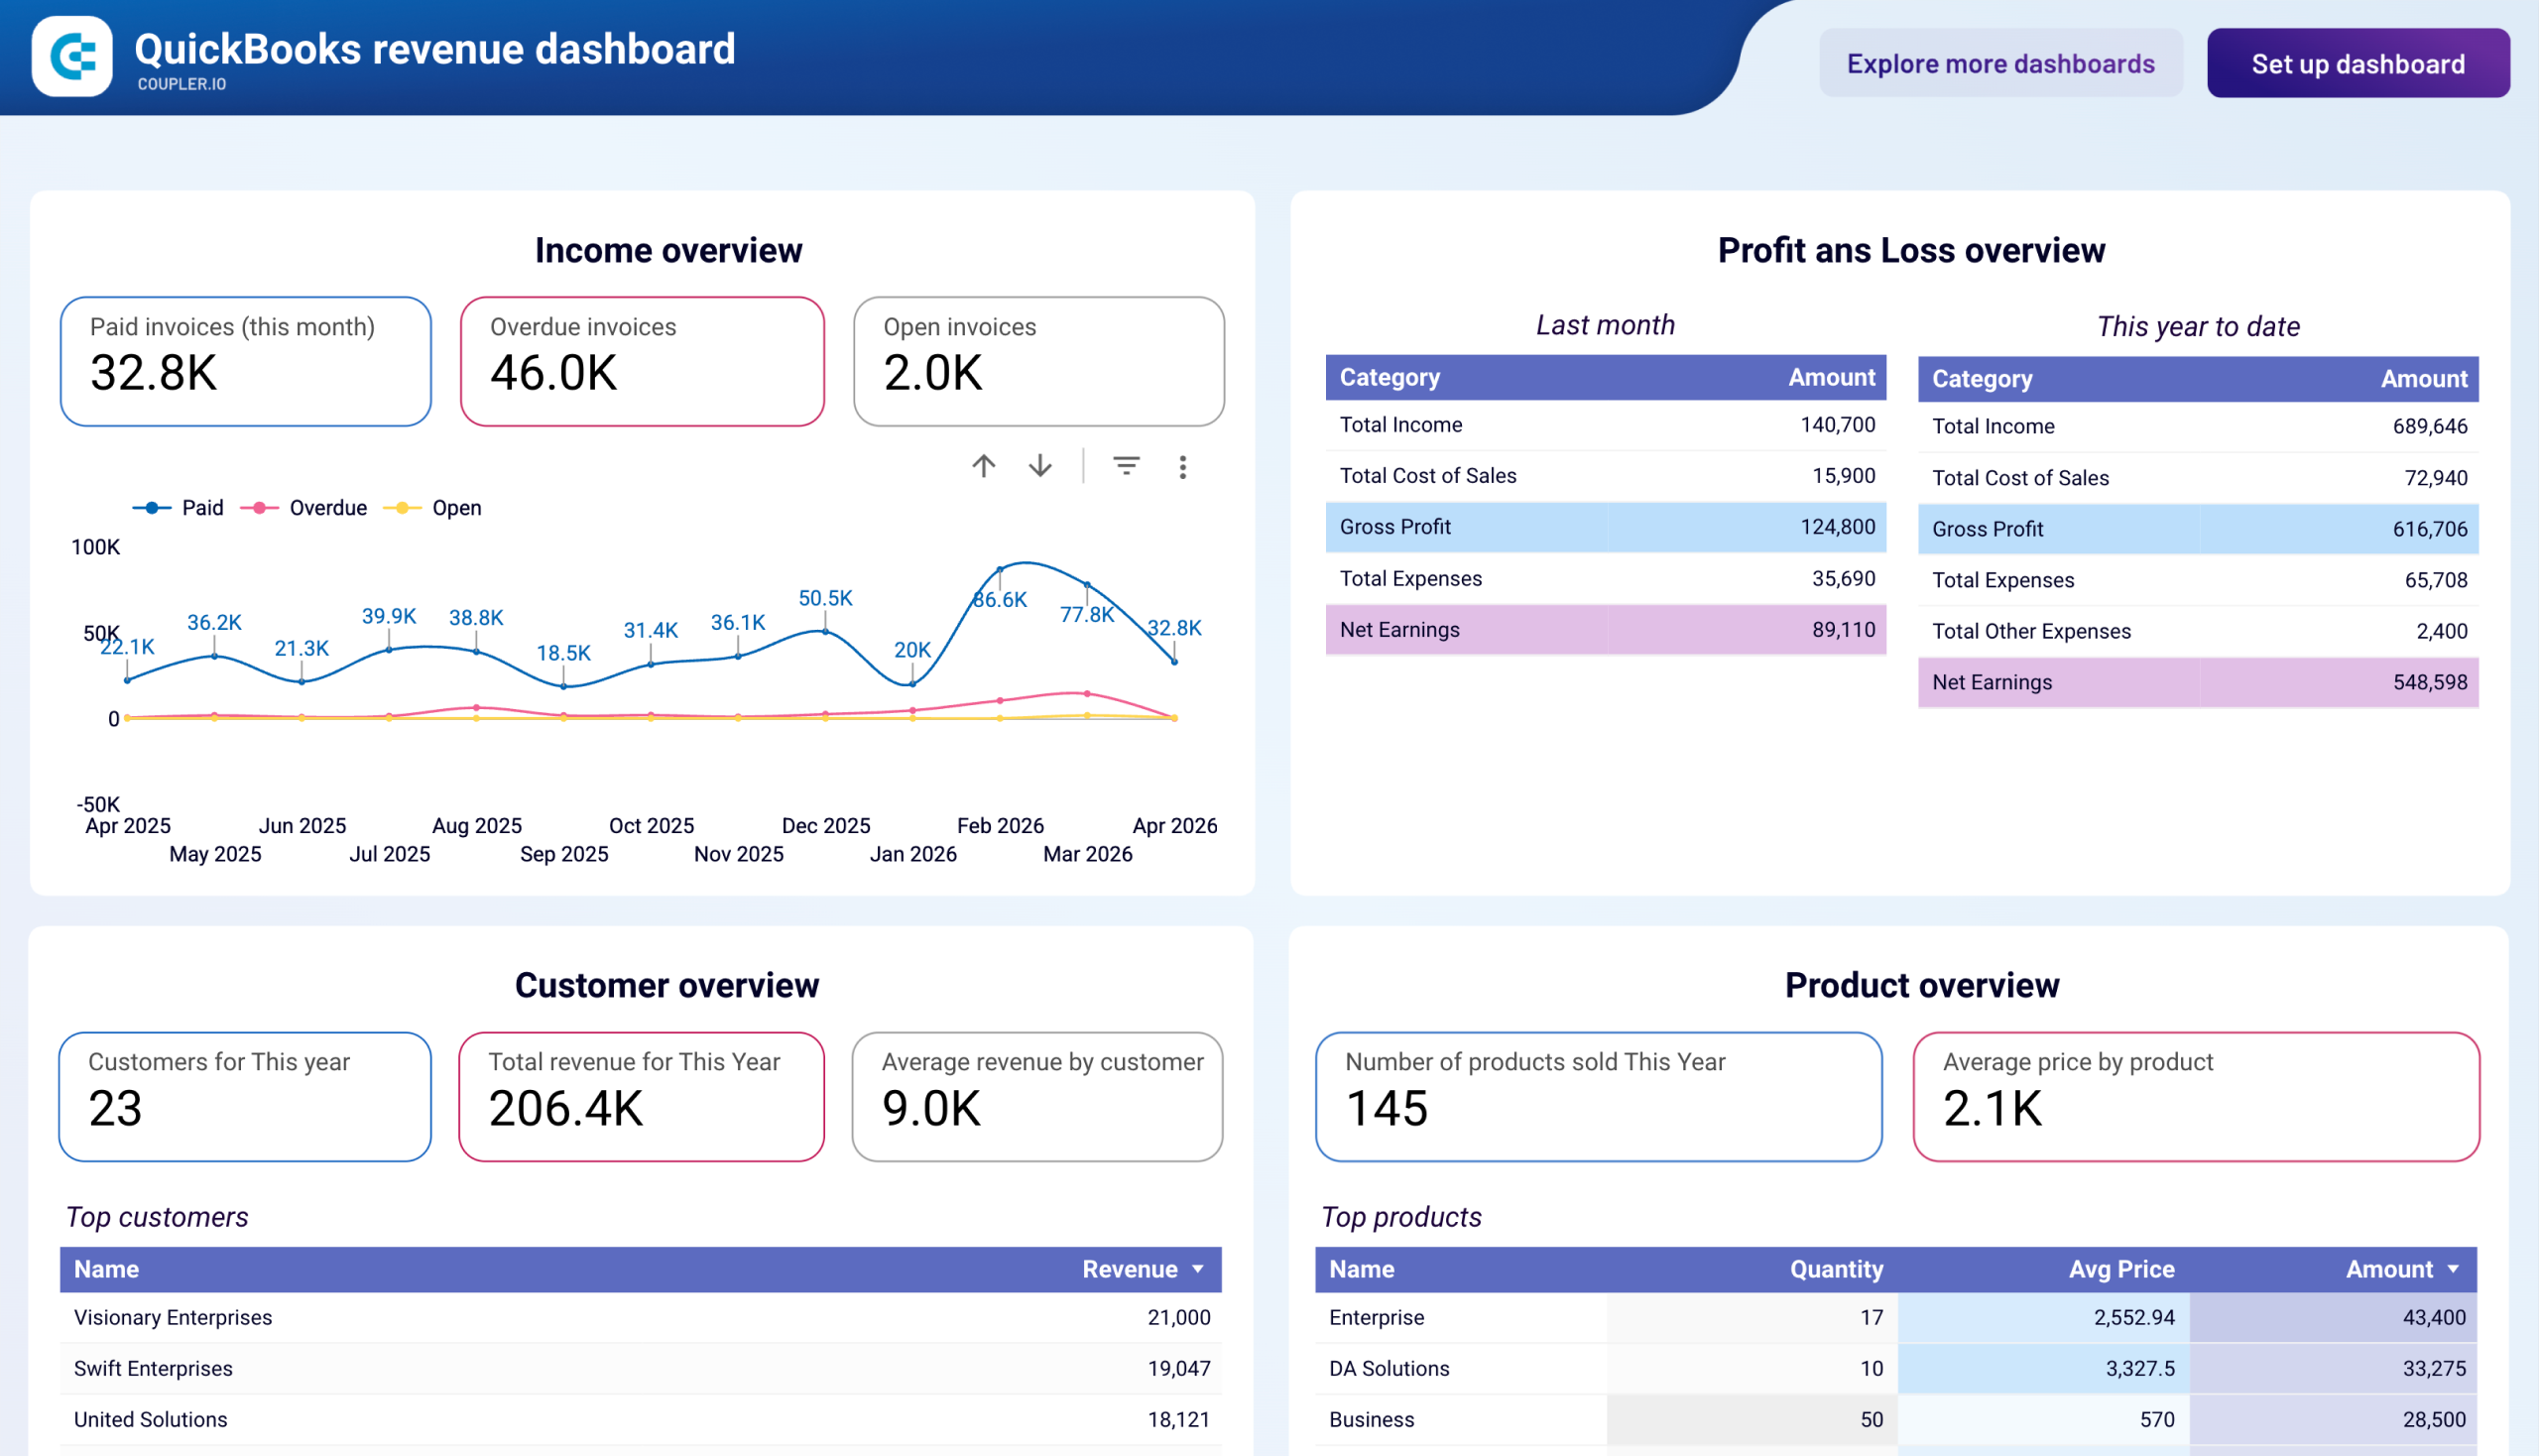
The income overview report enables you to track overall revenue trends for the last 12 months. This visualization helps you identify seasonal fluctuations, peak revenue periods, and any unexpected dips in income. The report shows the revenue distribution by customers and products, helping you understand which segments drive your business. By analyzing these patterns, you can adjust your strategies to maximize revenue opportunities and address potential shortfalls before they impact your bottom line.
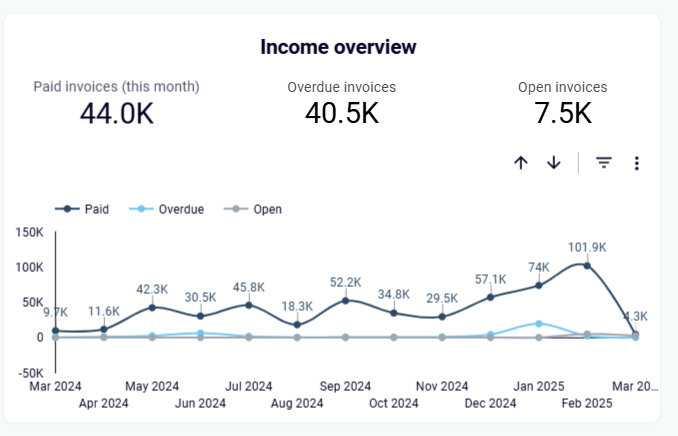
The profit and loss overview report provides insights into net income by comparing revenue and expenses across multiple periods (last month, month to date, and year to date). This multi-timeframe view enables you to assess how well your business is managing costs relative to income. The report includes visual comparisons of your earning trends, allowing you to quickly spot growth patterns or areas needing improvement. These insights are crucial for budgeting, financial planning, and strategic decision-making.
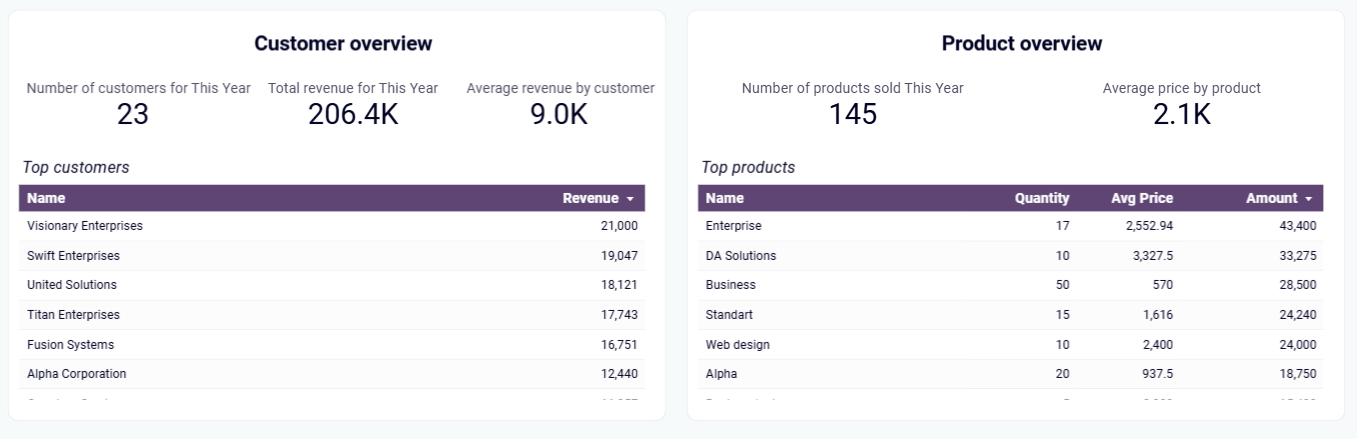
The customer overview report shows your most valuable customers by revenue contribution. It includes rankings of top customers and visual breakdowns of their share in your total revenue. This information is vital for targeted marketing efforts and customer retention strategies. By understanding which customers drive the most income, you can prioritize relationship management, develop loyalty incentives for high-value clients, and focus resources on your most profitable customer segments.
The product overview report helps you see which products or services generate the most revenue for your business. It includes performance metrics for different offerings and identifies your best-selling items by both volume and revenue. This insight is essential for inventory management, product promotion, and understanding market demand. By analyzing product performance data, you can adjust your sales strategies based on high or low-performing items, optimize your product mix, and allocate resources to your most profitable offerings.
What insights you can get with the income statement dashboard
The income statement dashboard provides clear visualization of monthly revenue dynamics across a 12-month period, revealing seasonal fluctuations and growth trends. You can quickly identify peak revenue periods, spot concerning downturns, and compare performance against previous periods or targets. This insight enables proactive planning for seasonal fluctuations and timely adjustments to sales and marketing strategies during slow periods.
The profit and loss section delivers side-by-side comparisons of your financial performance across multiple time frames: last month completed, current month to date, and year to date. The dashboard visualizes the relationship between revenue and expenses, highlighting net income trends through intuitive charts that make performance patterns immediately apparent. This multi-period view provides crucial context for understanding your company's financial trajectory.
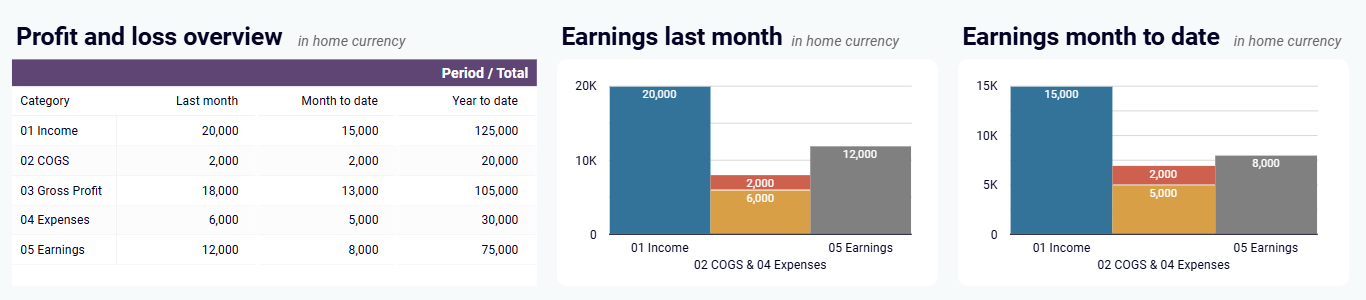
The balance sheet overview provides a clear snapshot of your company's assets, liabilities, and equity at specific points in time. The dashboard visualizes these components through comparative charts showing the relationship between what you own and what you owe. This insight helps you understand your company's financial position and liquidity, giving you a comprehensive view of business health that complements your income statement data.
The product overview section reveals which offerings generate the most revenue and contribute the highest profit margins to your business. The dashboard segments performance by product category, customer type, or service line, providing critical insights for portfolio management. This visualization helps you identify which products to promote more aggressively and which may need pricing adjustments or cost optimizations to improve profitability.
How to create an income statement dashboard?

Metrics you can track with the income statement dashboard templates
Track your company's income patterns with month-by-month revenue analysis over a 12-month period. The income statement dashboard presents this data through intuitive charts showing revenue fluctuations throughout the year. This metric helps identify seasonal variations, peak revenue periods, and any unexpected dips, providing essential context for forecasting and strategic planning to maximize future revenue opportunities.
Monitor your net income by comparing revenue and expenses across multiple time periods (last month, month to date, and year to date). The dashboard displays this metric in both tabular and visual formats, making it easy to assess profitability trends and identify areas requiring attention. This comprehensive view helps you understand the relationship between sales activities and cost management, enabling better budgeting and financial planning.
Visualize revenue distribution across your customer base with rankings of your most valuable clients by income contribution. The dashboard presents both a list of top customers by revenue and pie charts showing percentage contributions to overall sales. This insight enables targeted relationship management, helps prioritize account servicing efforts, and informs customer retention strategies to protect your most valuable revenue streams.
Identify which products or services generate the most revenue for your business through clear visualizations of your top-performing offerings. The dashboard ranks products by sales volume and revenue contribution, helping you understand which items drive your financial performance. This metric is crucial for inventory management, marketing focus, and product development decisions to maintain a profitable product mix.
Track your bottom-line profitability over time with clear visualization of net income trends across different reporting periods. The dashboard shows how your profit evolves month by month, highlighting patterns and helping you identify factors influencing financial performance. This critical metric reflects how effectively your business converts revenue into profit after accounting for all expenses, serving as a key indicator of overall financial health.
Monitor your available funds across all linked bank and cash accounts with a comprehensive overview of account balances. The dashboard presents this information with a breakdown by currency for businesses handling multi-currency transactions. This metric provides immediate visibility into your liquid assets, helps ensure accounts are reconciled, and supports day-to-day operational decisions by showing exactly what financial resources are available across all your accounts.
Track your available funds across all bank and cash accounts with clear visualization of your current liquidity. The dashboard displays account balances by currency, providing an important connection between income statement performance and actual cash position. This metric helps ensure that profitability on paper translates to real financial resources for operations, investments, and growth opportunities.