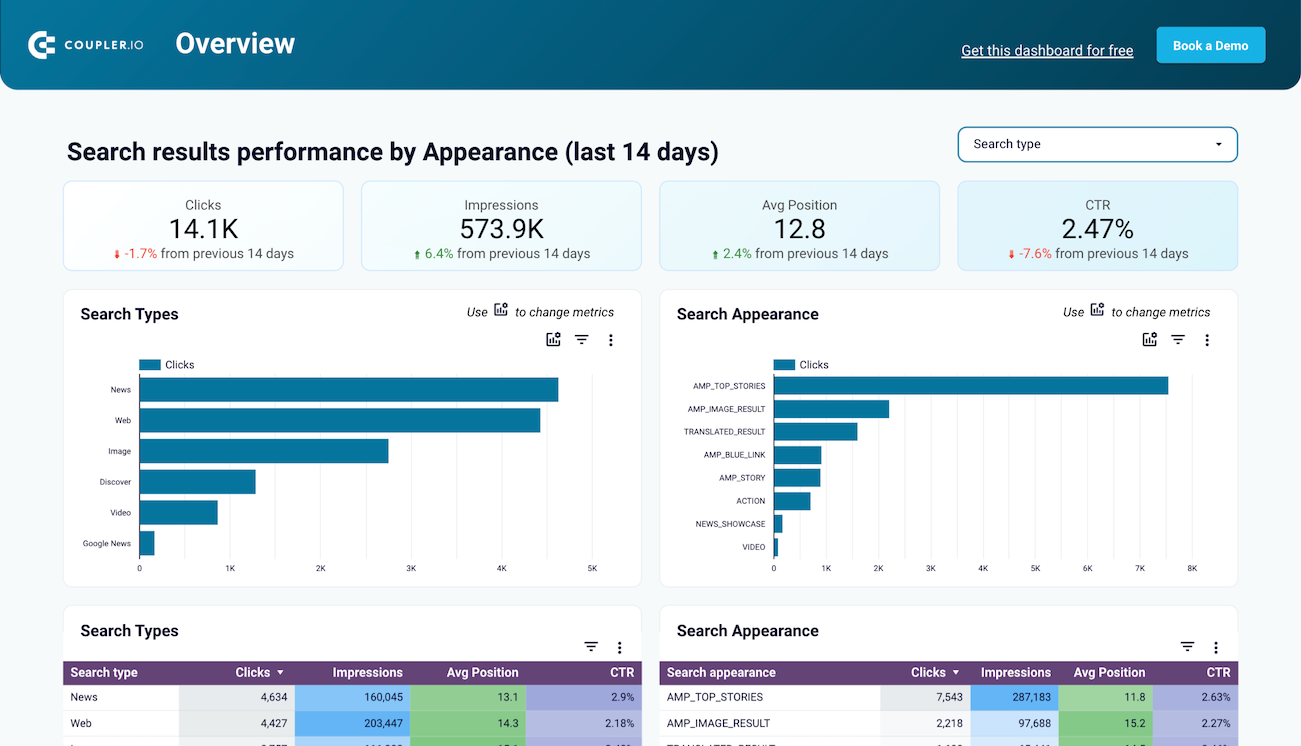
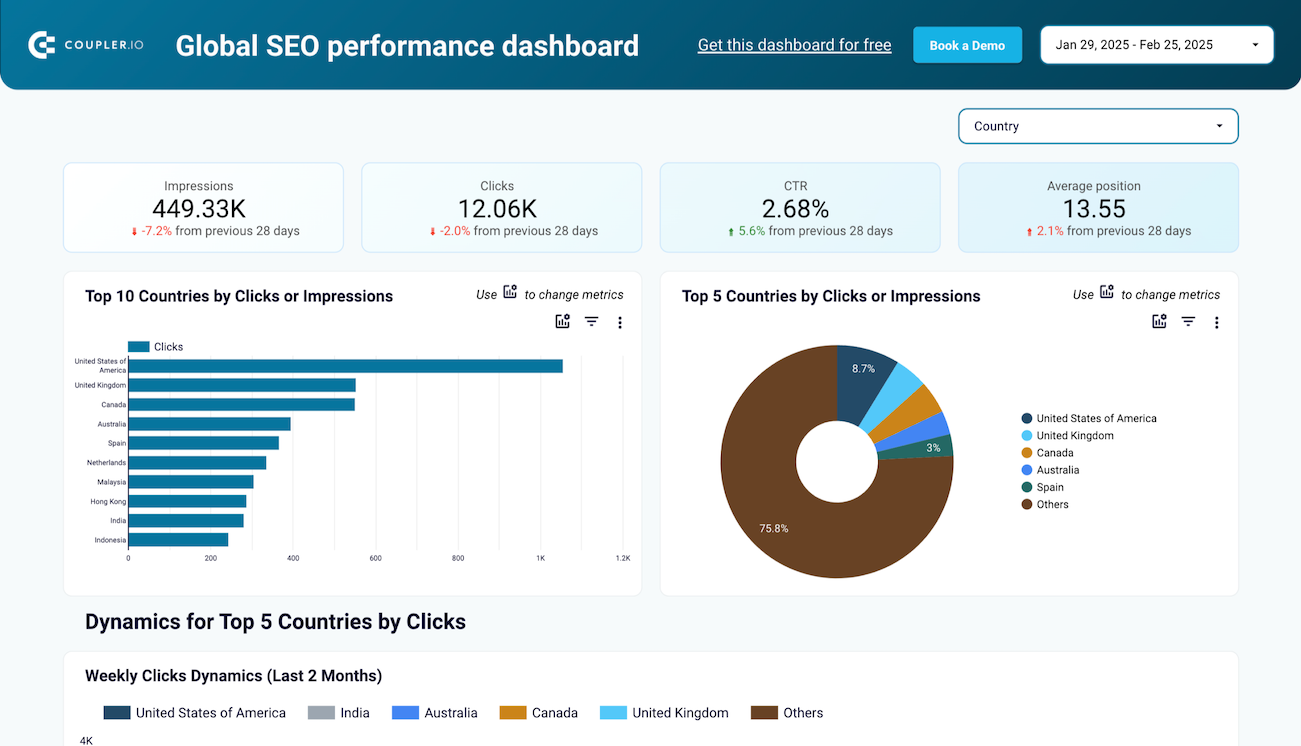
Google Search Console dashboard template

Our Google Search Console dashboard template is designed in Looker Studio and you can easily integrate it with your GSC account. Follow simple steps to automate data flow and convert it into meaningful insights.

Data sources used
Google Search Console

Quick overview of the Google Search Console dashboard

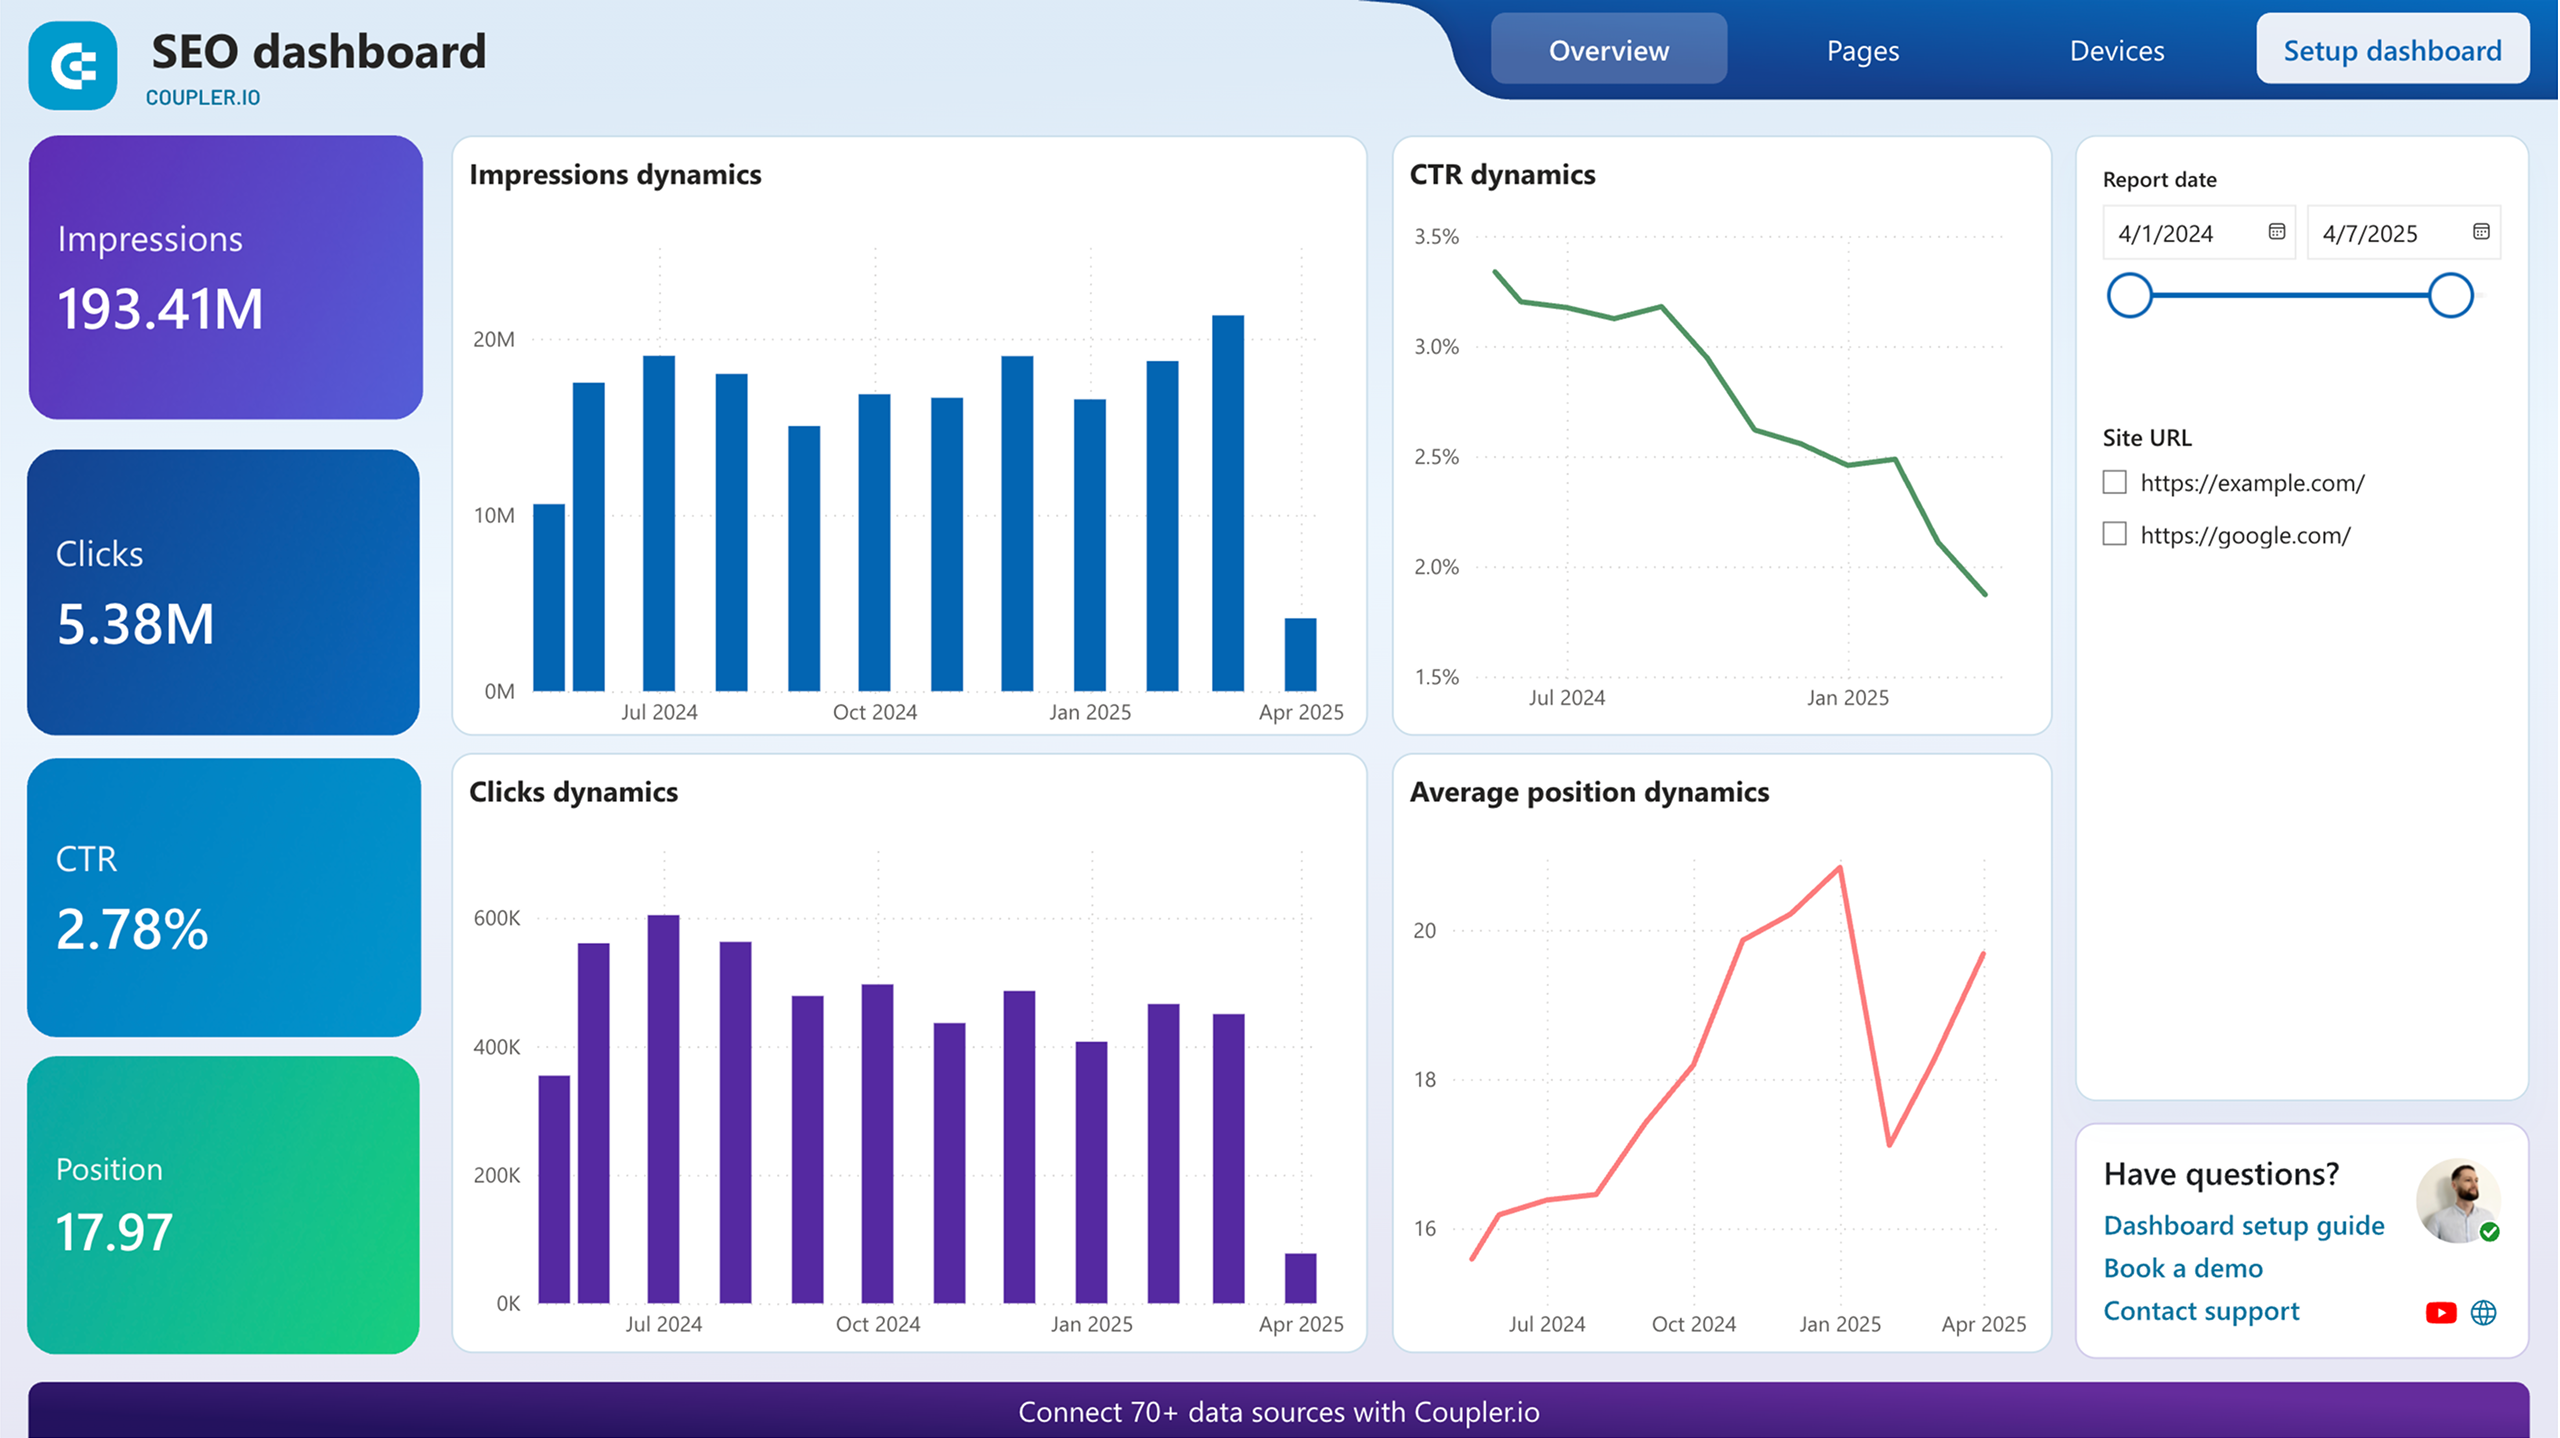
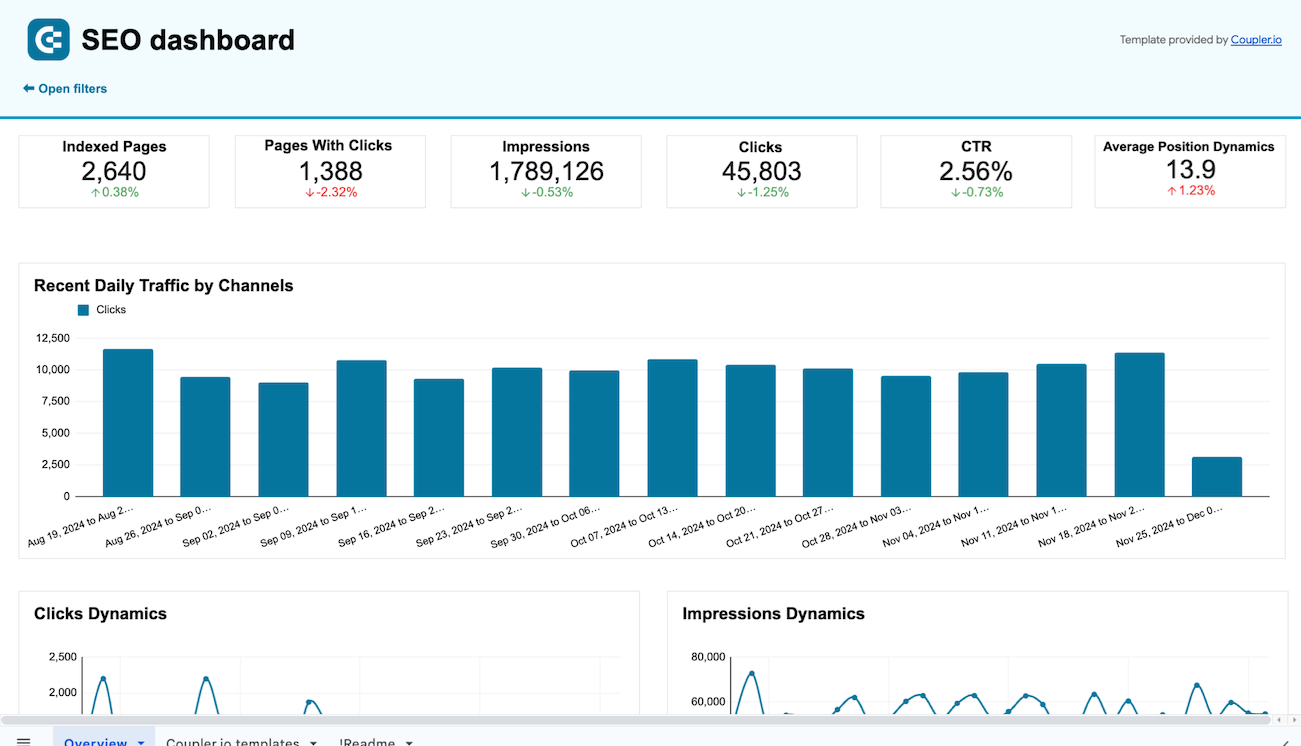
Monitor the dynamics of clicks and impressions your website gets, as well as the average CTR and position of all your pages.

Track metrics dynamics image

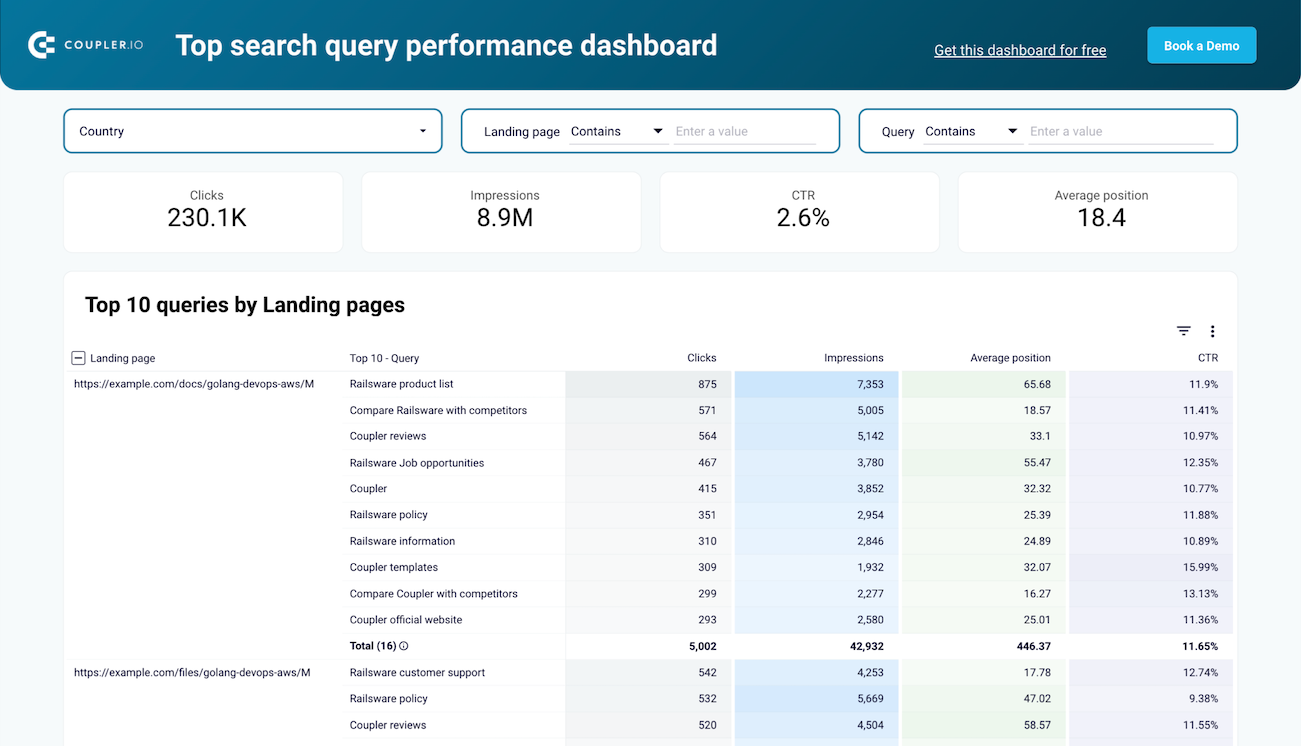
Get an overview of the best and worst performing website pages by clicks to prioritize your marketing investments.

Quickly identify the best and worst performers image

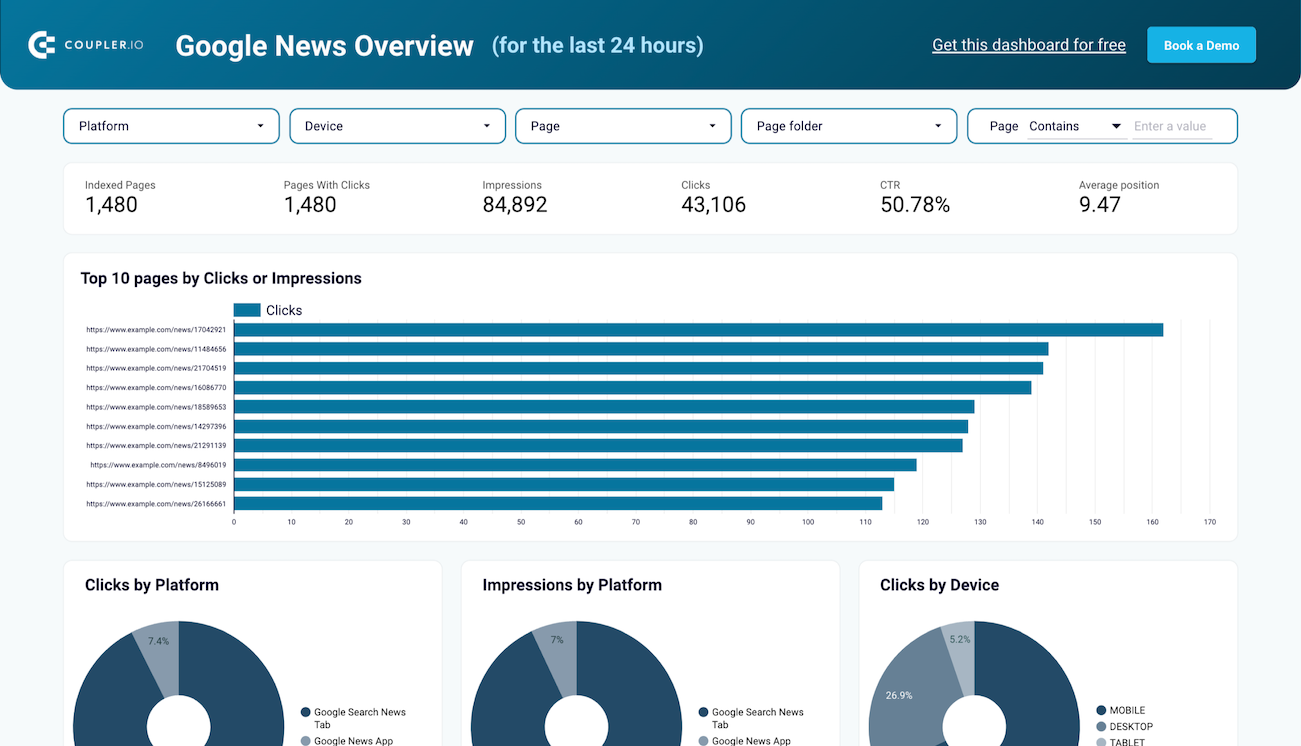
Understand the total share of devices your audience uses to visit your website.

Get a breakdown of device metrics image

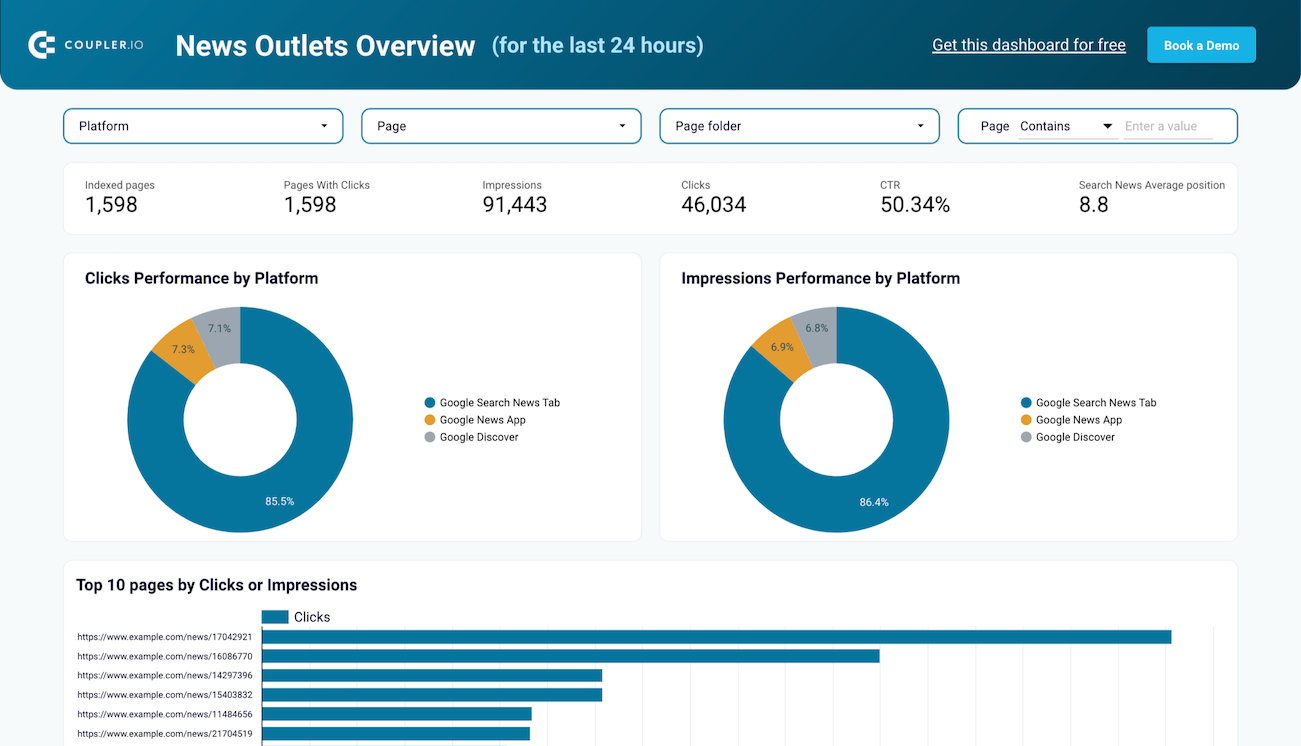
See the clicks, impressions, and CTR of all your URLs on different types of devices, including desktop, mobile, and tablet.

Dive into each URL performance image
Track metrics dynamics image
Quickly identify the best and worst performers image
Get a breakdown of device metrics image
Dive into each URL performance image

Acquire peace of mind with the Google Search Console dashboard template

Plug-and-play analytics solution icon

Plug-and-play analytics solution

Dive into essential metrics effortlessly without designing a Search Console dashboard from scratch. Connect the template to your GSC account easily by following our straightforward guide.

Scheduled data refresh icon

Scheduled data refresh

The Search Console dashboard template is equipped with Coupler.io's connector. It allows you to schedule data refresh for your report as frequently as every 15 minutes.

White-label template icon

White-label template

Personalize the Search Console dashboard template to match your specific requirements. You can modify metrics, visual elements, filters, and more. Share insights from your GSC report effortlessly with just a click.

No need to build a Google Search Console dashboard from scratch.
Use the fully automated template!

Check out the Coupler.io dashboard gallery

Sources
Destinations
Categories:
All-in-one marketing dashboard image
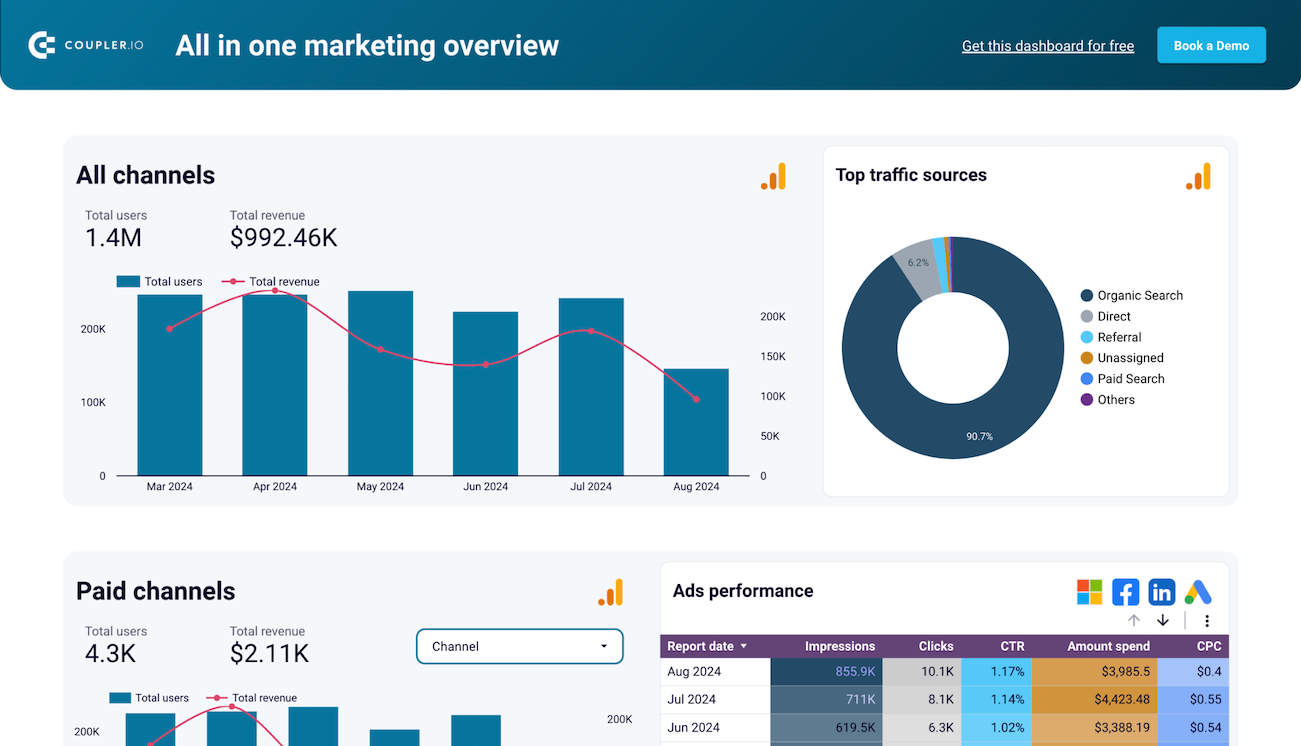
All-in-one marketing dashboard

Monitor all your marketing channels with an all-in-one dashboard providing performance overviews of web analytics, ad campaigns, SEO, social media, and emails.

Google Search Console icon Facebook Page Insights icon Facebook Ads icon Bing Ads icon Mailchimp icon Instagram Insights icon YouTube icon Google Ads icon LinkedIn Ads icon Google Analytics 4 icon Klaviyo icon arrow icon Looker Studio icon
All-in-one social media analytics dashboard image
All-in-one social media analytics dashboard

Get an overview of your social media analytics on one dashboard that collects data from Facebook, Instagram, LinkedIn, YouTube, and GA4

Instagram Insights icon Google Analytics 4 icon Facebook Page Insights icon YouTube icon arrow icon Looker Studio icon
PPC multi-channel dashboard for Looker Studio image
PPC multi-channel dashboard for Looker Studio

Get a comprehensive PPC reporting tool to track the performance of your campaigns launched at multiple advertising platforms.

Google Ads icon Facebook Ads icon TikTok Ads icon Quora Ads icon Bing Ads icon LinkedIn Ads icon X (Twitter) Ads icon arrow icon Looker Studio icon
Google Analytics PPC dashboard image
Google Analytics PPC dashboard

Get an overview of the traffic performance of your advertising campaigns launched across different PPC platforms.

TikTok Ads icon Google Ads icon Snapchat Ads icon LinkedIn Ads icon Bing Ads icon X (Twitter) Ads icon Facebook Ads icon Google Analytics 4 icon arrow icon Looker Studio icon
PPC monthly budget dashboard for Google Sheets image
PPC monthly budget dashboard for Google Sheets

Monitor how much you spend on your ads across multiple platforms using a one-stop PPC monthly budget dashboard template.

TikTok Ads icon Quora Ads icon LinkedIn Ads icon Google Ads icon X (Twitter) Ads icon Facebook Ads icon Bing Ads icon arrow icon Google Sheets icon
TikTok analytics dashboard image
TikTok analytics dashboard

Get an overview of TikTok data and metrics that provide insights into how your content performs on the platform.

Tiktok Organic icon arrow icon Looker Studio icon
Web Analytics dashboard for Power BI image
Web Analytics dashboard for Power BI

Discover insights into your website’s traffic acquisition, audience, and conversions with Google Analytics 4 data seamlessly connected to our Power BI dashboard template.

Google Analytics 4 icon arrow icon Power BI icon
Web Analytics dashboard image
Web Analytics dashboard

Use the insights based on the data from GA4 to monitor your website traffic and discover which pages resonate most with your audience.

Google Analytics 4 icon arrow icon Looker Studio icon
Google Analytics dashboard for multiple properties image
Google Analytics dashboard for multiple properties

Get a traffic overview of all your GA4 properties to monitor and compare their performance in one dashboard.

Google Analytics 4 icon arrow icon Looker Studio icon
X (Twitter) Ads dashboard image
X (Twitter) Ads dashboard

Monitor the key performance metrics of your ad campaigns launched in X (Twitter) and track their monthly dynamics in one dashboard.

X (Twitter) Ads icon arrow icon Looker Studio icon
Bing Ads Dashboard in Looker Studio image
Bing Ads Dashboard in Looker Studio

Understand how your Bing Ads advertising campaigns perform and keep track of the monthly dynamics of clicks, spend, and other key metrics.

Bing Ads icon arrow icon Looker Studio icon
Facebook Ads dashboard image
Facebook Ads dashboard

Effectively manage and optimize your Facebook advertising campaigns, reaching your target audience in a data-driven way.

Facebook Ads icon arrow icon Looker Studio icon
Facebook Ads dashboard in Google Sheets image
Facebook Ads dashboard in Google Sheets

Monitor the performance of your advertising campaigns in Facebook and identify top assets to spend your budget wisely.

Facebook Ads icon arrow icon Google Sheets icon
Instagram Business Dashboard image
Instagram Business Dashboard

Get an overview of your Instagram post performance, profile interactions, and demographic insights about your followers, all within a single dashboard

Instagram Insights icon Instagram Public Data icon arrow icon Looker Studio icon
Brand Awareness Dashboard in Power BI image
Brand Awareness Dashboard in Power BI

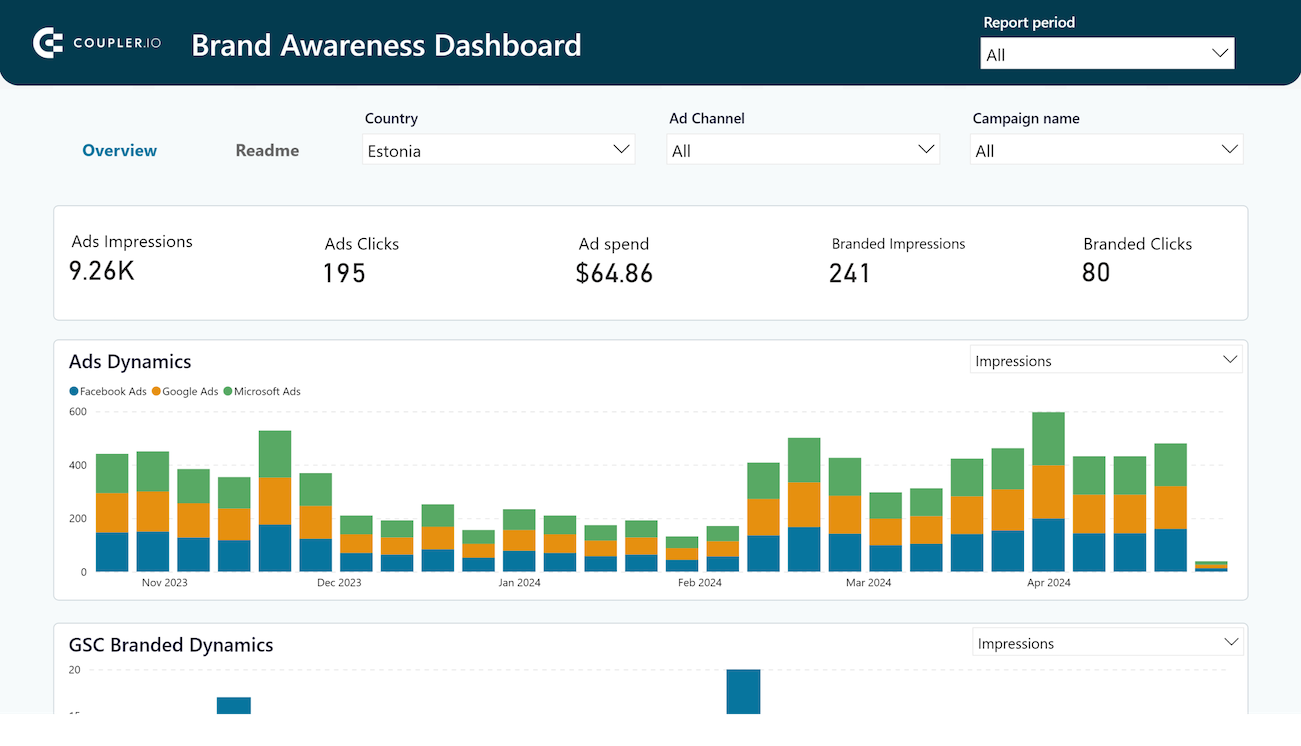
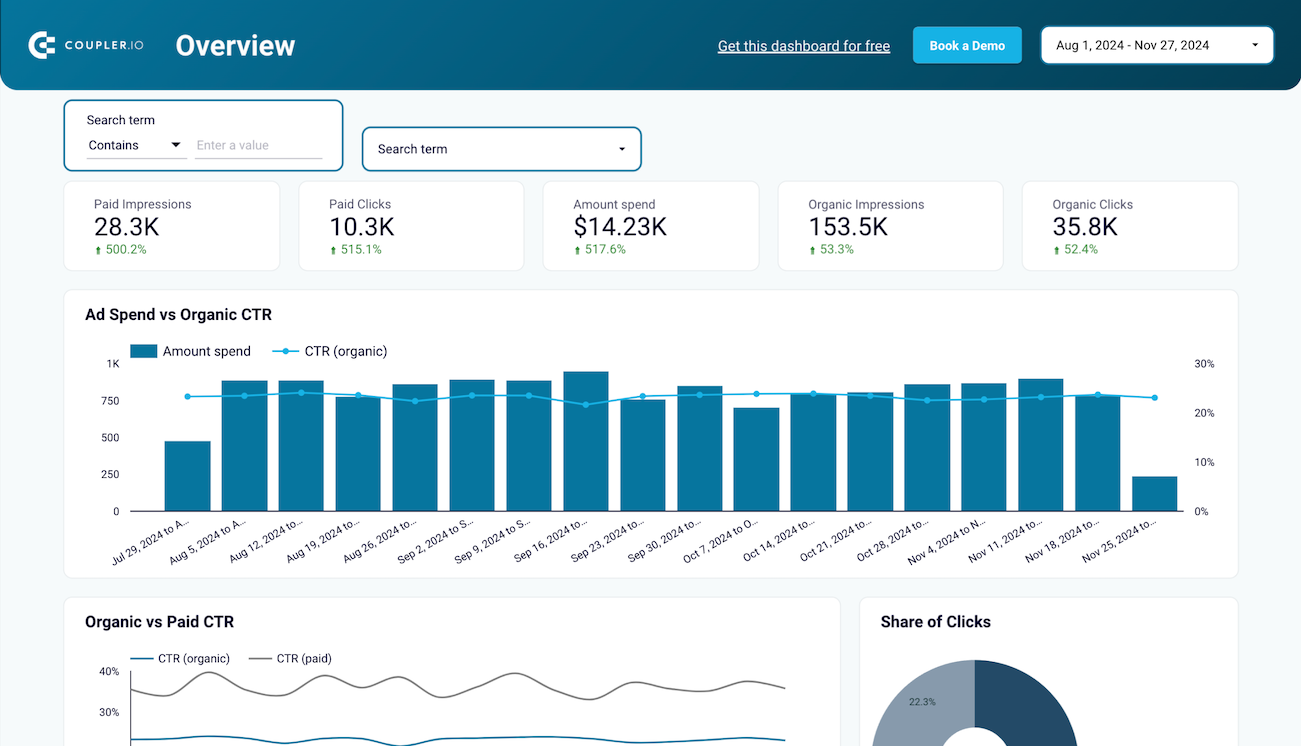
Understand how your advertising campaigns in Facebook, Google, and Bing correlate with branded searches in Google to optimize your brand awareness.

Bing Ads icon Google Ads icon Google Search Console icon Facebook Ads icon arrow icon Power BI icon
Facebook Ads & Brand Awareness Dashboard image
Facebook Ads & Brand Awareness Dashboard

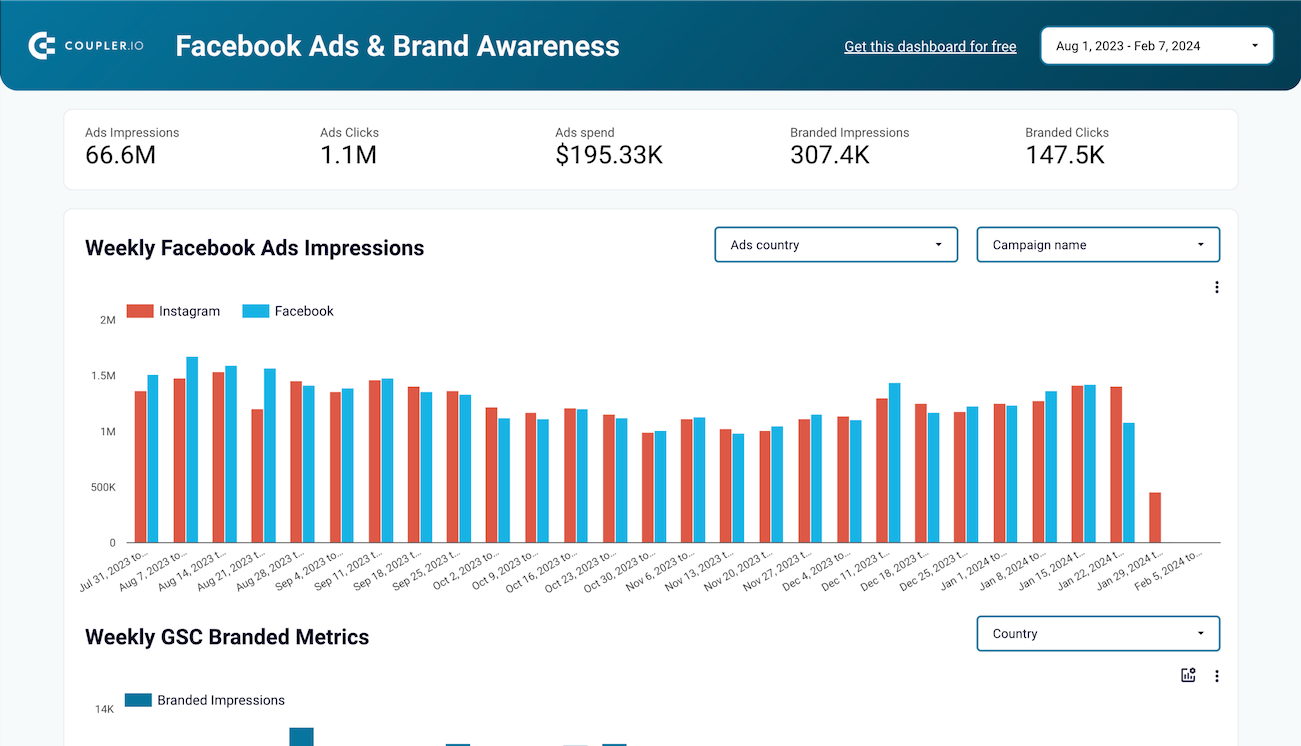
Understand how your Facebook or Instagram Ads campaigns impact brand awareness. Find a correlation between paid impressions and branded searches in Google. Check country by country with 2 simple charts to find where your Ad spend impacts the most.

Google Search Console icon Facebook Ads icon arrow icon Looker Studio icon
Shopify marketing funnel analytics image
Shopify marketing funnel analytics

Analyze the performance of the traffic to your Shopify store using data from advertising platforms and Google Analytics 4, all consolidated on a single dashboard.

Snapchat Ads icon Google Ads icon Facebook Ads icon TikTok Ads icon Quora Ads icon LinkedIn Ads icon Pinterest Ads icon X (Twitter) Ads icon Google Analytics 4 icon Bing Ads icon Shopify icon arrow icon Looker Studio icon
Accounts Receivable Dashboard for QuickBooks image
Accounts Receivable Dashboard for QuickBooks

See which customers accumulate unpaid and overdue invoices, analyze AR aging, and track changes over time. Get useful insights for maintaining financial health.

QuickBooks icon arrow icon Looker Studio icon
Accounts Payable Dashboard for QuickBooks image
Accounts Payable Dashboard for QuickBooks

Get an overview of unpaid, overdue, and paid bills grouped by vendor. The dashboard helps you prioritize payments and improve cash flow management.

QuickBooks icon arrow icon Looker Studio icon
QuickBooks Revenue dashboard template for Power BI image
QuickBooks Revenue dashboard template for Power BI

Monitor your income and expenses on an all-in-one revenue dashboard connected to your QuickBooks Online account.

QuickBooks icon arrow icon Power BI icon
QuickBooks Revenue dashboard template for Looker Studio image
QuickBooks Revenue dashboard template for Looker Studio

Get an overview of your revenue based on the data from QuickBooks and unlock in-depth insights to drive informed business decisions.

QuickBooks icon arrow icon Looker Studio icon
Google Ads dashboard image
Google Ads dashboard

Get a detailed overview of the performance of your Google ads advertising campaigns to achieve your marketing goals better.

Google Ads icon arrow icon Looker Studio icon
Keyword performance dashboard for Google Ads image
Keyword performance dashboard for Google Ads

Understand the performance of your Google Ads campaigns by specific keywords to identify which drive the most value.

Google Ads icon arrow icon Looker Studio icon
PPC multi-channel dashboard for Google Sheets image
PPC multi-channel dashboard for Google Sheets

Use a PPC dashboard designed for Google Sheets to track the performance of your campaigns across multiple advertising platforms.

X (Twitter) Ads icon Bing Ads icon LinkedIn Ads icon Google Ads icon TikTok Ads icon Quora Ads icon Facebook Ads icon arrow icon Google Sheets icon
PPC multi-channel dashboard with budget for Google Sheets image
PPC multi-channel dashboard with budget for Google Sheets

Monitor, analyze, and optimize the performance of your ads across various channels and your budget with our all-encompassing PPC dashboard for Google Sheets

X (Twitter) Ads icon Facebook Ads icon LinkedIn Ads icon Google Ads icon TikTok Ads icon Quora Ads icon Bing Ads icon arrow icon Google Sheets icon
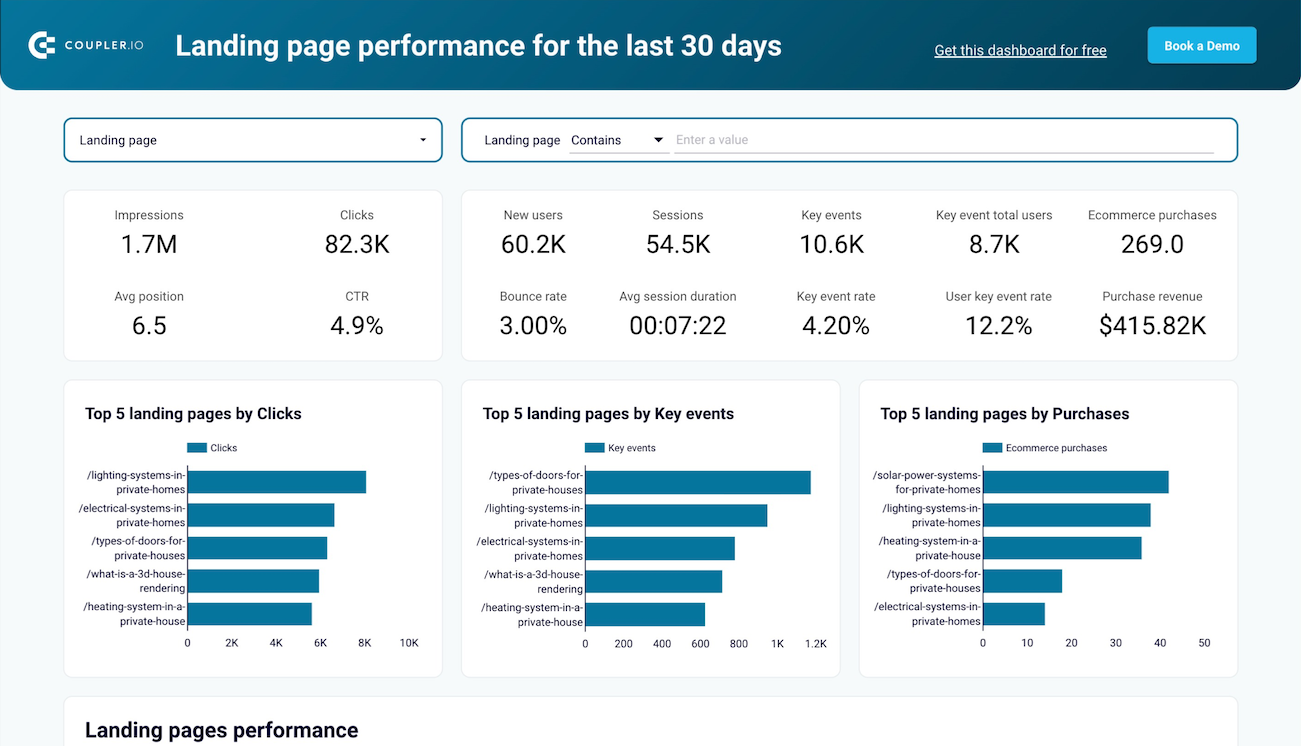
Landing page performance dashboard image
Landing page performance dashboard

Evaluate the effectiveness of your landing pages such as traffic, clicks, bounce rate, and other metrics collected from GSC and GA4 in one dashboard.

Google Analytics 4 icon Google Search Console icon arrow icon Looker Studio icon
SEO dashboard for Google Search Console  image
SEO dashboard for Google Search Console

Optimize SEO with Looker Studio's dashboard for Google Search Console. Track page rankings, CTRs, and organic traffic efficiently.

Google Search Console icon arrow icon Looker Studio icon
Technical SEO dashboard image
Technical SEO dashboard

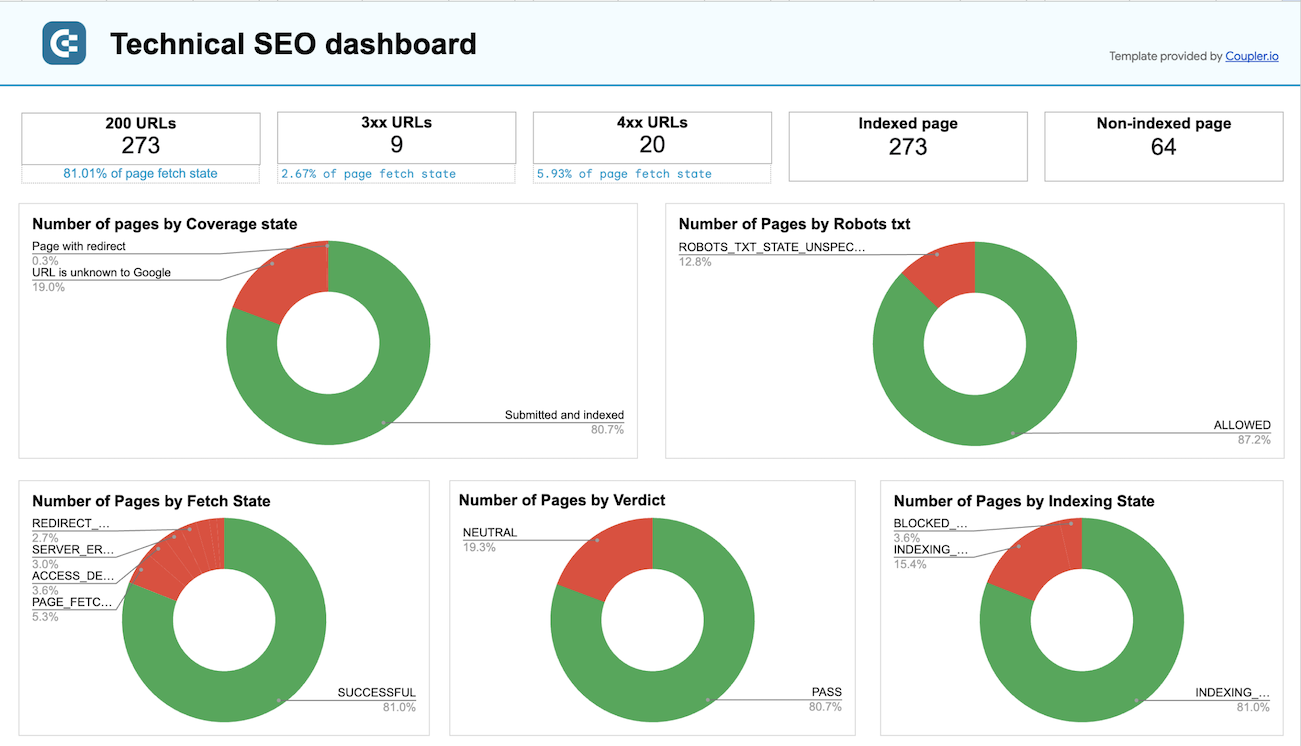
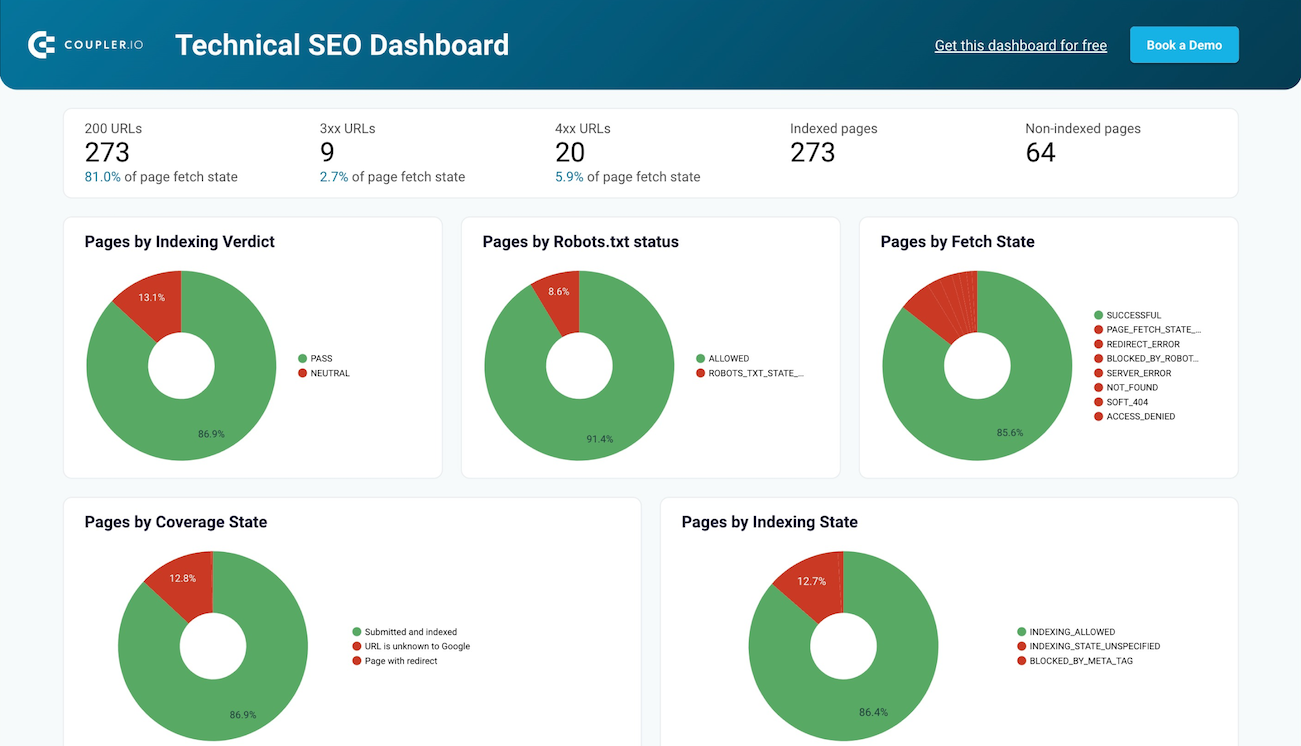
Track the technical SEO health of your website to make sure it operates efficiently for Google to find, crawl, and index your website pages.

Google Search Console icon arrow icon Looker Studio icon
Technical SEO dashboard in Google Sheets image
Technical SEO dashboard in Google Sheets

Get a useful spreadsheet dashboard that shows the technical SEO health of your website including indexing, canonicalization, and more.

Google Search Console icon arrow icon Google Sheets icon
Customer acquisition dashboard for Pipedrive image
Customer acquisition dashboard for Pipedrive

Use one dashboard to analyze the effectiveness of your Pipedrive acquisition funnel. Gain insights from data sourced from ad platforms and Google Analytics 4.

Google Analytics 4 icon LinkedIn Ads icon Pinterest Ads icon Bing Ads icon Facebook Ads icon Google Ads icon X (Twitter) Ads icon Snapchat Ads icon Pipedrive icon arrow icon Looker Studio icon
Sales KPI dashboard for Pipedrive image
Sales KPI dashboard for Pipedrive

Analyze the critical sales metrics and key performance indicators from Pipedrive, including deal details, revenue, and pipeline health, to make strategic decisions.

Pipedrive icon arrow icon Looker Studio icon
CRM dashboard for Pipedrive image
CRM dashboard for Pipedrive

Analyze the key metrics of your sales department, drill down into particular deals, find the top performers, and stay on top of your Pipedrive sales.

Pipedrive icon arrow icon Looker Studio icon
Google Ads and Meta Ads campaign performance dashboard image
Google Ads and Meta Ads campaign performance dashboard

Monitor and compare the performance of your PPC campaigns in Google Ads and Meta Ads to optimize budget allocation and improve outcomes.

Facebook Ads icon Google Ads icon arrow icon Looker Studio icon
PPC multi-channel dashboard for Power BI image
PPC multi-channel dashboard for Power BI

Utilize a Power BI PPC dashboard for tracking and analyzing your advertising campaigns across multiple platforms.

LinkedIn Ads icon Google Ads icon Quora Ads icon TikTok Ads icon X (Twitter) Ads icon Facebook Ads icon Bing Ads icon arrow icon Power BI icon
Apple Search Ads dashboard image
Apple Search Ads dashboard

Evaluate your Apple Search Ads campaigns by tracking key metrics to understand user behavior and optimize your ads performance.

Apple Search Ads icon arrow icon Looker Studio icon
TikTok Ads dashboard image
TikTok Ads dashboard

Keep an eye on views, engagement, budget costs, and conversion metrics to assess the success of your TikTok Ads campaigns.

TikTok Ads icon arrow icon Looker Studio icon
Snapchat Ads dashboard image
Snapchat Ads dashboard

Analyze your Snapchat Ads campaigns with detailed metrics on impressions, swipe-ups, views, spend dynamics, and purchases.

Snapchat Ads icon arrow icon Looker Studio icon
Quora Ads dashboard image
Quora Ads dashboard

Gain insights into your Quora Ads campaigns and monitor the performance metrics such as clicks, amount spent, conversions, and so on.

Quora Ads icon arrow icon Looker Studio icon
Google Ads dashboard for Power BI image
Google Ads dashboard for Power BI

Overview the performance of your advertising campaigns in Google Ads and track monthly dynamics of key metrics.

Google Ads icon arrow icon Power BI icon
Facebook Ads leads breakdown dashboard image
Facebook Ads leads breakdown dashboard

Analyze the performance of your advertising campaigns on Facebook in converting traffic into leads.

Facebook Ads icon arrow icon Looker Studio icon
Facebook Ads purchases breakdown dashboard image
Facebook Ads purchases breakdown dashboard

Get a detailed report to evaluate the effectiveness of your Facebook PPC campaigns in generating purchases.

Facebook Ads icon arrow icon Looker Studio icon
Facebook Ads dashboard for Power BI image
Facebook Ads dashboard for Power BI

Get a detailed overview of your advertising campaigns’ performance using a dynamic Power BI dashboard template equipped with a no-code Facebook Ads connector

Facebook Ads icon arrow icon Power BI icon
SEO dashboard for Power BI image
SEO dashboard for Power BI

Get insights into your page's SEO performance with our Power BI dashboard template integrated with Google Search Console.

Google Search Console icon arrow icon Power BI icon
Shopify sales funnel dashboard image
Shopify sales funnel dashboard

Analyze your Shopify store traffic by channels, countries, and items based on the data collected from Google Analytics 4

Google Analytics 4 icon arrow icon Looker Studio icon
Shopify orders dashboard image
Shopify orders dashboard

Access the performance of your Shopify ecommerce store and uncover critical insights into how to manage your orders effectively and increase revenue.

Shopify icon arrow icon Looker Studio icon
Customer acquisition dashboard for HubSpot image
Customer acquisition dashboard for HubSpot

Monitor your acquisition funnel and analyze its effectiveness using the insights from HubSpot CRM, advertising platforms, and Google Analytics 4.

Google Ads icon Snapchat Ads icon Facebook Ads icon Google Analytics 4 icon X (Twitter) Ads icon LinkedIn Ads icon Bing Ads icon HubSpot icon arrow icon Looker Studio icon
Sales KPI dashboard for HubSpot image
Sales KPI dashboard for HubSpot

Get an overview of the HubSpot sales metrics and KPIs to see how many deals are won or lost, how much revenue you generate, and derive other insights into pipeline health.

HubSpot icon arrow icon Looker Studio icon
CRM dashboard for HubSpot image
CRM dashboard for HubSpot

Get a complete understanding of your HubSpot sales and dive deeper into open and closed deals. Track the team performance, see how sales shape up over time, and analyze what drives your results.

HubSpot icon arrow icon Looker Studio icon
Salesforce CRM dashboard in Google Sheets image
Salesforce CRM dashboard in Google Sheets

Get a detailed overview of your opportunities in Salesforce and analyze the performance of your sales team.

Salesforce icon arrow icon Google Sheets icon
CRM dashboard for Salesforce image
CRM dashboard for Salesforce

Monitor your Salesforce sales efforts with an overview of your opportunities, accounts, and campaigns. Track the key metrics, check how the team performs, and understand what drives your revenues.

Salesforce icon arrow icon Looker Studio icon
Sales team performance dashboard for Salesforce in Google Sheets image
Sales team performance dashboard for Salesforce in Google Sheets

Monitor the effectiveness of your sales team and derive insights into how to optimize your sales pipeline conversions in Salesforce.

Salesforce icon arrow icon Google Sheets icon
Salesforce sales analytics dashboard image
Salesforce sales analytics dashboard

Analyze your sales funnel performance with the insights collected from Salesforce, Google Analytics, and the ad platforms you use for lead generation.

Facebook Ads icon X (Twitter) Ads icon Google Analytics 4 icon Snapchat Ads icon Google Ads icon LinkedIn Ads icon Bing Ads icon Salesforce icon arrow icon Looker Studio icon
Salesforce dashboard image
Salesforce dashboard

Get a comprehensive overview of your revenue, monitor the status of your deals, and derive other insights with the help of a Salesforce sales dashboard.

Salesforce icon arrow icon Looker Studio icon
Sales team performance dashboard for Salesforce image
Sales team performance dashboard for Salesforce

Get insights into your sales team's effectiveness in converting opportunities within your sales pipeline in Salesforce.

Salesforce icon arrow icon Looker Studio icon
Salesforce Win Loss analysis dashboard image
Salesforce Win Loss analysis dashboard

Get detailed analytics of your lost and won opportunities by amount, lead source, country, and more on one interactive dashboard.

Salesforce icon arrow icon Looker Studio icon
Email marketing analytics dashboard for Mailchimp image
Email marketing analytics dashboard for Mailchimp

Track the performance of your email marketing efforts with our dashboard, combining Mailchimp and GA4 data.

Mailchimp icon Google Analytics 4 icon arrow icon Looker Studio icon
Mailchimp analytics dashboard image
Mailchimp analytics dashboard

Understand how your Mailchimp campaigns perform and monitor your audience activity from different perspectives.

Mailchimp icon arrow icon Looker Studio icon
Klaviyo analytics dashboard image
Klaviyo analytics dashboard

Keep track of the performance of your email campaigns in Klaviyo and get an overview of profiles within a single dashboard.

Klaviyo icon arrow icon Looker Studio icon
Email marketing analytics dashboard for Klaviyo image
Email marketing analytics dashboard for Klaviyo

Monitor the performance of your email campaigns in Klaviyo and get an overview of your marketing funnel using the data from GA4.

Google Analytics 4 icon Klaviyo icon arrow icon Looker Studio icon
Time tracking dashboard for Harvest in Power BI image
Time tracking dashboard for Harvest in Power BI

Get an overview of your team's time and billing performance based on the Harvest data connected to the interactive dashboard.

Harvest icon arrow icon Power BI icon
Time tracking dashboard for Harvest image
Time tracking dashboard for Harvest

Derive insights into how you can optimize your teams’ time efficiency with a ready-to-go analytics dashboard connected to Harvest.

Harvest icon arrow icon Looker Studio icon
Time tracking dashboard for Clockify for Google Sheets image
Time tracking dashboard for Clockify for Google Sheets

Increase your team’s productivity by analyzing how time is spent across projects and clients using the Clockify analytics dashboard for Google Sheets.

Clockify icon arrow icon Google Sheets icon
Time tracking dashboard for Clockify image
Time tracking dashboard for Clockify

Use a powerful Clockify analytics dashboard that provides insights into how you can increase the time efficiency of your teams.

Clockify icon arrow icon Looker Studio icon
Google Business Profile dashboard image
Google Business Profile dashboard

Track your business profile performance metrics and get a detailed overview of ratings and reviews on one dashboard.

Google My Business icon arrow icon Looker Studio icon
Google Calendar dashboard image
Google Calendar dashboard

Use the Google Calendar dashboard to analyze your meeting-related information and derive time insights

Google Calendar icon arrow icon Looker Studio icon
Calendly event dashboard image
Calendly event dashboard

Analyze events booked in Calendly to identify the most popular time slots and optimize your scheduling process. Align your calendar with demand to increase the performance of your team and processes.

Calendly icon arrow icon Looker Studio icon
LinkedIn Ads dashboard image
LinkedIn Ads dashboard

Get a data-based perspective to make decisions for optimizing your LinkedIn Ads advertising campaigns and improving their performance.

LinkedIn Ads icon arrow icon Looker Studio icon
YouTube traffic performance dashboard in Looker Studio image
YouTube traffic performance dashboard in Looker Studio

Get an overview of your YouTube channel's traffic performance based on the data loaded from Google Analytics 4.

Google Analytics 4 icon arrow icon Looker Studio icon
YouTube traffic performance dashboard in Google Sheets image
YouTube traffic performance dashboard in Google Sheets

Analyze the traffic performance of your YouTube channel using the dashboard powered by data from Google Analytics 4.

Google Analytics 4 icon arrow icon Google Sheets icon
YouTube KPIs Dashboard image
YouTube KPIs Dashboard

All the key information about your YouTube channel in one concise dashboard. Track performance, monitor subscriber base growth, and analyze the sources that bring you views.

YouTube icon arrow icon Looker Studio icon
YouTube dashboard image
YouTube dashboard

Get insights into how viewers discover and interact with your videos, track content performance, key metrics, and define your YouTube strategy.

YouTube icon arrow icon Looker Studio icon
Web Analytics dashboard in Tableau image
Web Analytics dashboard in Tableau

Monitor the performance of your traffic, analyze the conversion funnel, and derive other insights from Google Analytics 4.

Google Analytics 4 icon arrow icon Tableau icon
PPC multi-channel dashboard for Tableau image
PPC multi-channel dashboard for Tableau

Track and analyze the performance of your advertising campaigns across various platforms using a one-stop PPC dashboard in Tableau

LinkedIn Ads icon Google Ads icon TikTok Ads icon Quora Ads icon X (Twitter) Ads icon Bing Ads icon Facebook Ads icon arrow icon Tableau icon
info icon
No such template is available yet.
No worries. Our team will create a template that fits your needs, just tell us more
about your case. It doesn't cost you a penny 😉
Request a custom report
Frequently asked questions
The Google Search Console dashboard is an analytics interface that gives website owners and SEO professionals an overview of their site's performance in Google's results. The dashboard provides a user-friendly summary of Google Search Console data visualized using charts and graphs in the form of a Looker Studio report template (former Google Data Studio). You have access to the number of pages indexed, impressions, clicks, CTR, average position in search results pages, and many other metrics.
The Google Search Console dashboard template comes with an in-built connector that automates data flow from GSC. To start using the dashboard, you only need to make several clicks according to the in-app instructions. It will take up to 2 minutes to connect to your Google Search Console account and populate raw data from it to your dashboard.
Open the Readme page of the dashboard and click the highlighted link. You’ll need to create a Coupler.io account - you can do this for free by signing up with your Google account. Once signed up, you’ll be directed right to the importer which is an integration of Google Search Console and Looker Studio.
Connect your GSC account and proceed to the step where you can preview the Google Search Console data to be populated in the dashboard. No actions are needed here, just click Proceed.
Follow the instructions to authorize the connector and create a data source in Looker Studio. Connect your newly created data source and click the Create report button.
In a moment, you will be redirected to the copy of the Google Search Console dashboard that already has your data. The dashboard will be updated automatically every day by default. If you want to have a more frequent data refresh, go back to Coupler.io and tweak the schedule to your liking. Every 15-minute refresh will make your dashboard near real-time!
With Coupler.io, you can create custom reports and Data Studio templates by connecting to Google Analytics 4, Facebook Ads, Google Ads, and many other sources.
The Search Console dashboard simplifies the monitoring of the web pages' search engine visibility and their SEO health. You can access different insights into your organic performance, like click dynamics, best and worst-performing URLs, the number of indexed pages, etc. This information will let you identify the trends and optimization opportunities. As a result, you get the power to customize your SEO strategies to reach your desired audience efficiently. The dashboard provides.
The key value of the Google Search Console dashboard is that it turns the raw data from GSC into actionable insights. You don’t need to make any setups or calculations for efficient decision-making. Everything is preset and all you have to do is to connect the dashboard template to your GSC account.
The Google Search Console dashboard gives in-depth data about the search performance of your website. Check out a few reasons explaining why marketers, SEO specialists, and website owners need to have a Search Console template:
1. Comprehensive SEO Monitoring and Strategy Development
The Google Search Console dashboard gives you a 360-degree perspective on how your website performs in SEO. Through tracking indexed pages, you can guarantee Google properly crawls and indexes your content correctly, the fundamental stage of SEO success. Impressions, clicks, and average position metrics allow you to evaluate whether your site is visible enough to attract organic search traffic.
2. Content Optimization and Performance Analysis
Content rules in digital marketing. However, not all content has the same impact. The Search Console dashboard sheds some light and measures the content pieces, bringing traffic and user engagement, using clicks and impressions by URL metrics. These insights can help you fine-tune your content strategy. They will display the topics and formats that appeal to your audience, so you can optimize the existing content to make it more search engine-friendly.
3. Enhancing UX Across Devices
We use more and more different devices to browse the internet. So, ensuring your website performs well on various devices is essential. The Search Console report templates offer in-depth page-level reports of clicks, impressions, and CTR per device, providing information on users' behavior and preferences. The information is critical for optimizing your site design, layout, and content for usage on mobile, tablets, and computers; in this way, you will ensure a seamless and engaging experience for all users.
4. Tracking SEO Progress and Setting Benchmarks
SEO is not a one-time job but rather a continual process of improvement. The Google Search Console report allows you to track progress, measure the results of your SEO activities, and set future targets. By analyzing clicks, growth percentages, and average position trends, you can evaluate the efficiency of your optimization efforts and fine-tune your strategy to get the desired results.
5. Competitive Analysis and Market Understanding
One of the core marketing components is knowing your position relative to your competitors, which is essential to defining your SEO and content strategies. GSC dashboard will give you deeper insights into how your website performs in search results compared to competitors, pointing out areas that have the potential to grow your market share. Analysis of clicks and average position will help you to see where your competitors are doing better and then formulate targeted solutions to compete in the indicated areas more competently.
Finally, a Google Search Console dashboard is a nice-to-have not-to-have for anyone who intends to go digital. It provides a vast pool of data and analysis that can influence your digital marketing strategy, from SEO and content marketing to technical optimization and user experience.

High five for scrolling till the very end!
Enjoy your dashboard!