Financial dashboard examples and reporting templates
Gain insights for businesses and organizations with our ready-to-use financial dashboards. Quickly connect your accounting and financial software to get a tool for tracking your financial health. Monitor business revenue, manage operational expenses, optimize cash flow, and analyze your financial performance.
Financial dashboard examples for every need


about your case. It doesn't cost you a penny 😉
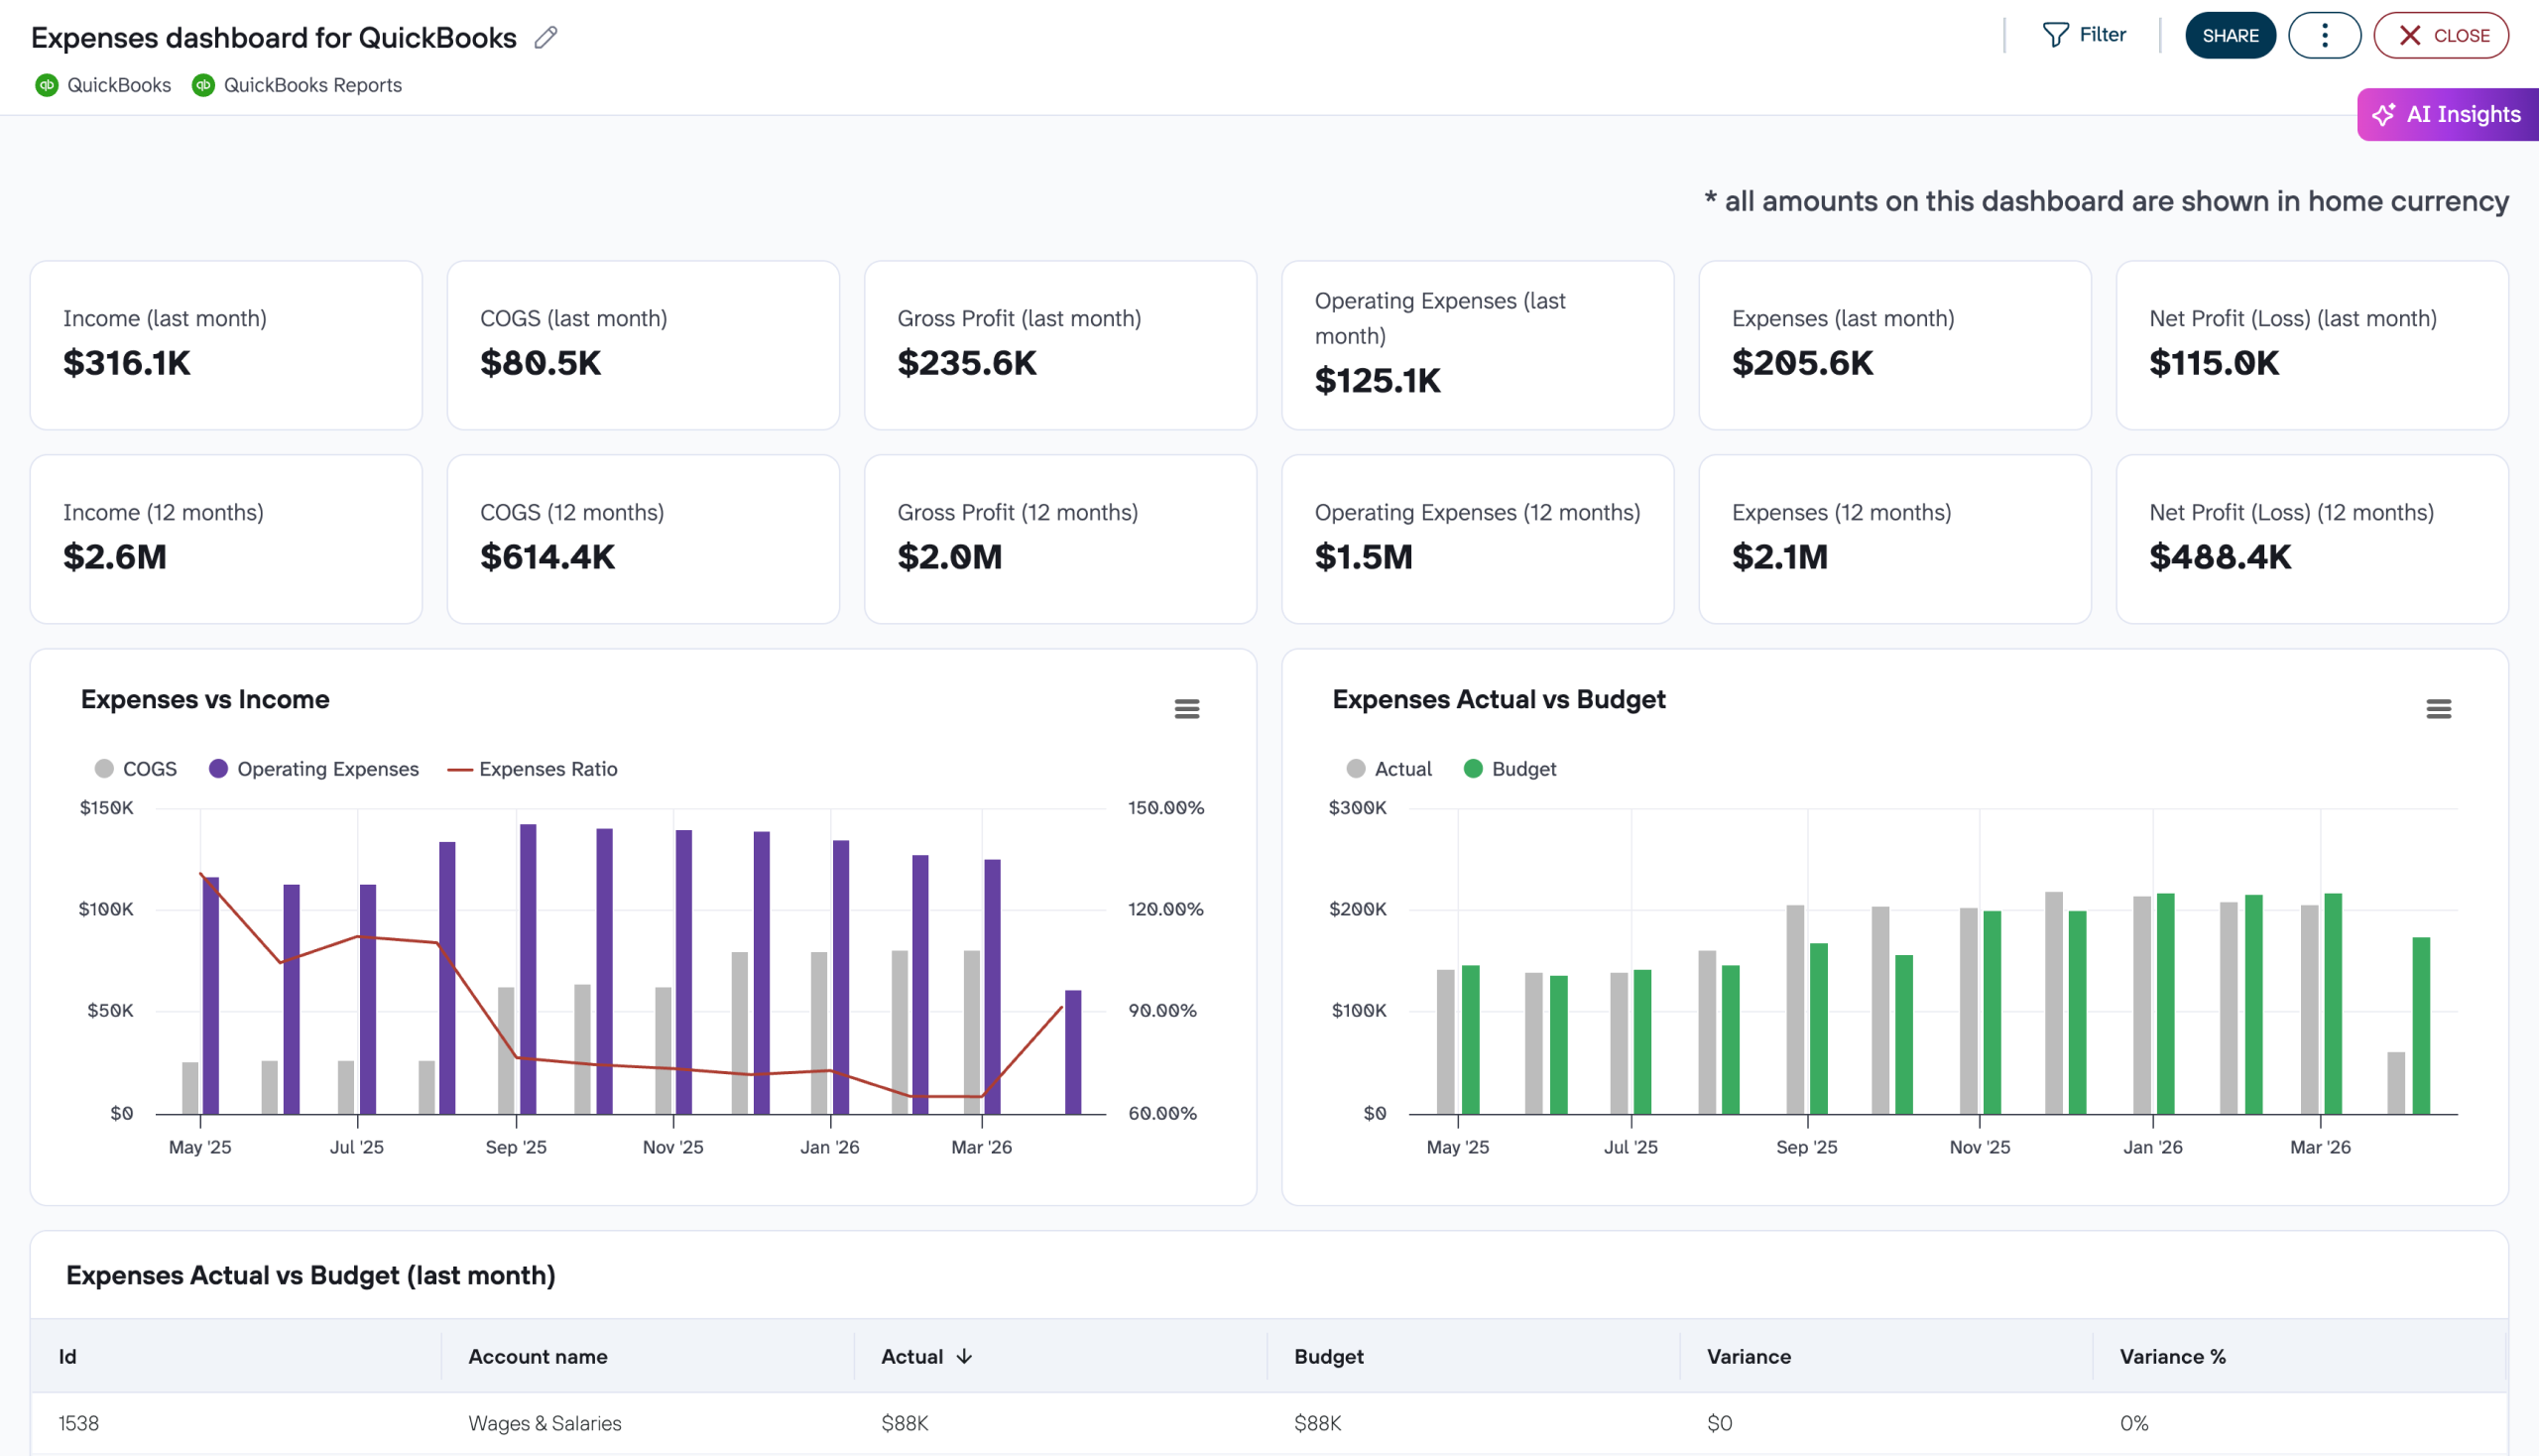
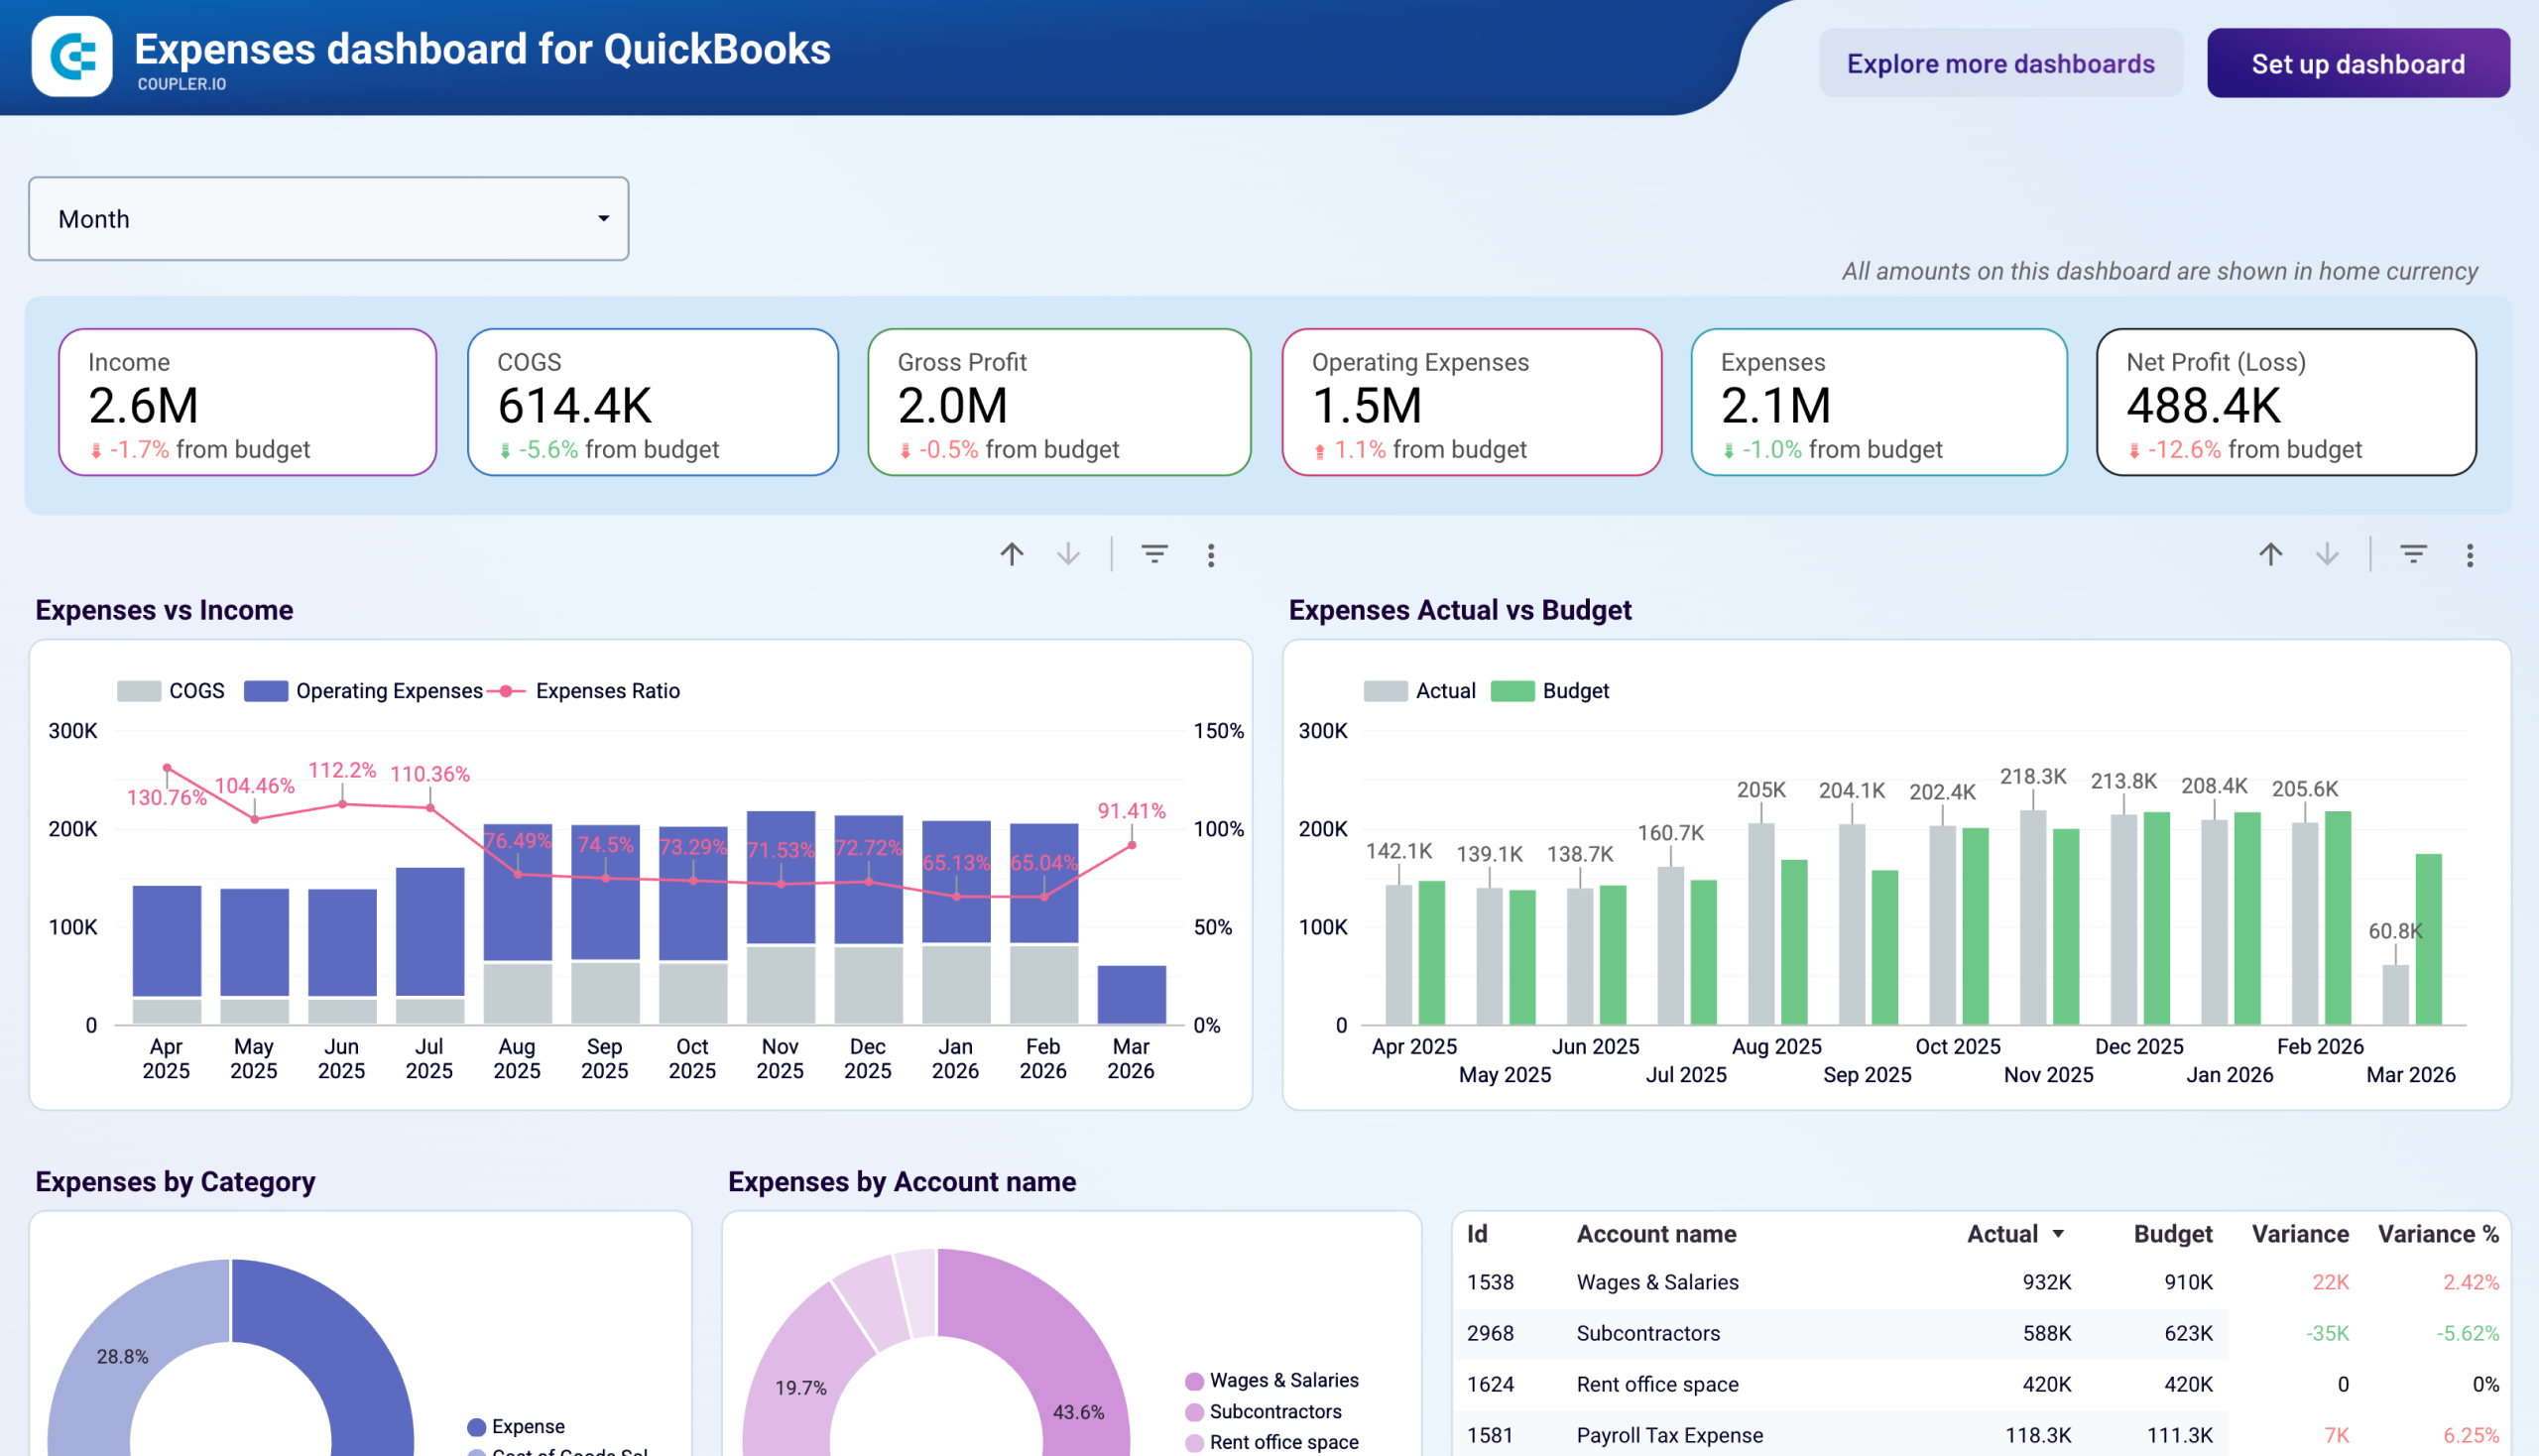
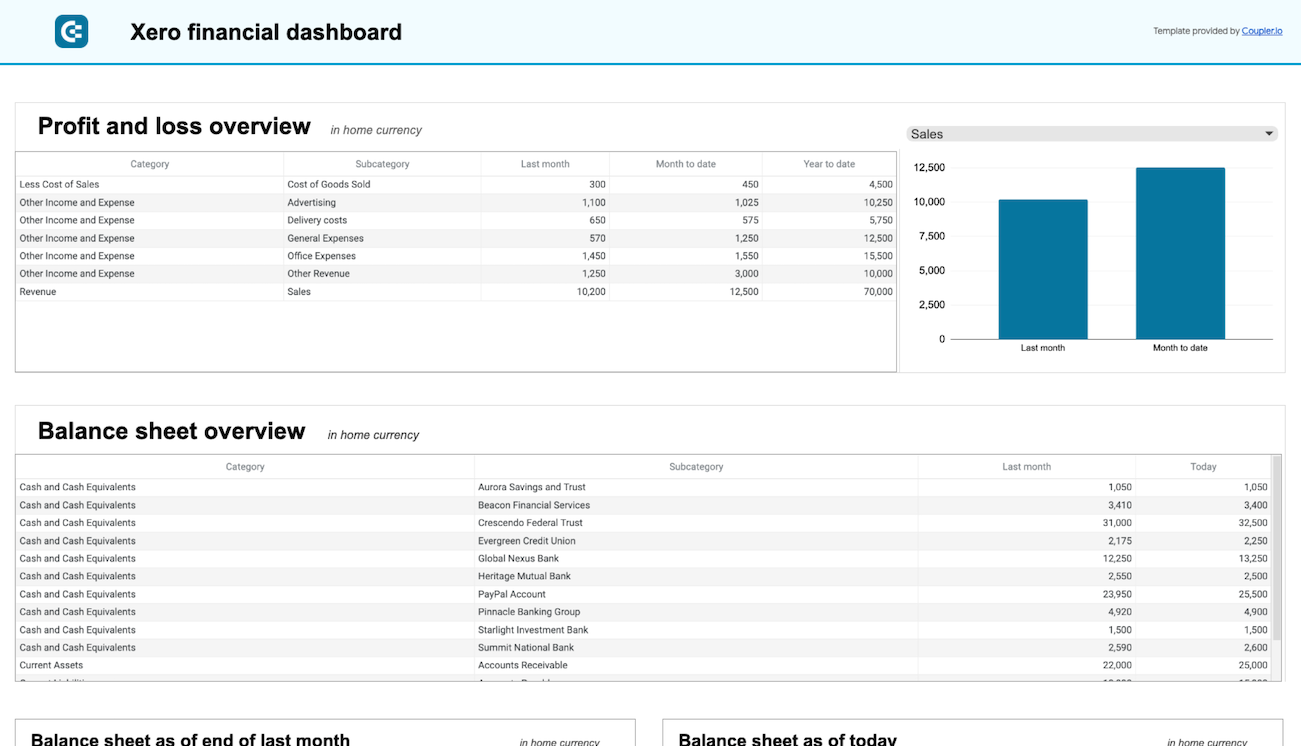
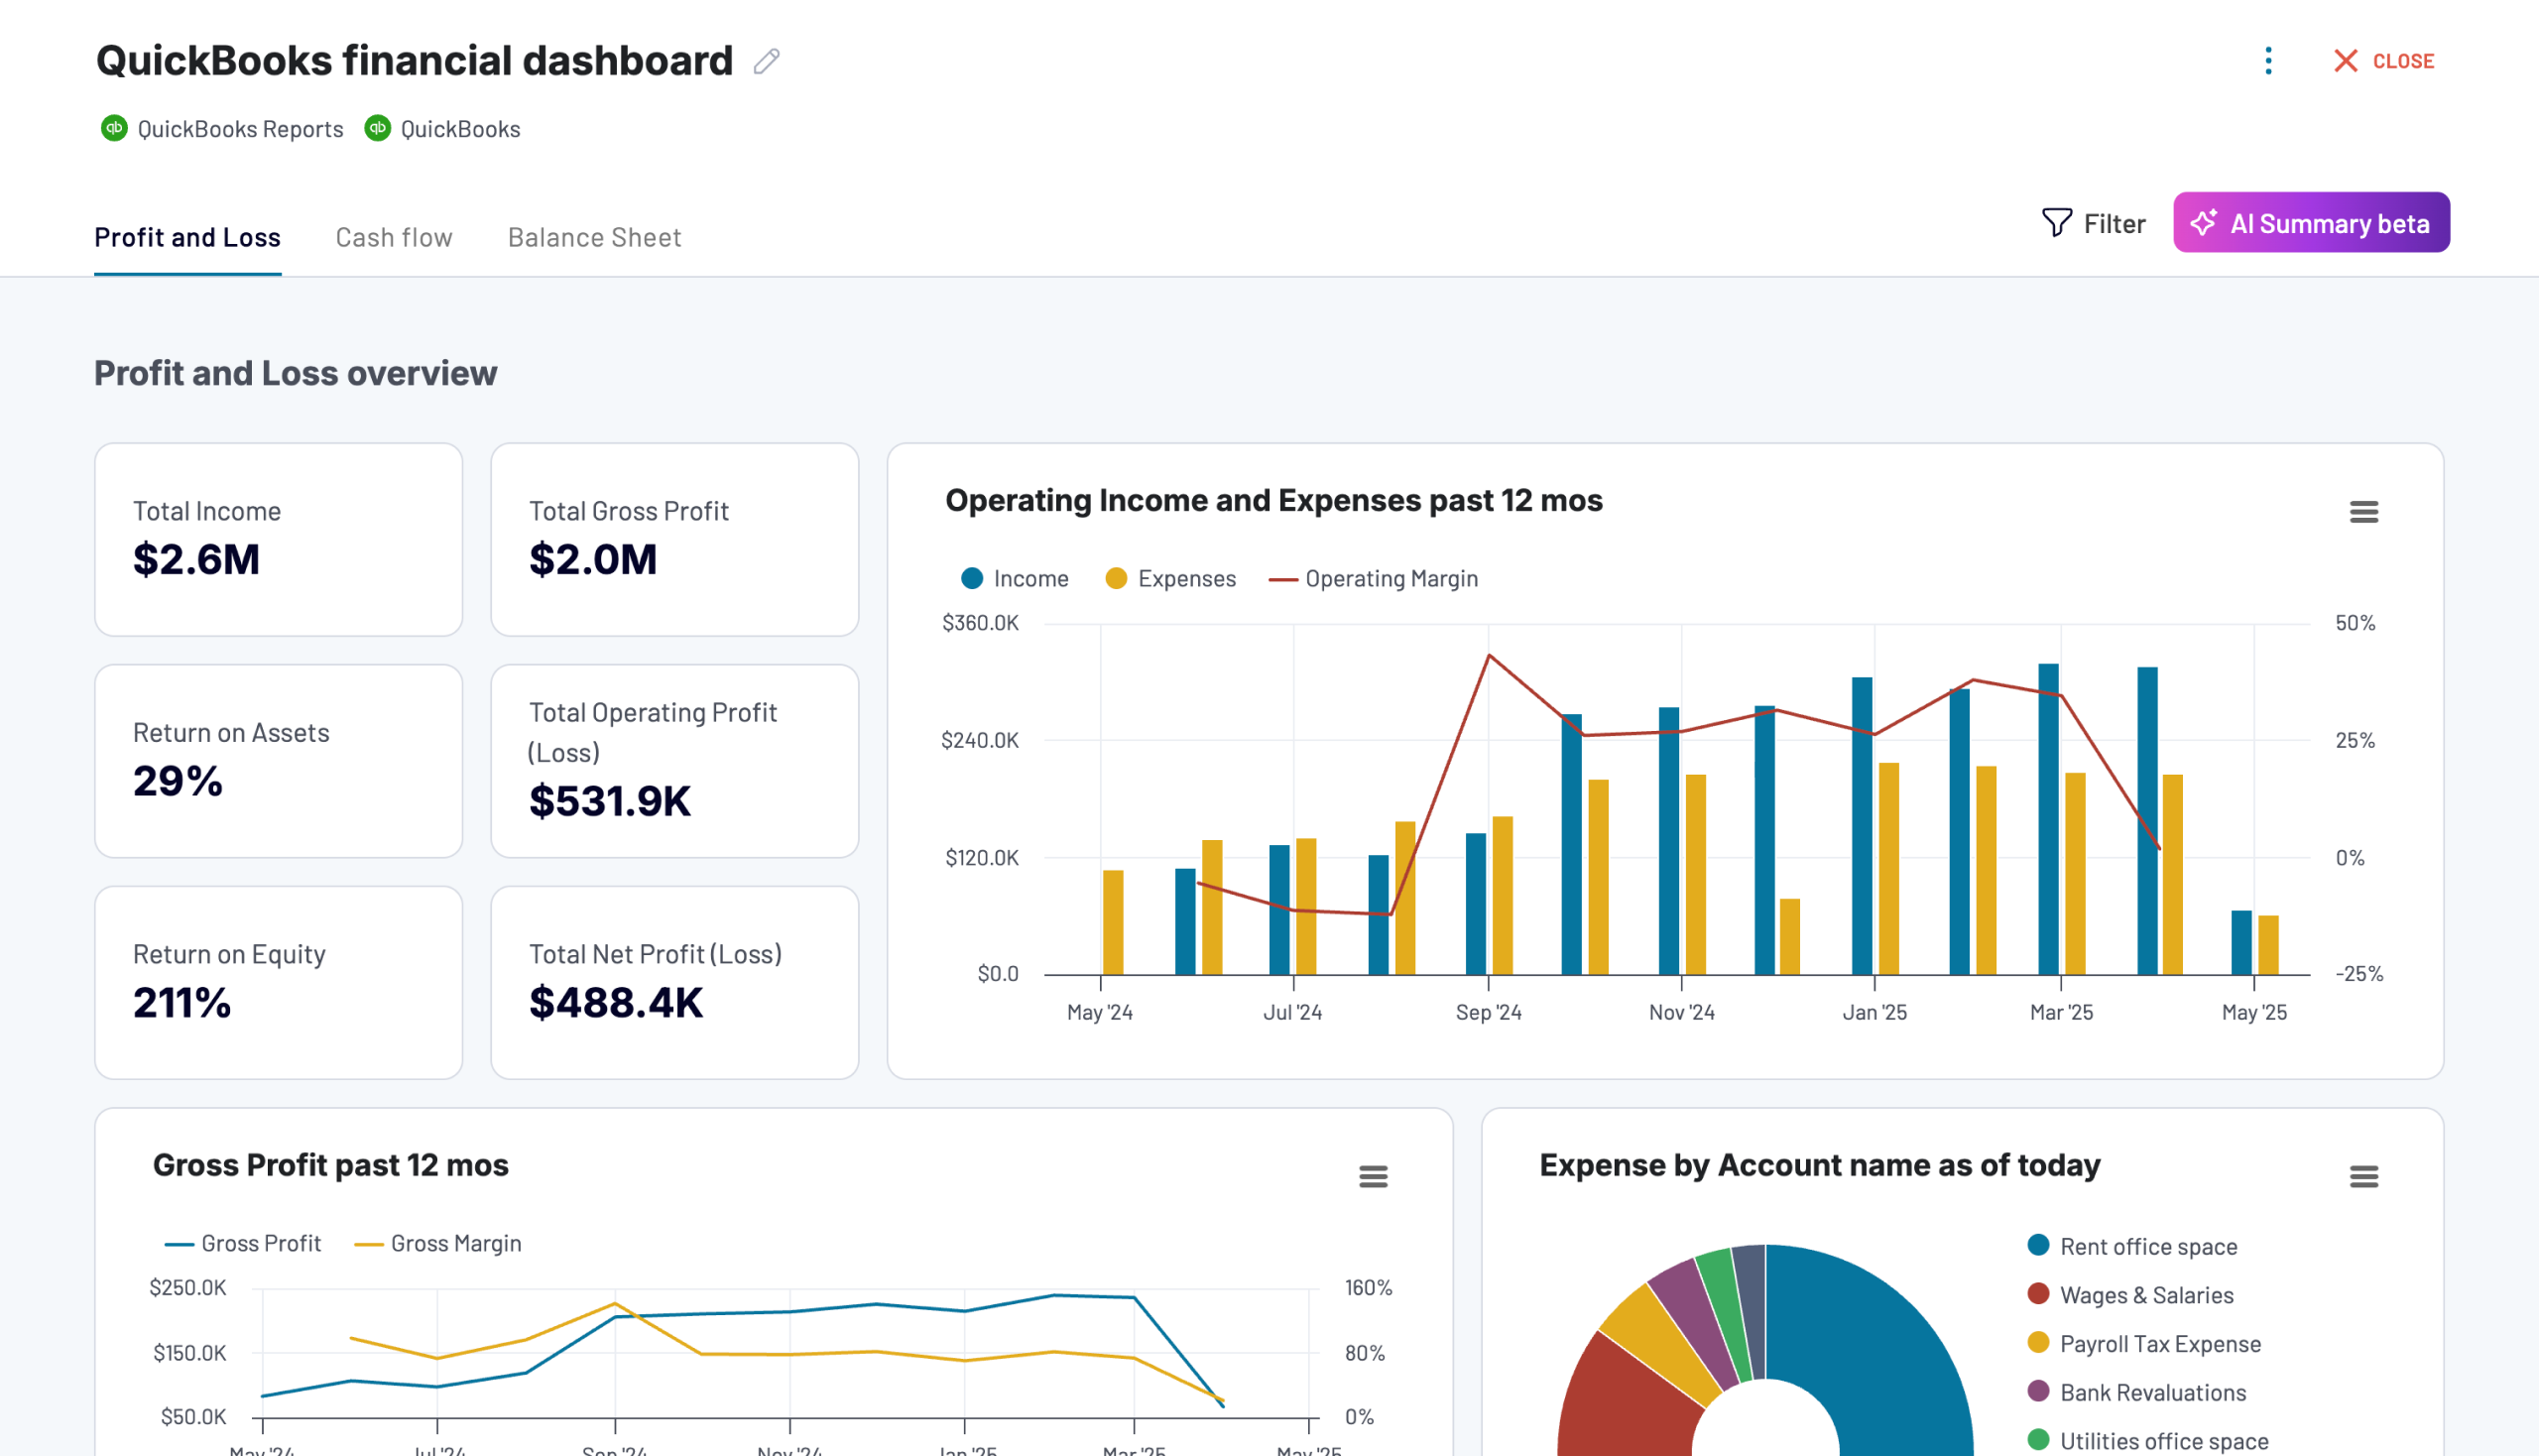
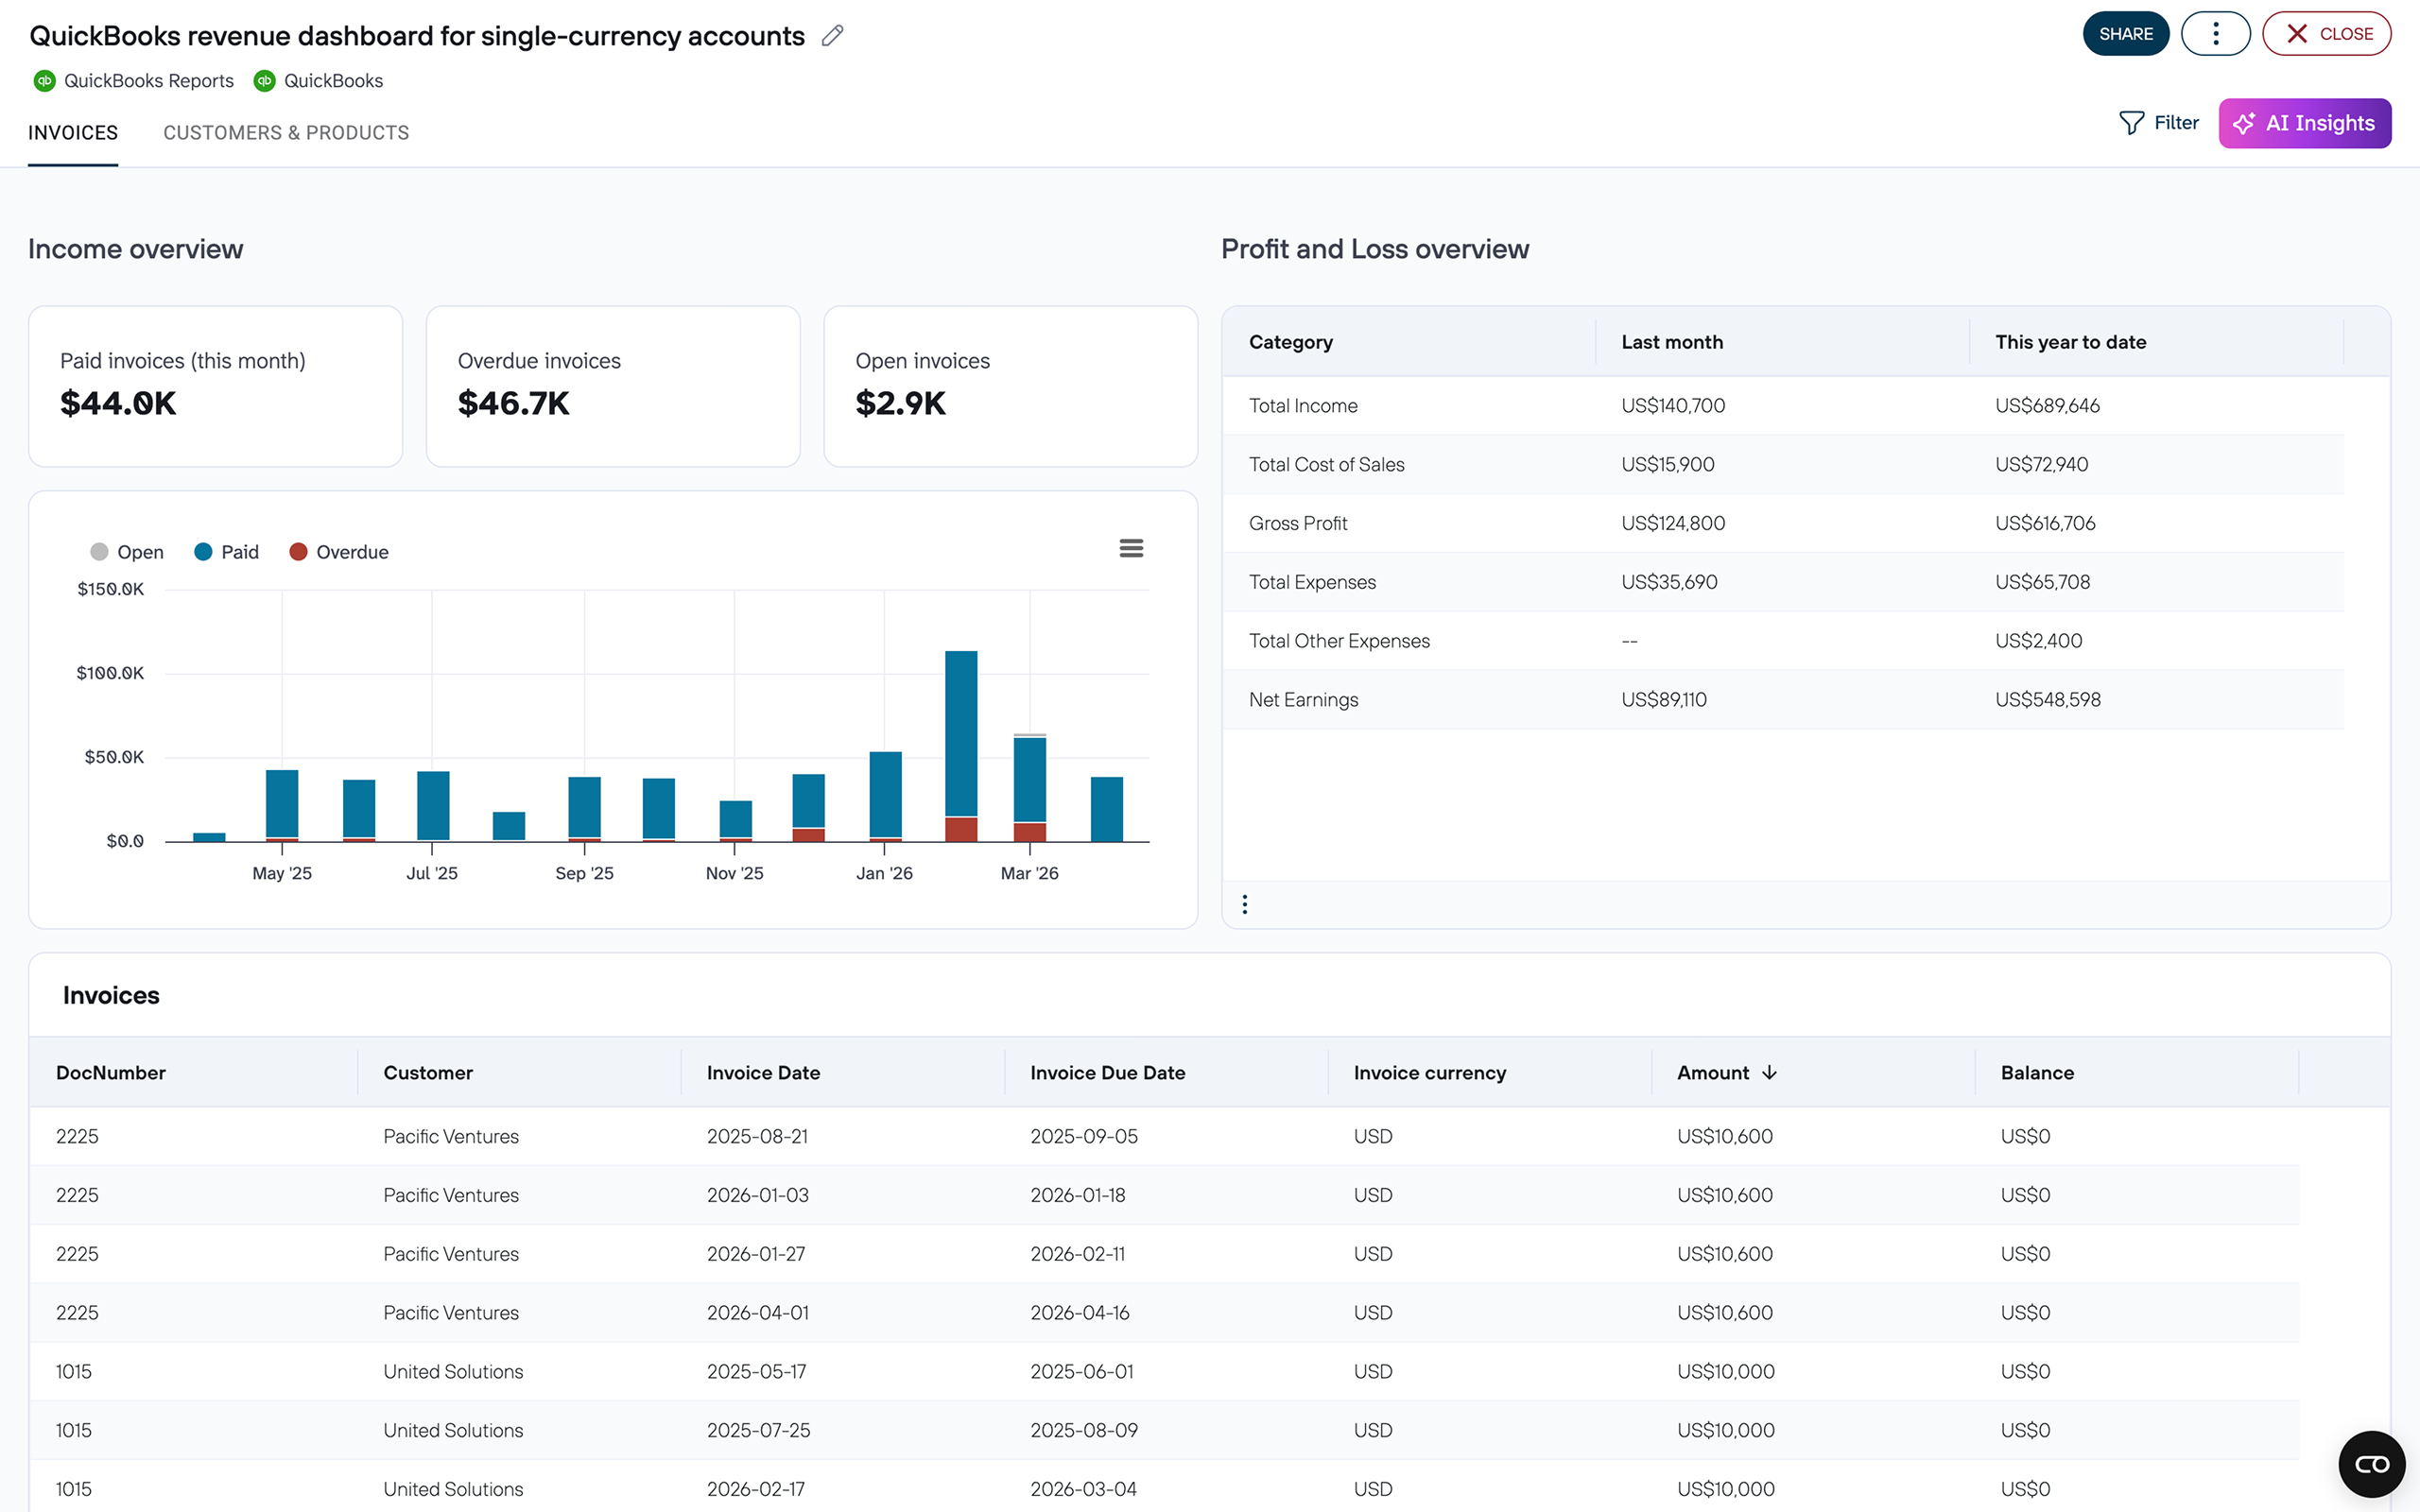
Profit and Loss dashboards
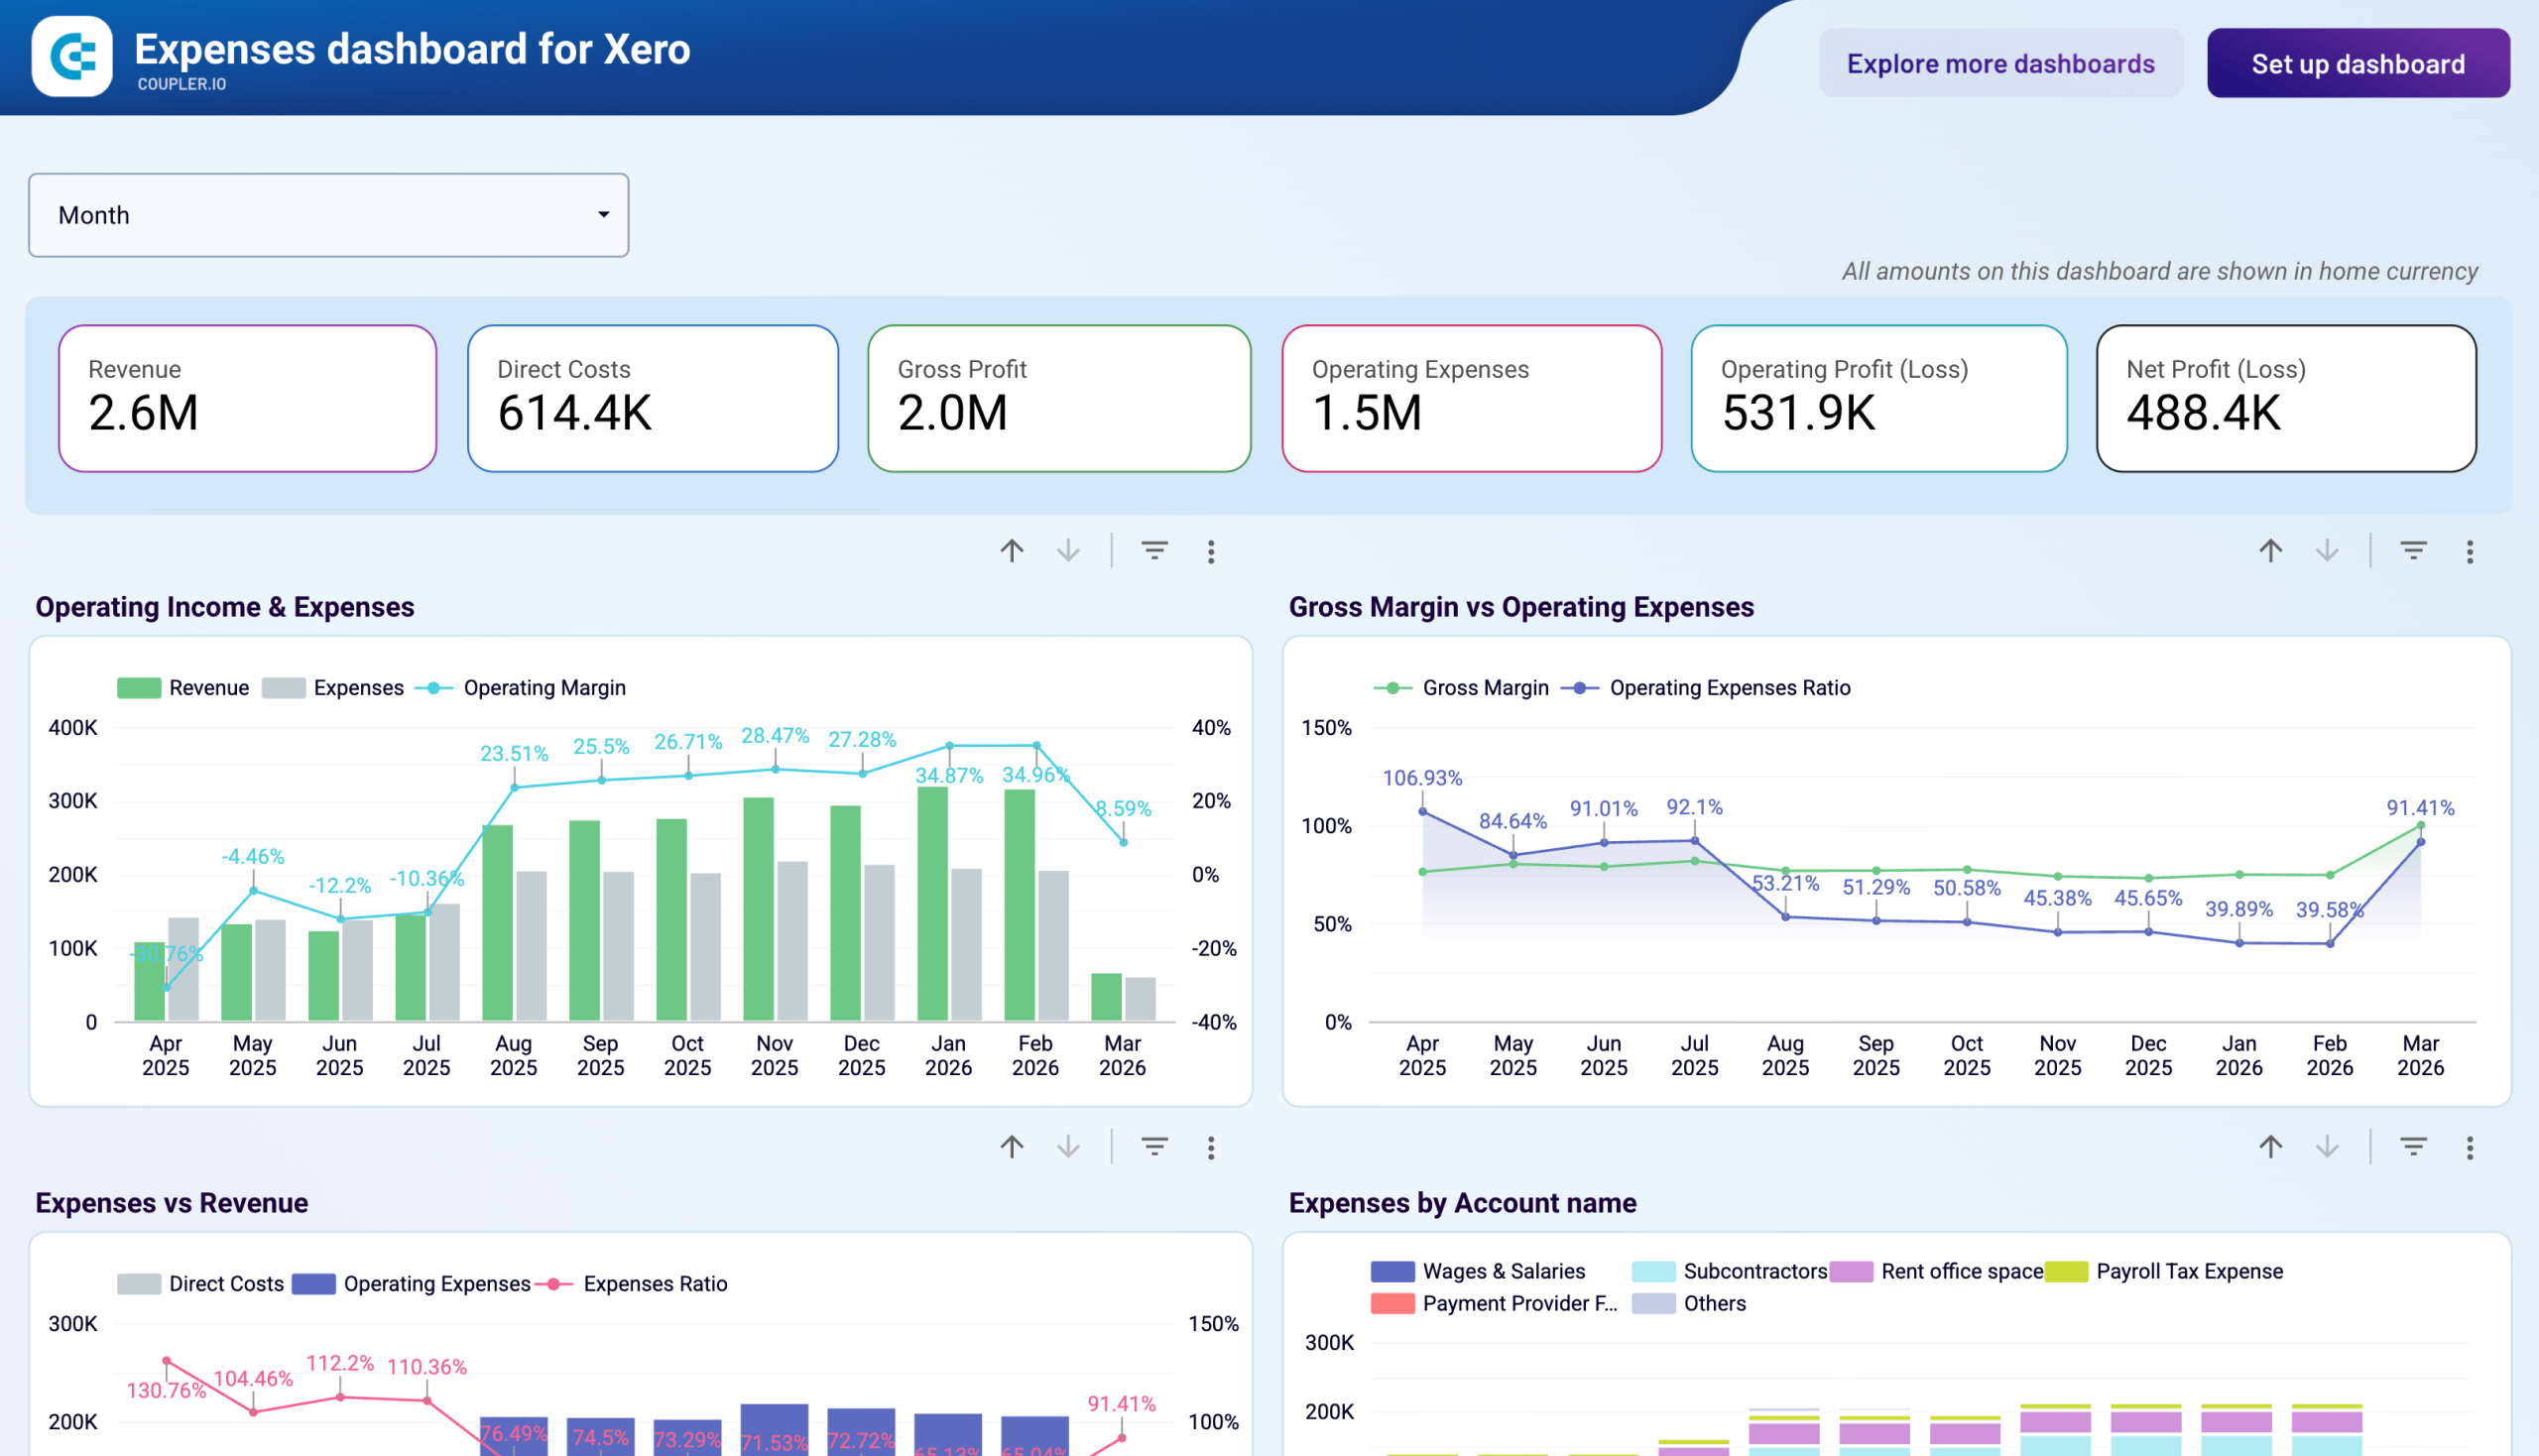
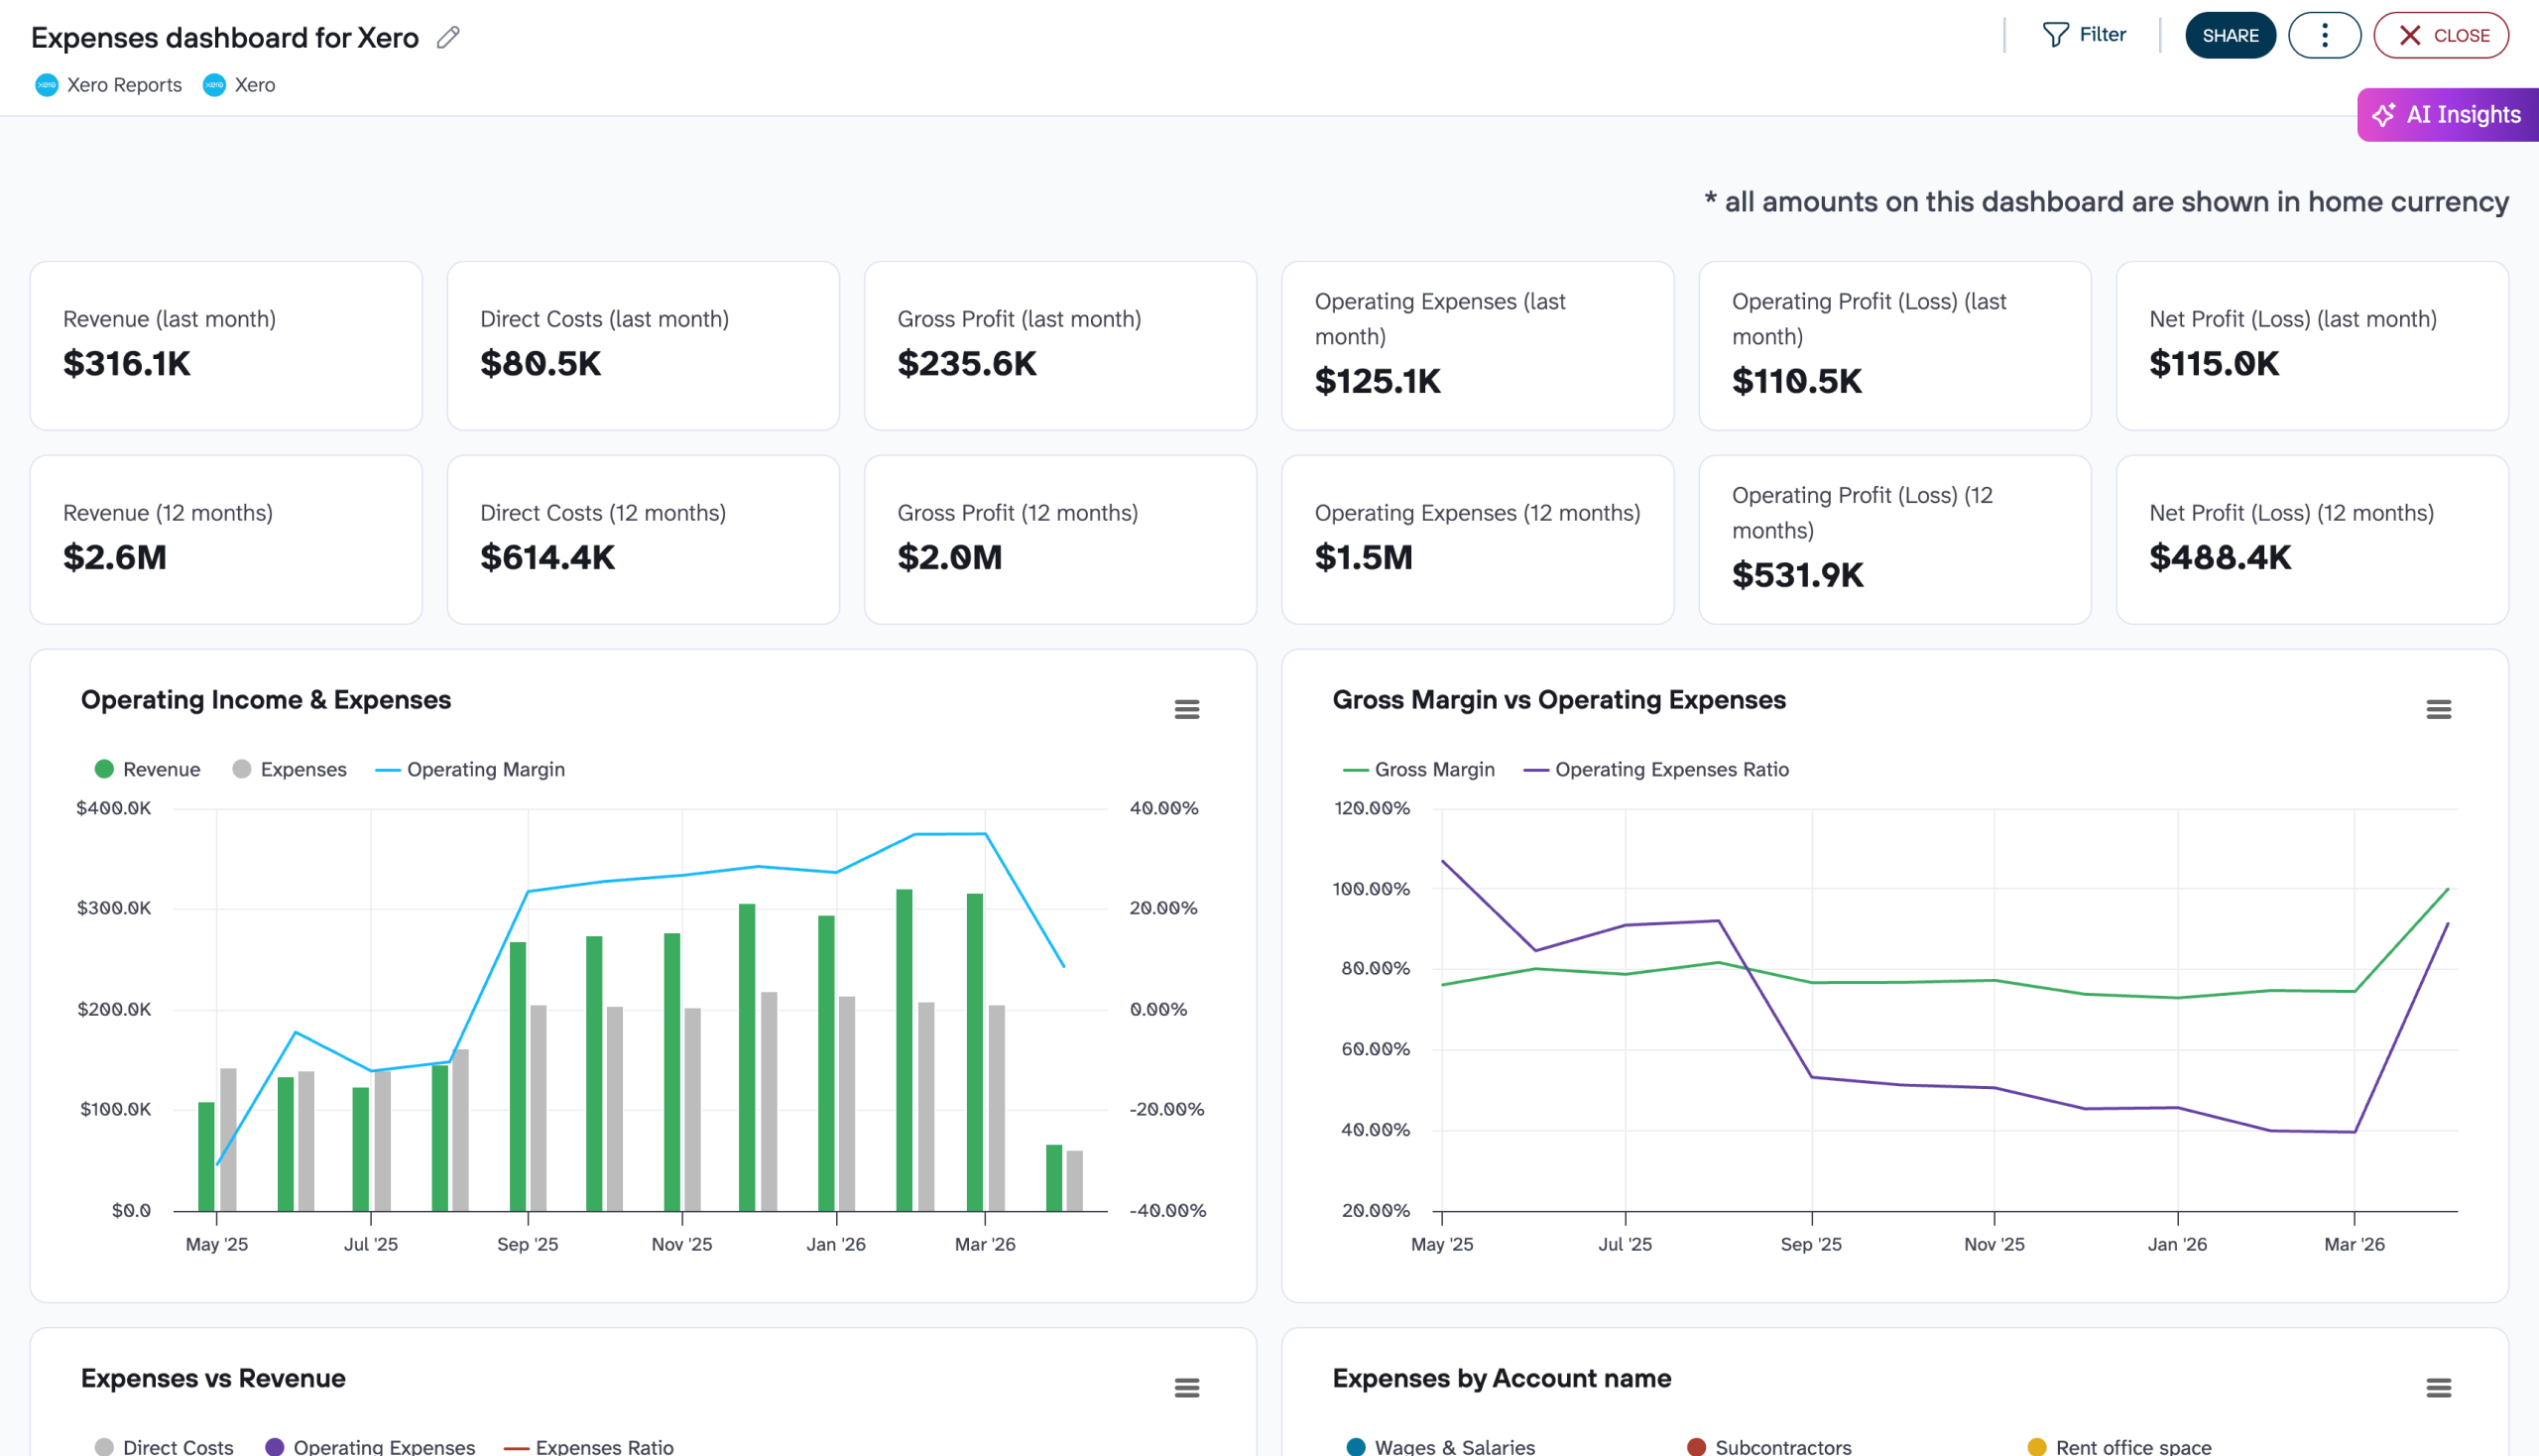
Understand your net profitability with every financial dashboard we offer. They allow you to analyze your income and expenses in detail. View your financial performance in an easy-to-read format and evaluate the effectiveness of your business strategies. Make data-driven financial decisions and enhance your profit margins.
Cash Flow dashboards
Use our templates to forecast liquidity, identify cash shortages, and ensure smooth business operations. The financial dashboards provide an overview of cash inflows and outflows and help you maintain optimal cash flow management. They serve as essential tools to ensure financial stability and planning for the future.
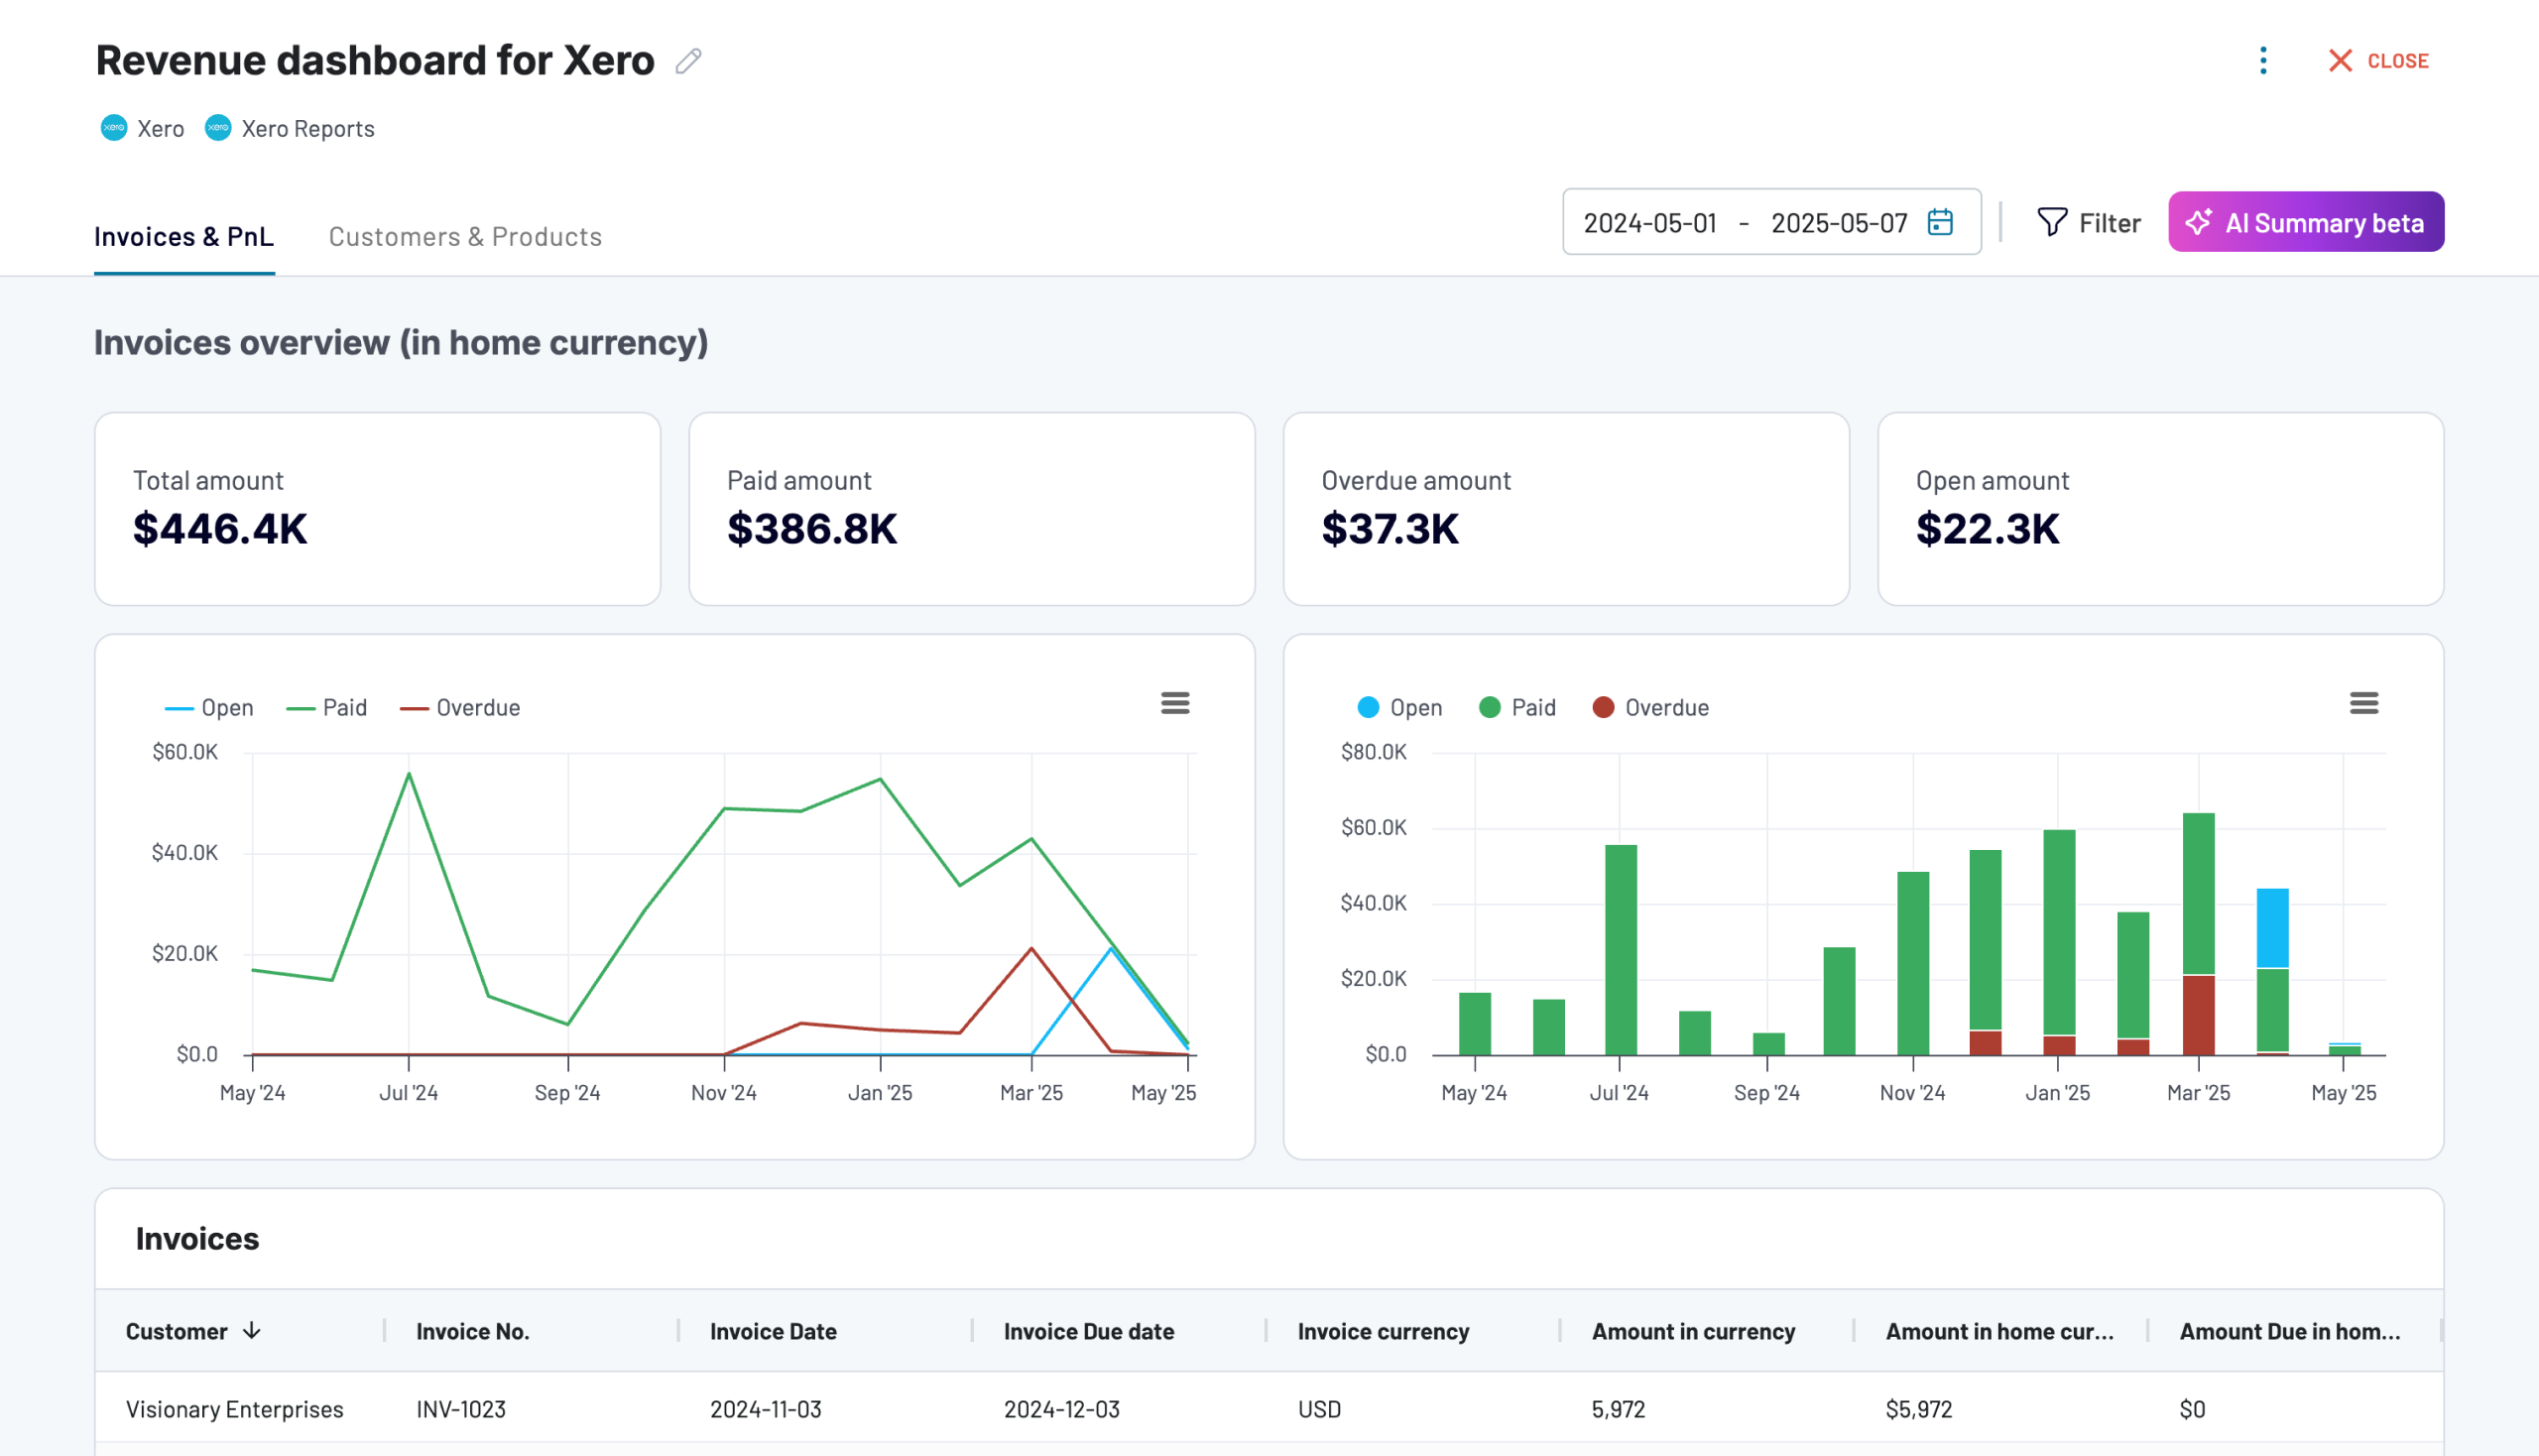
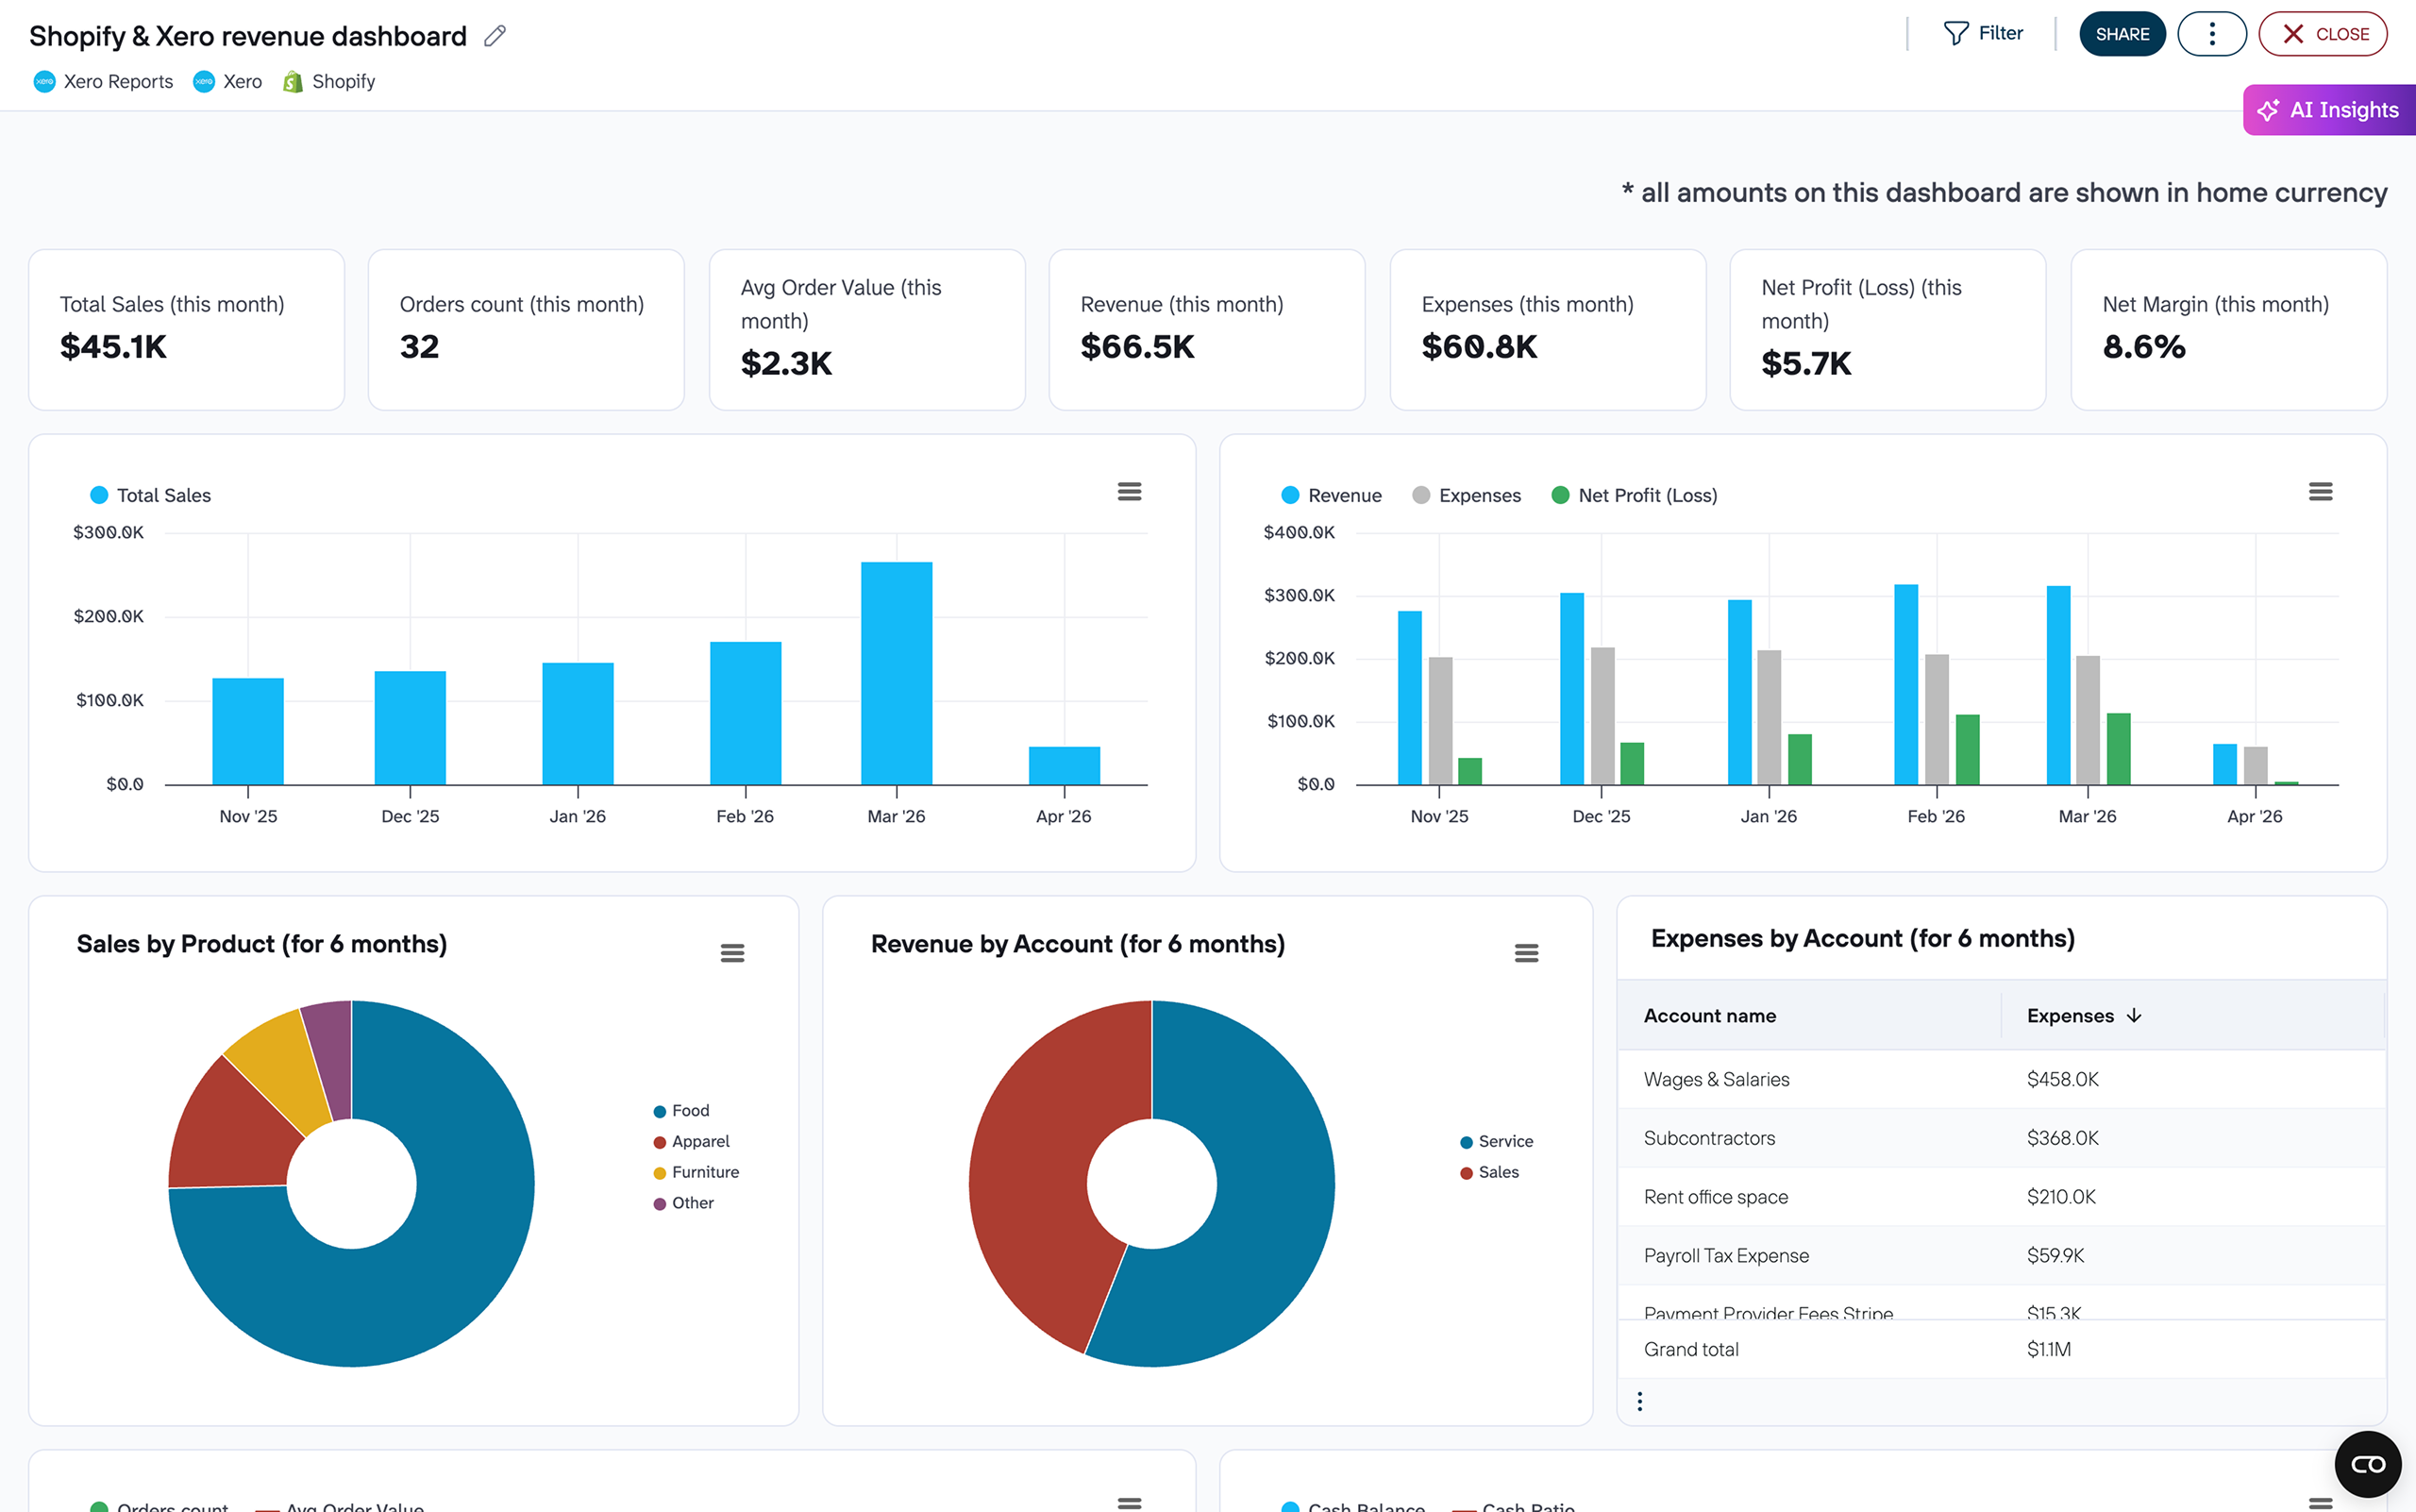
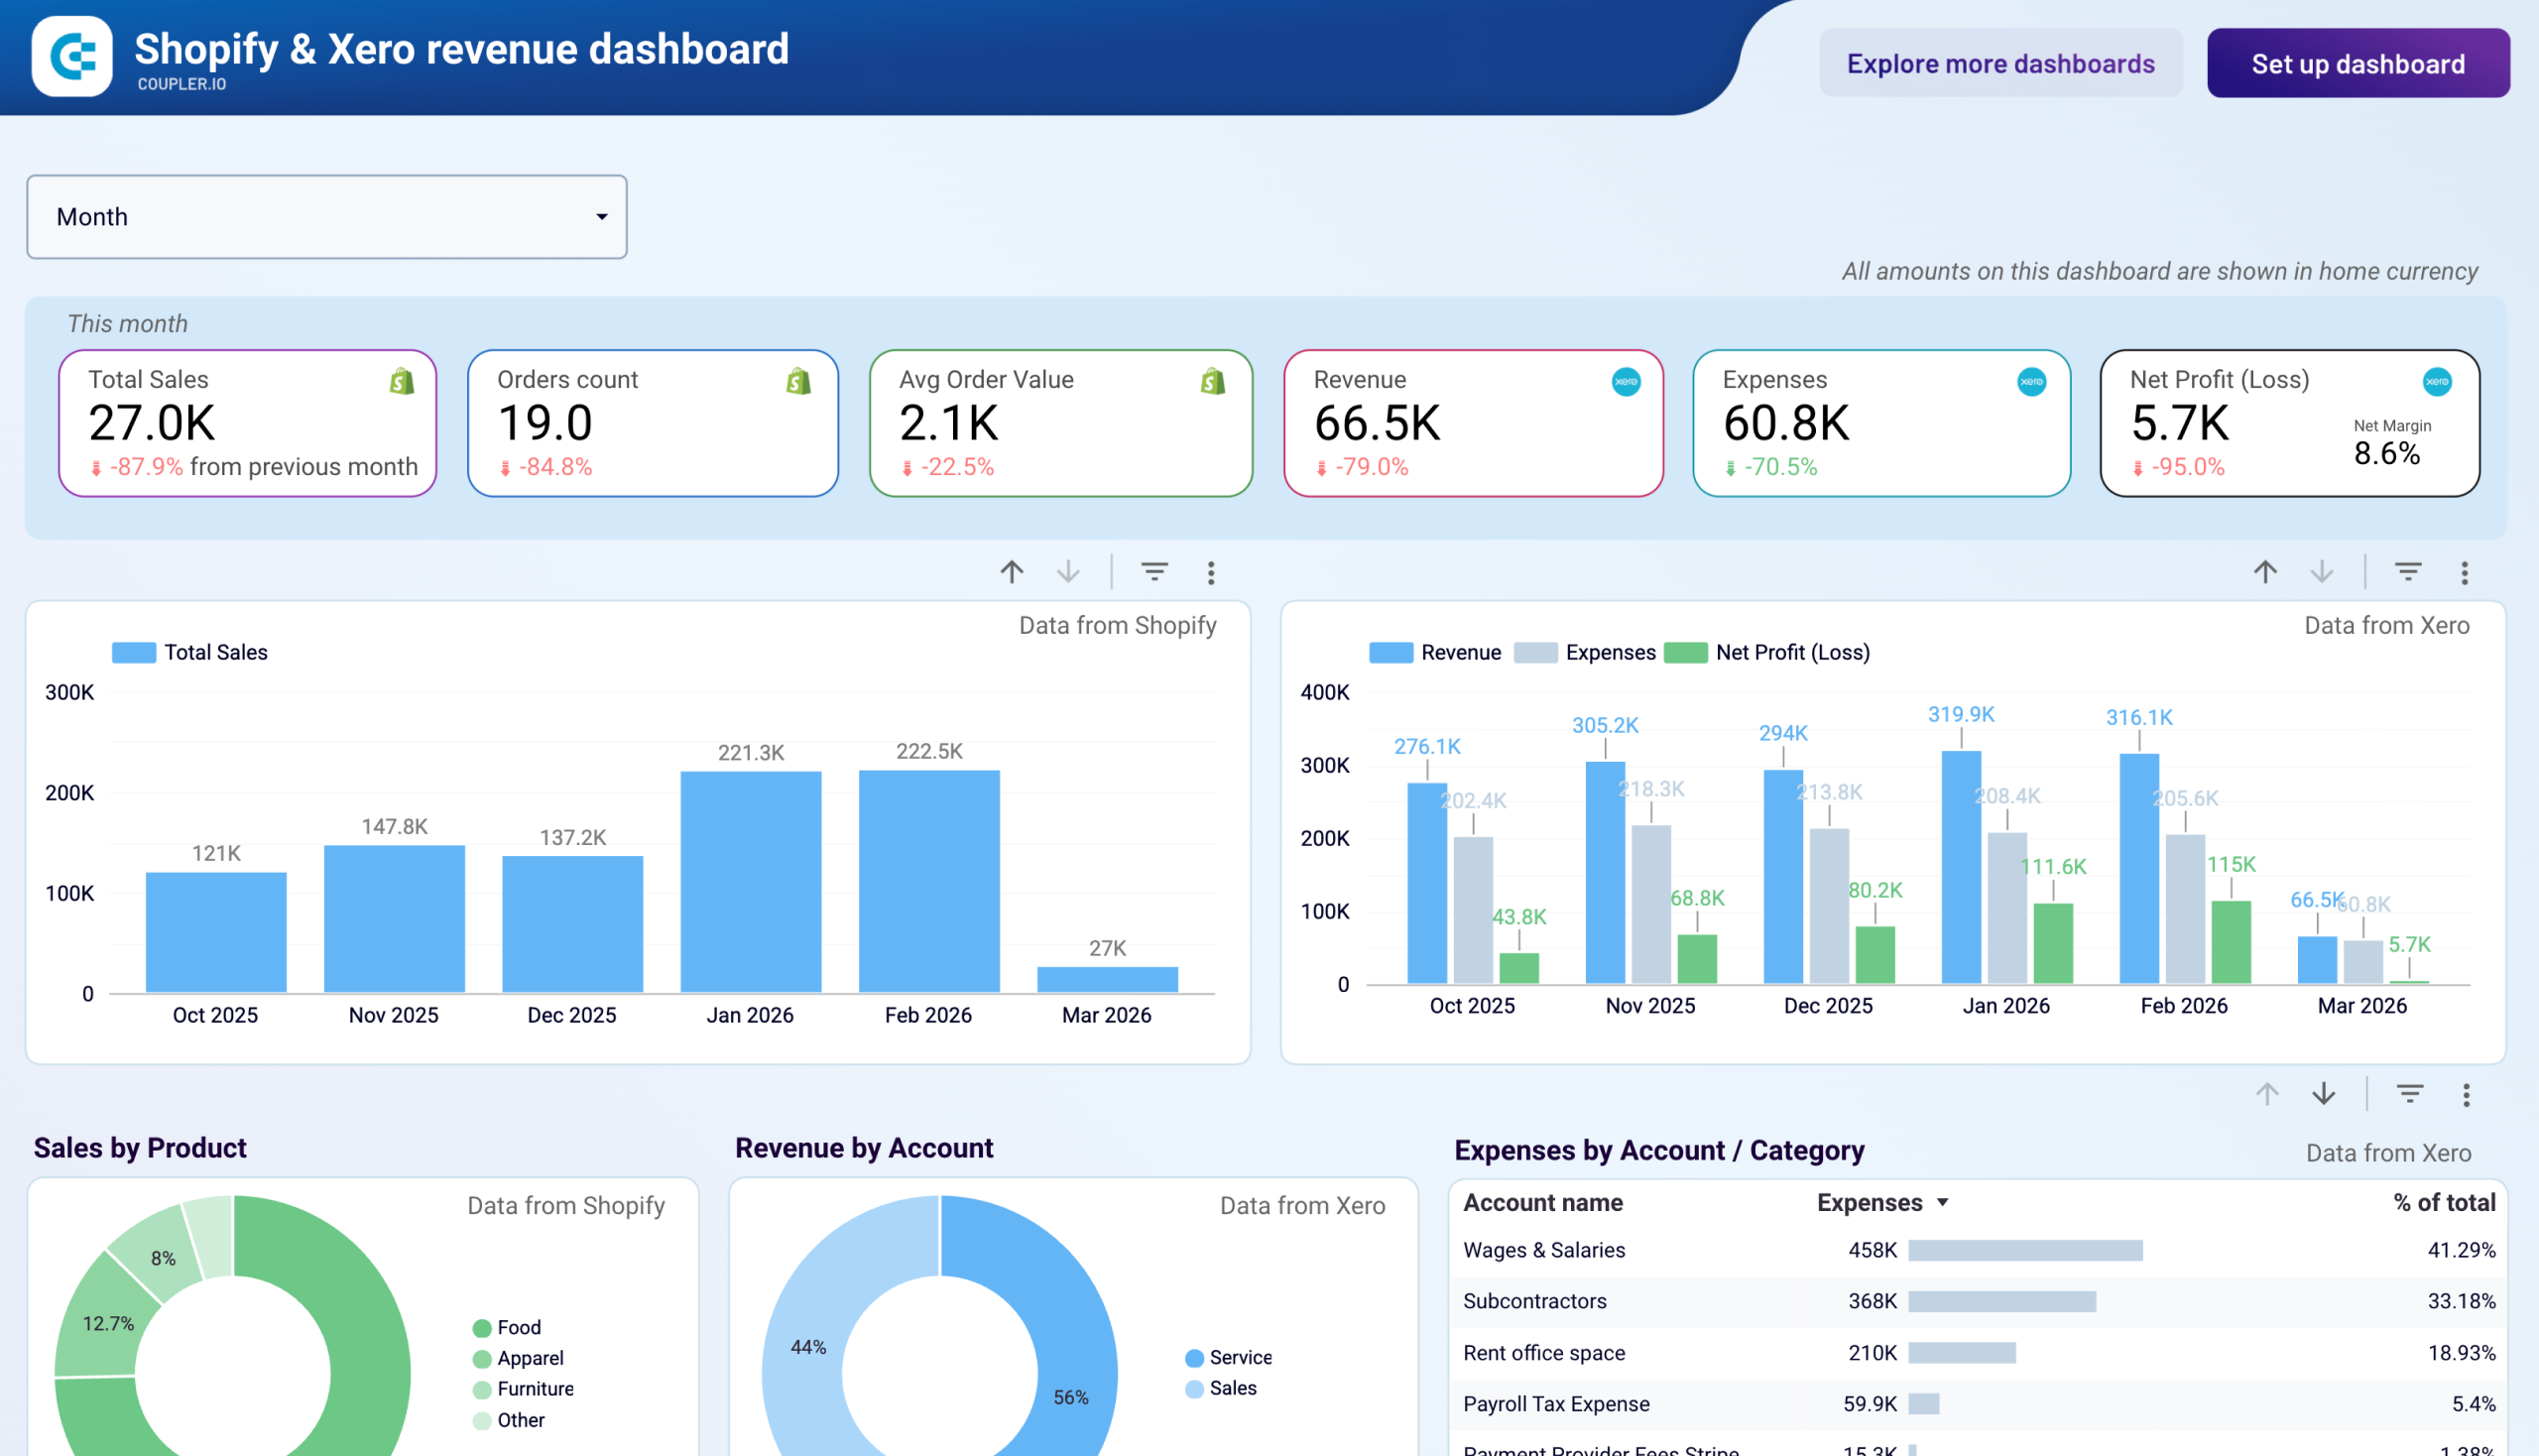
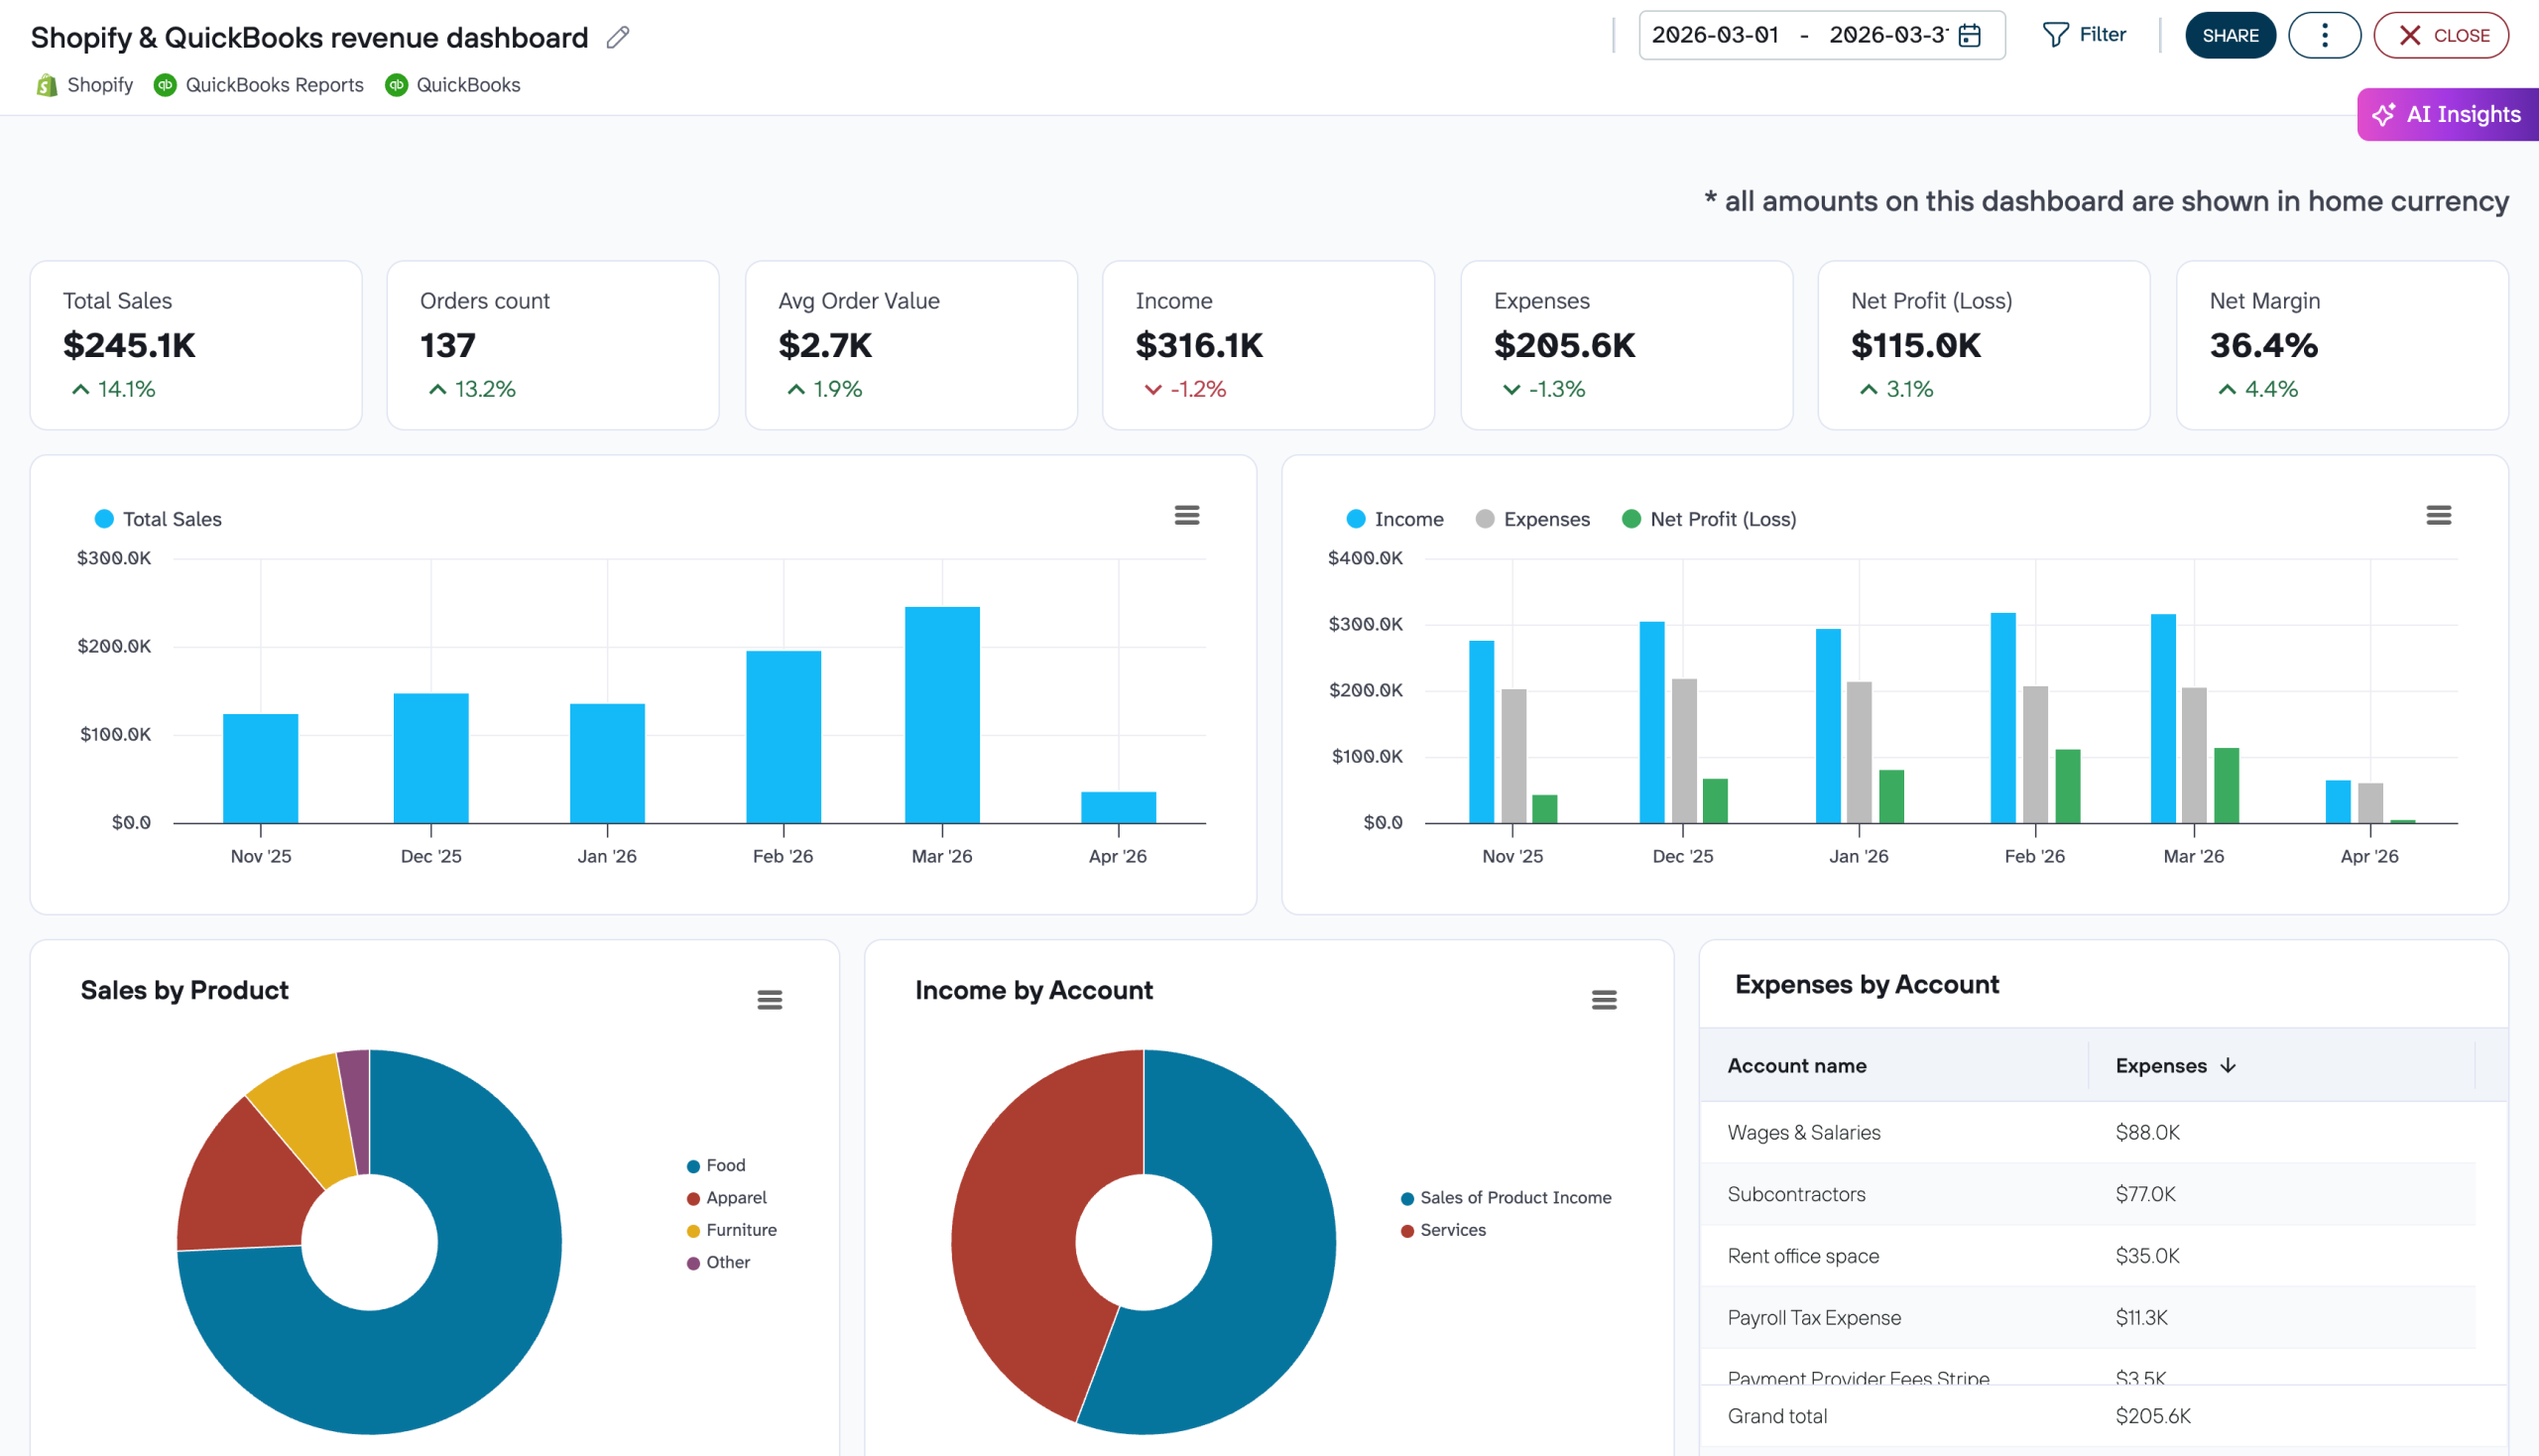
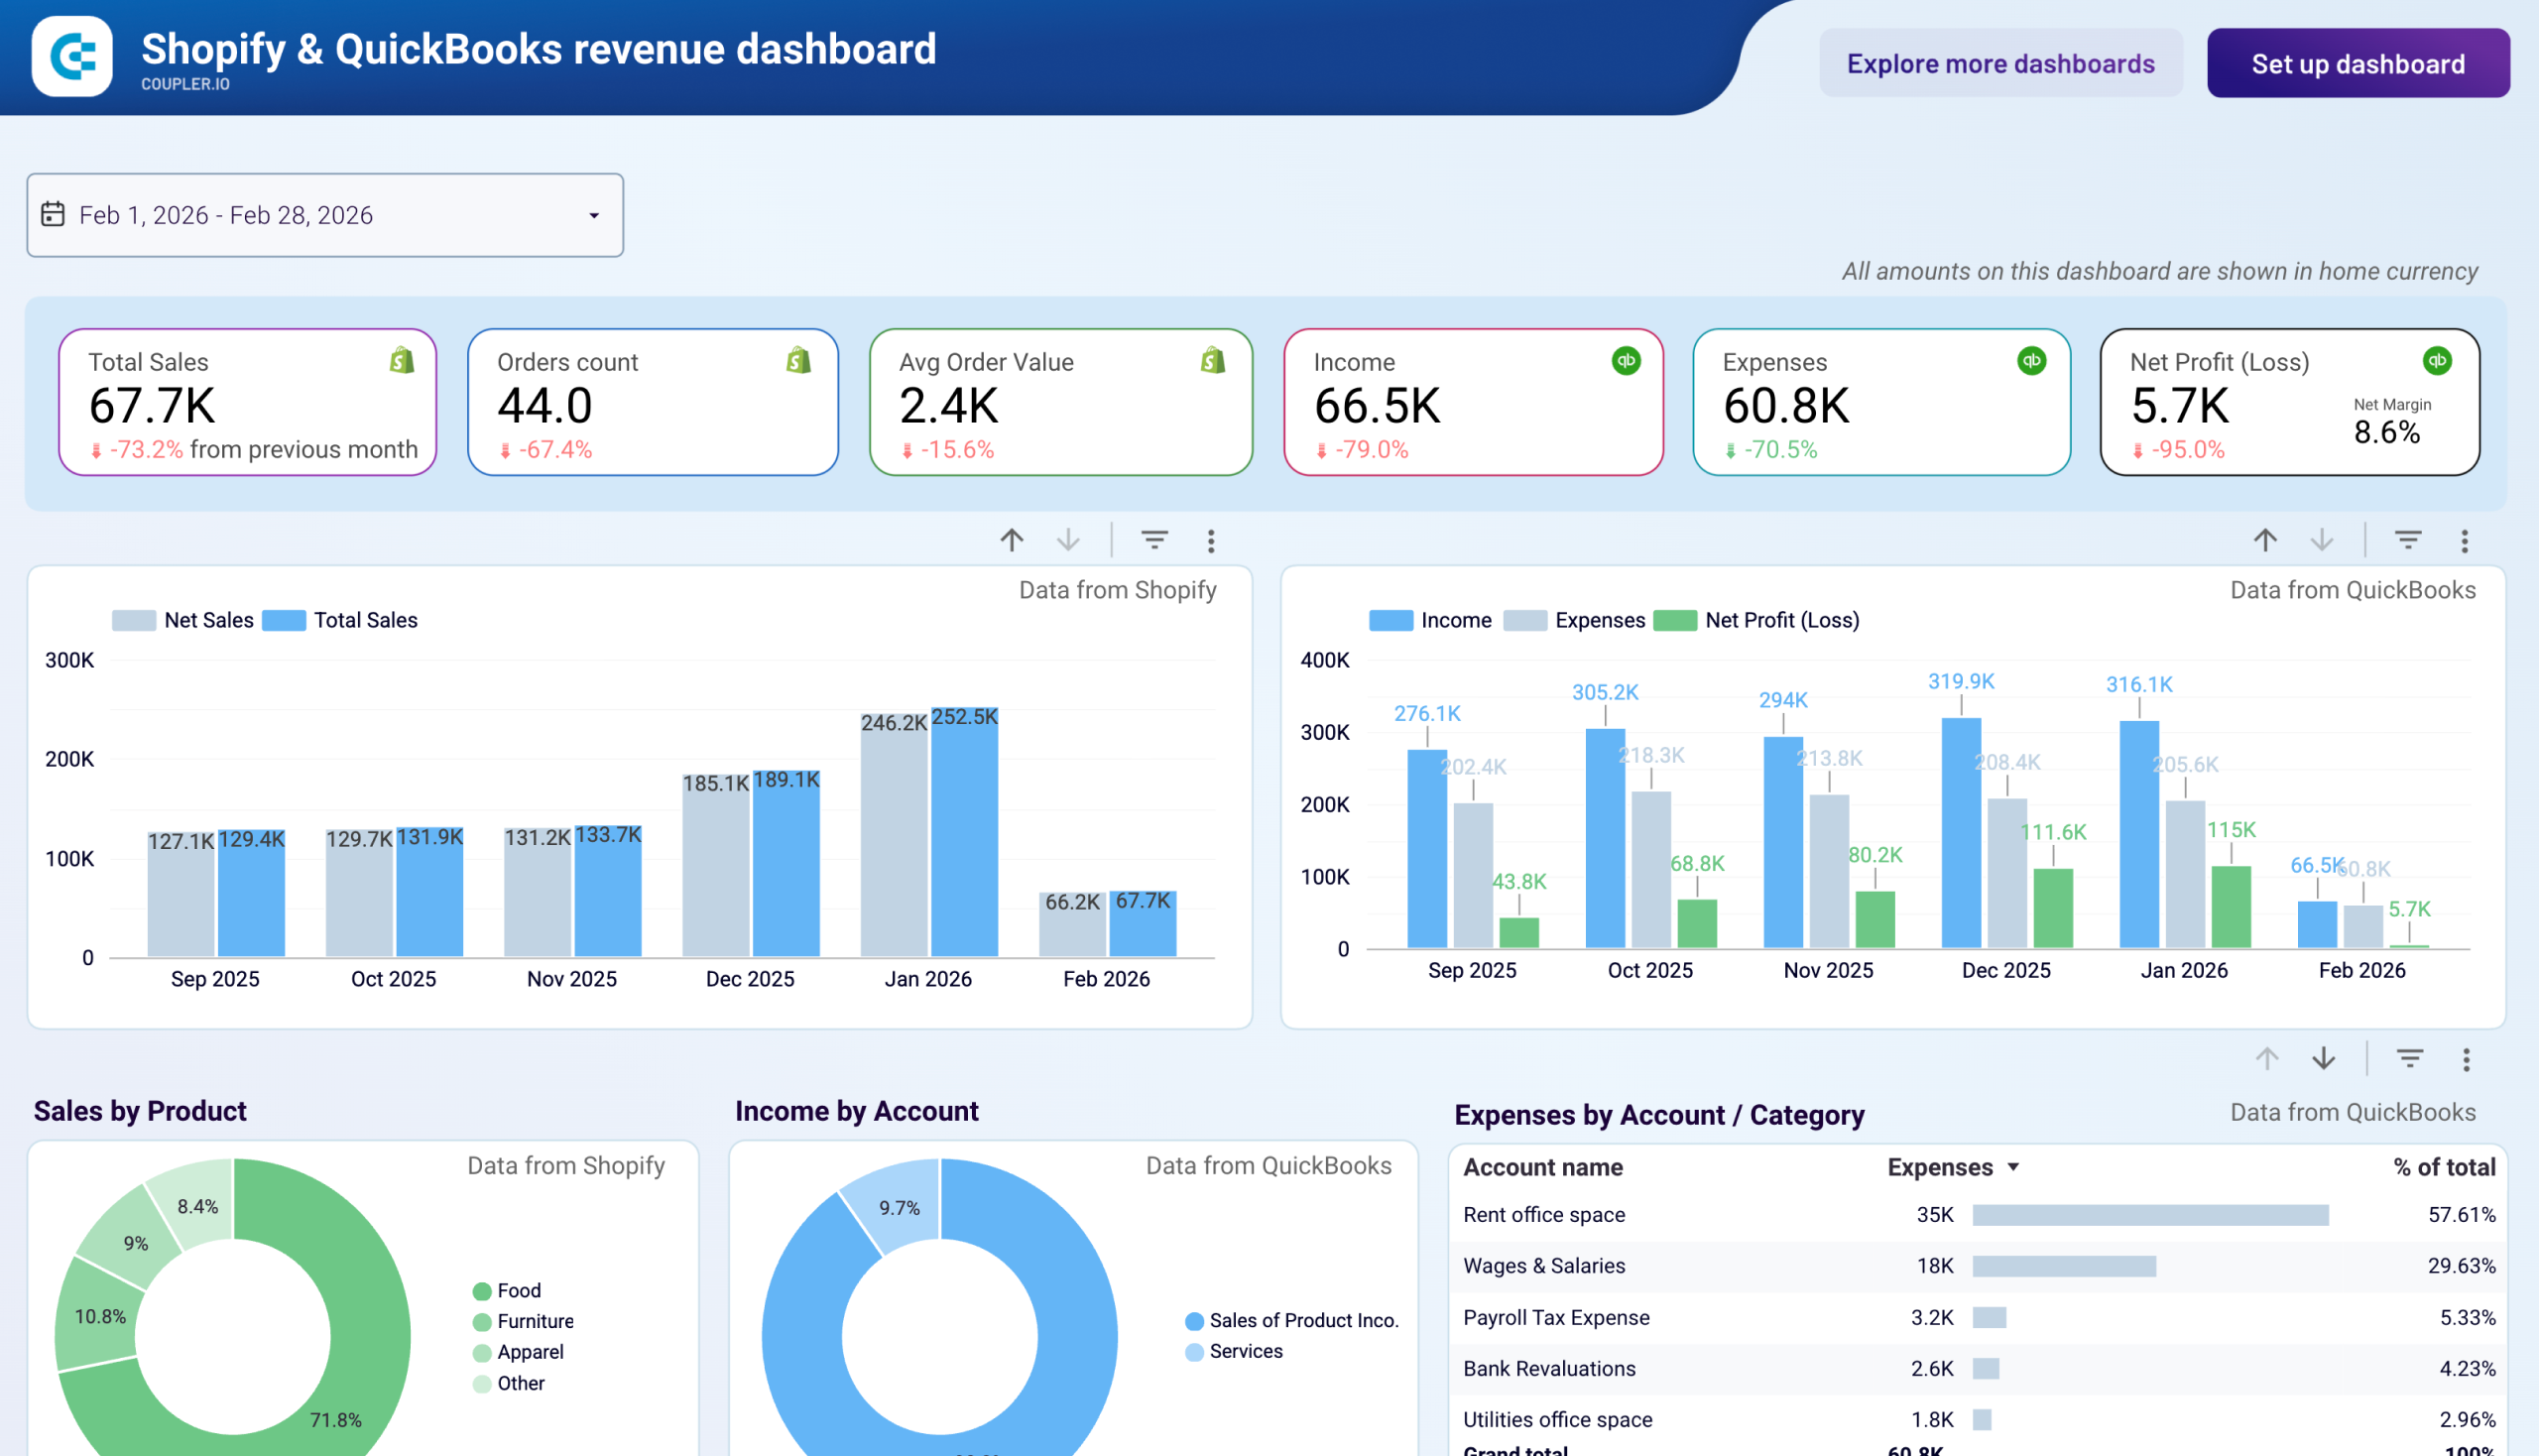
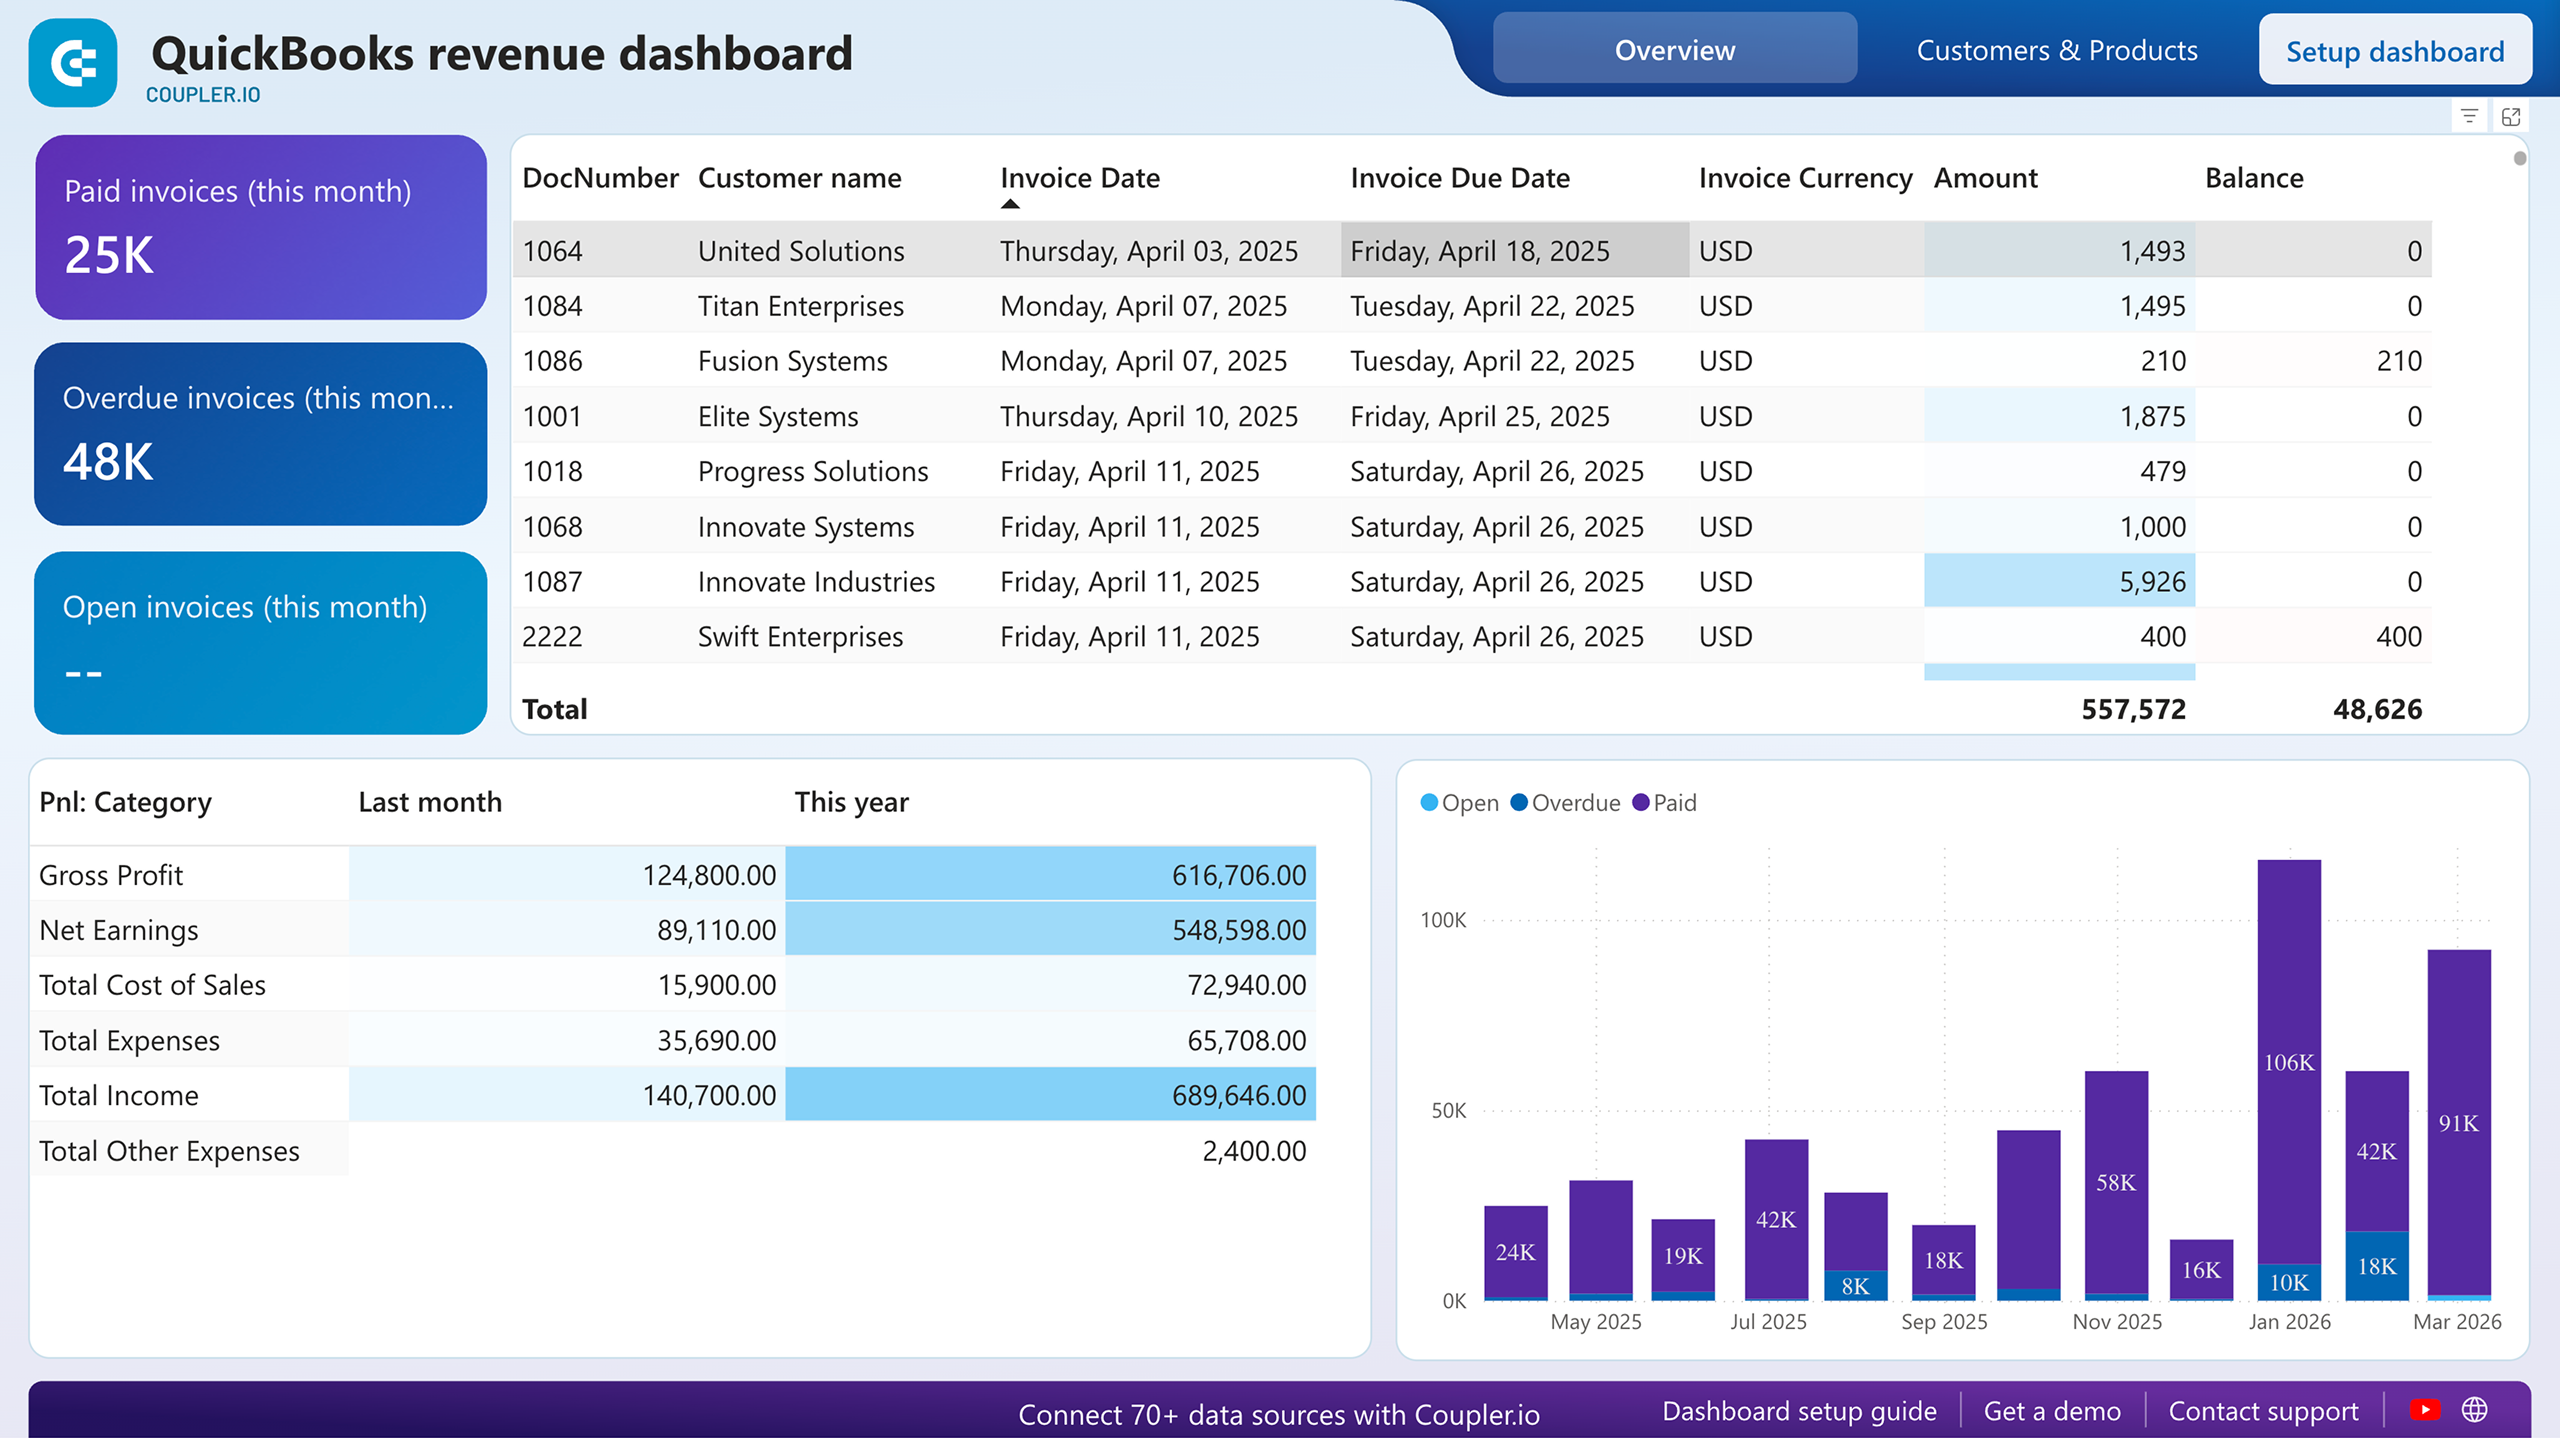
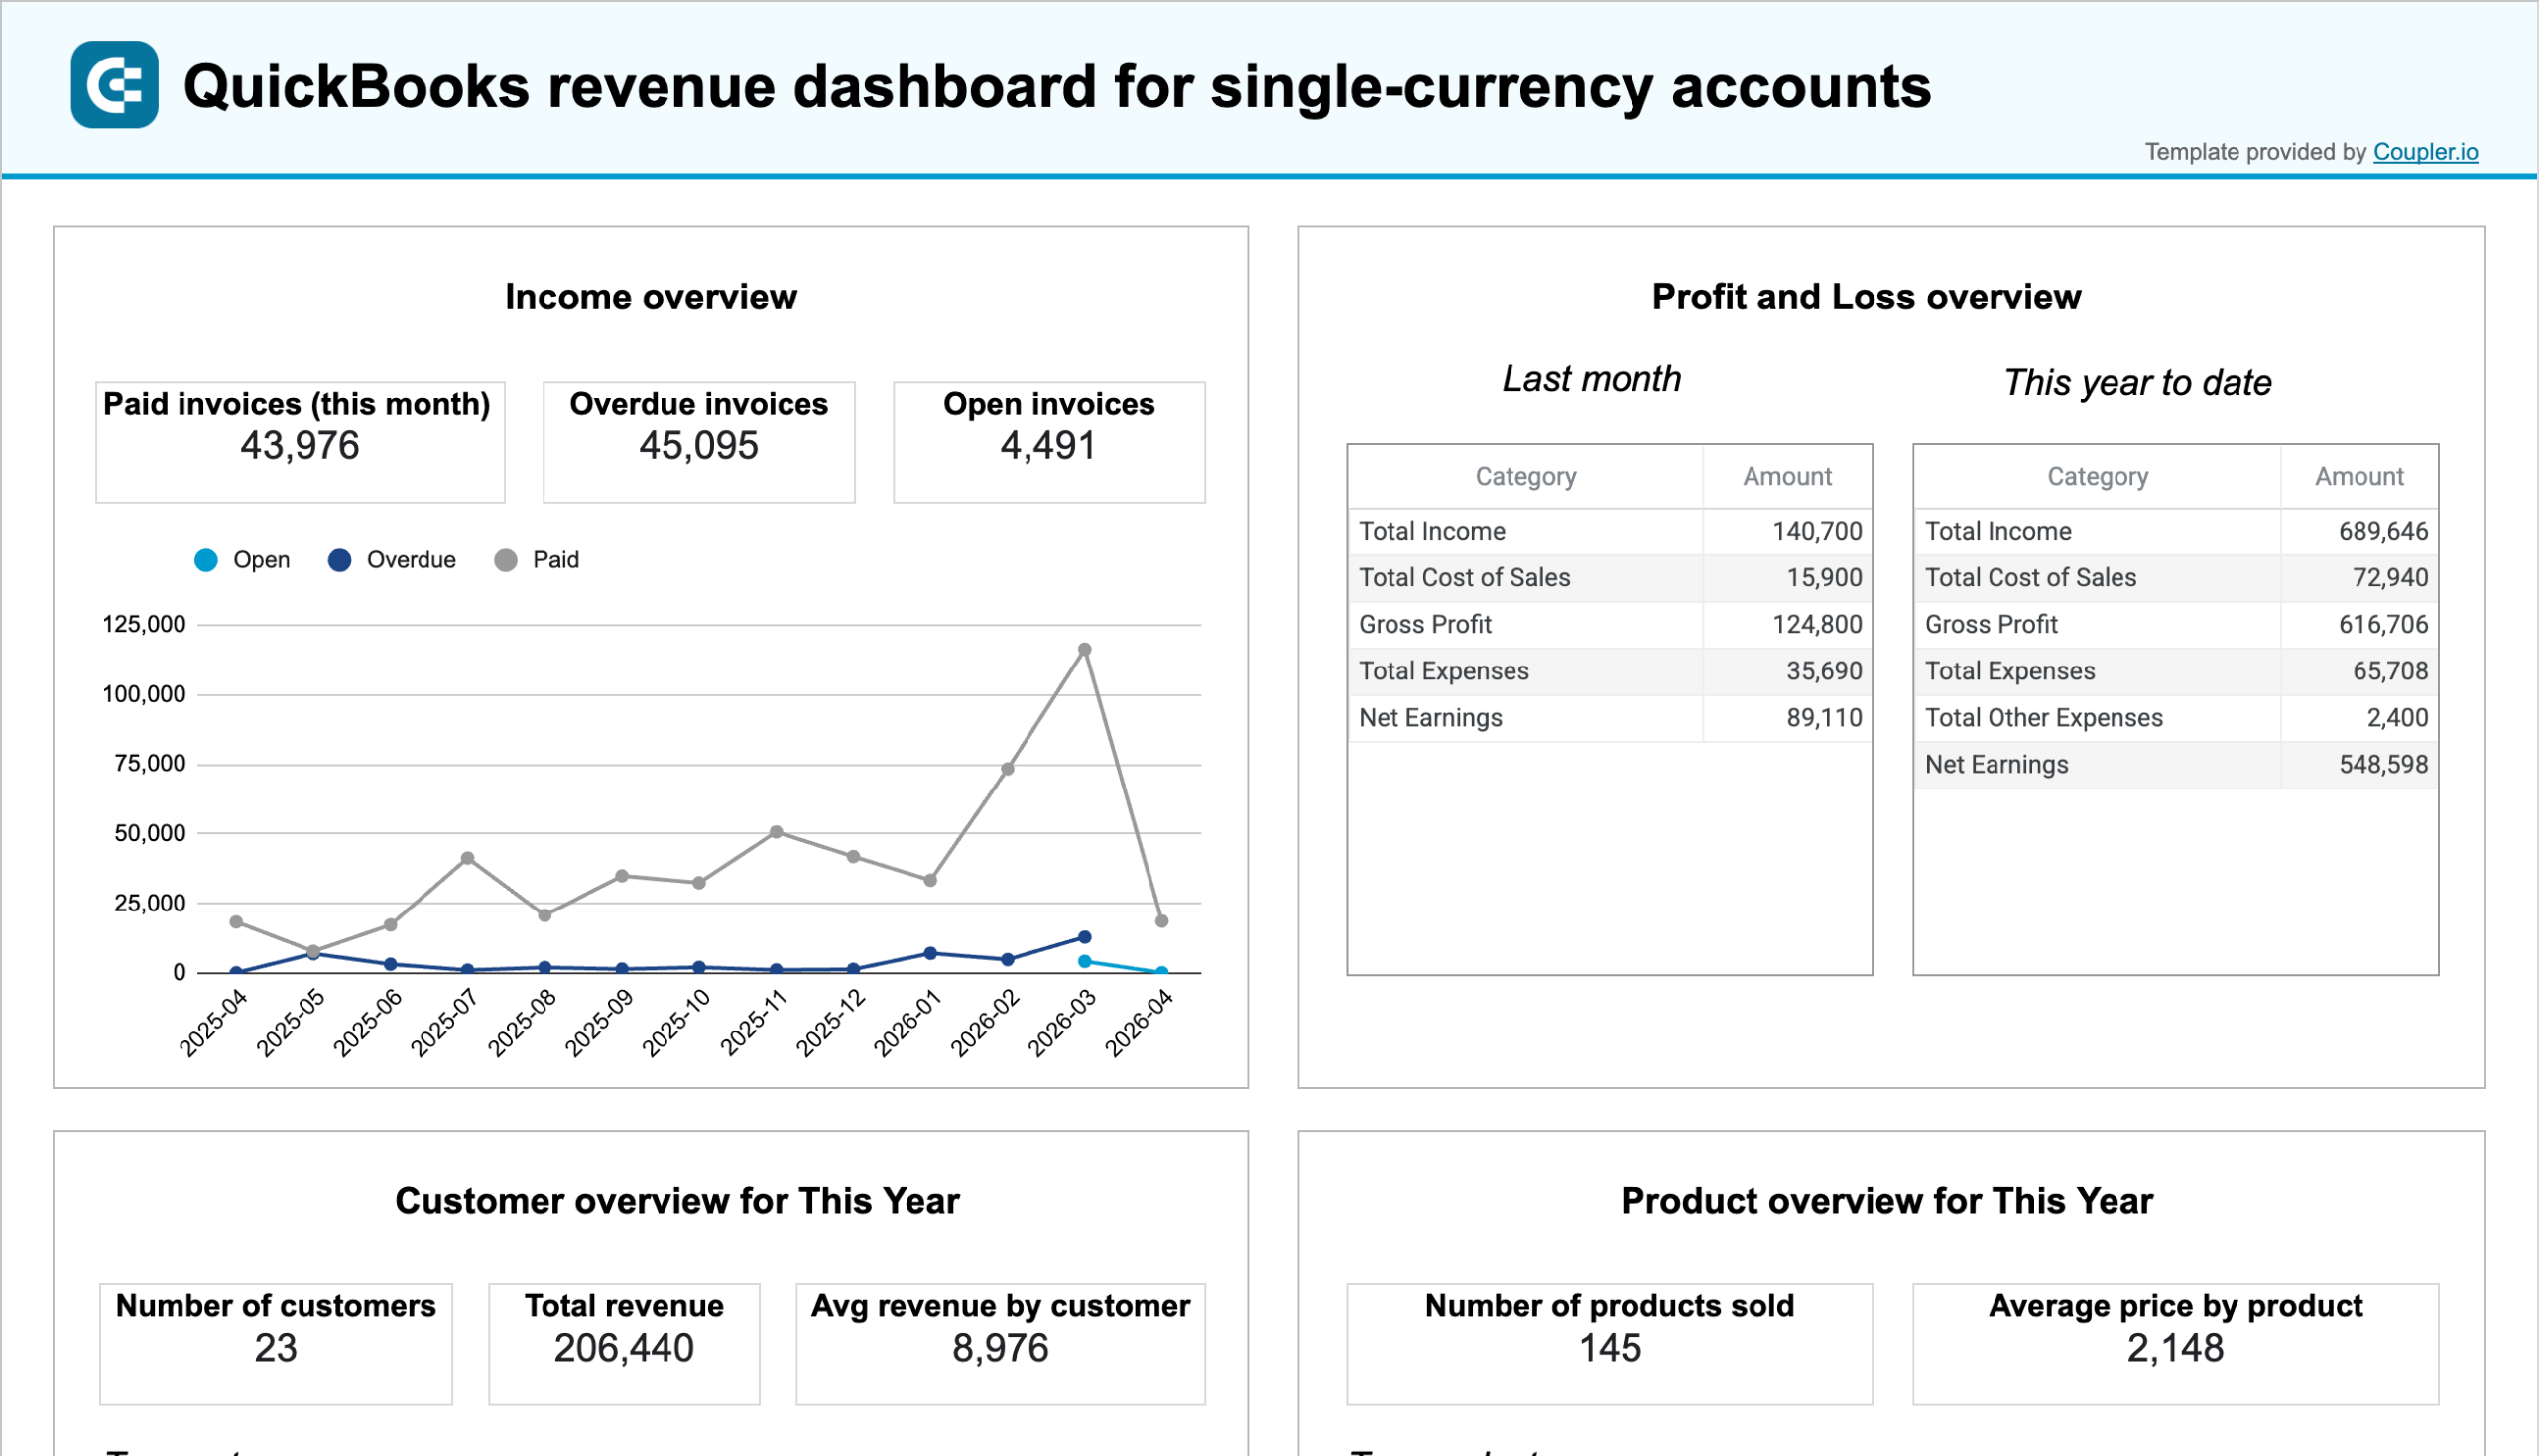
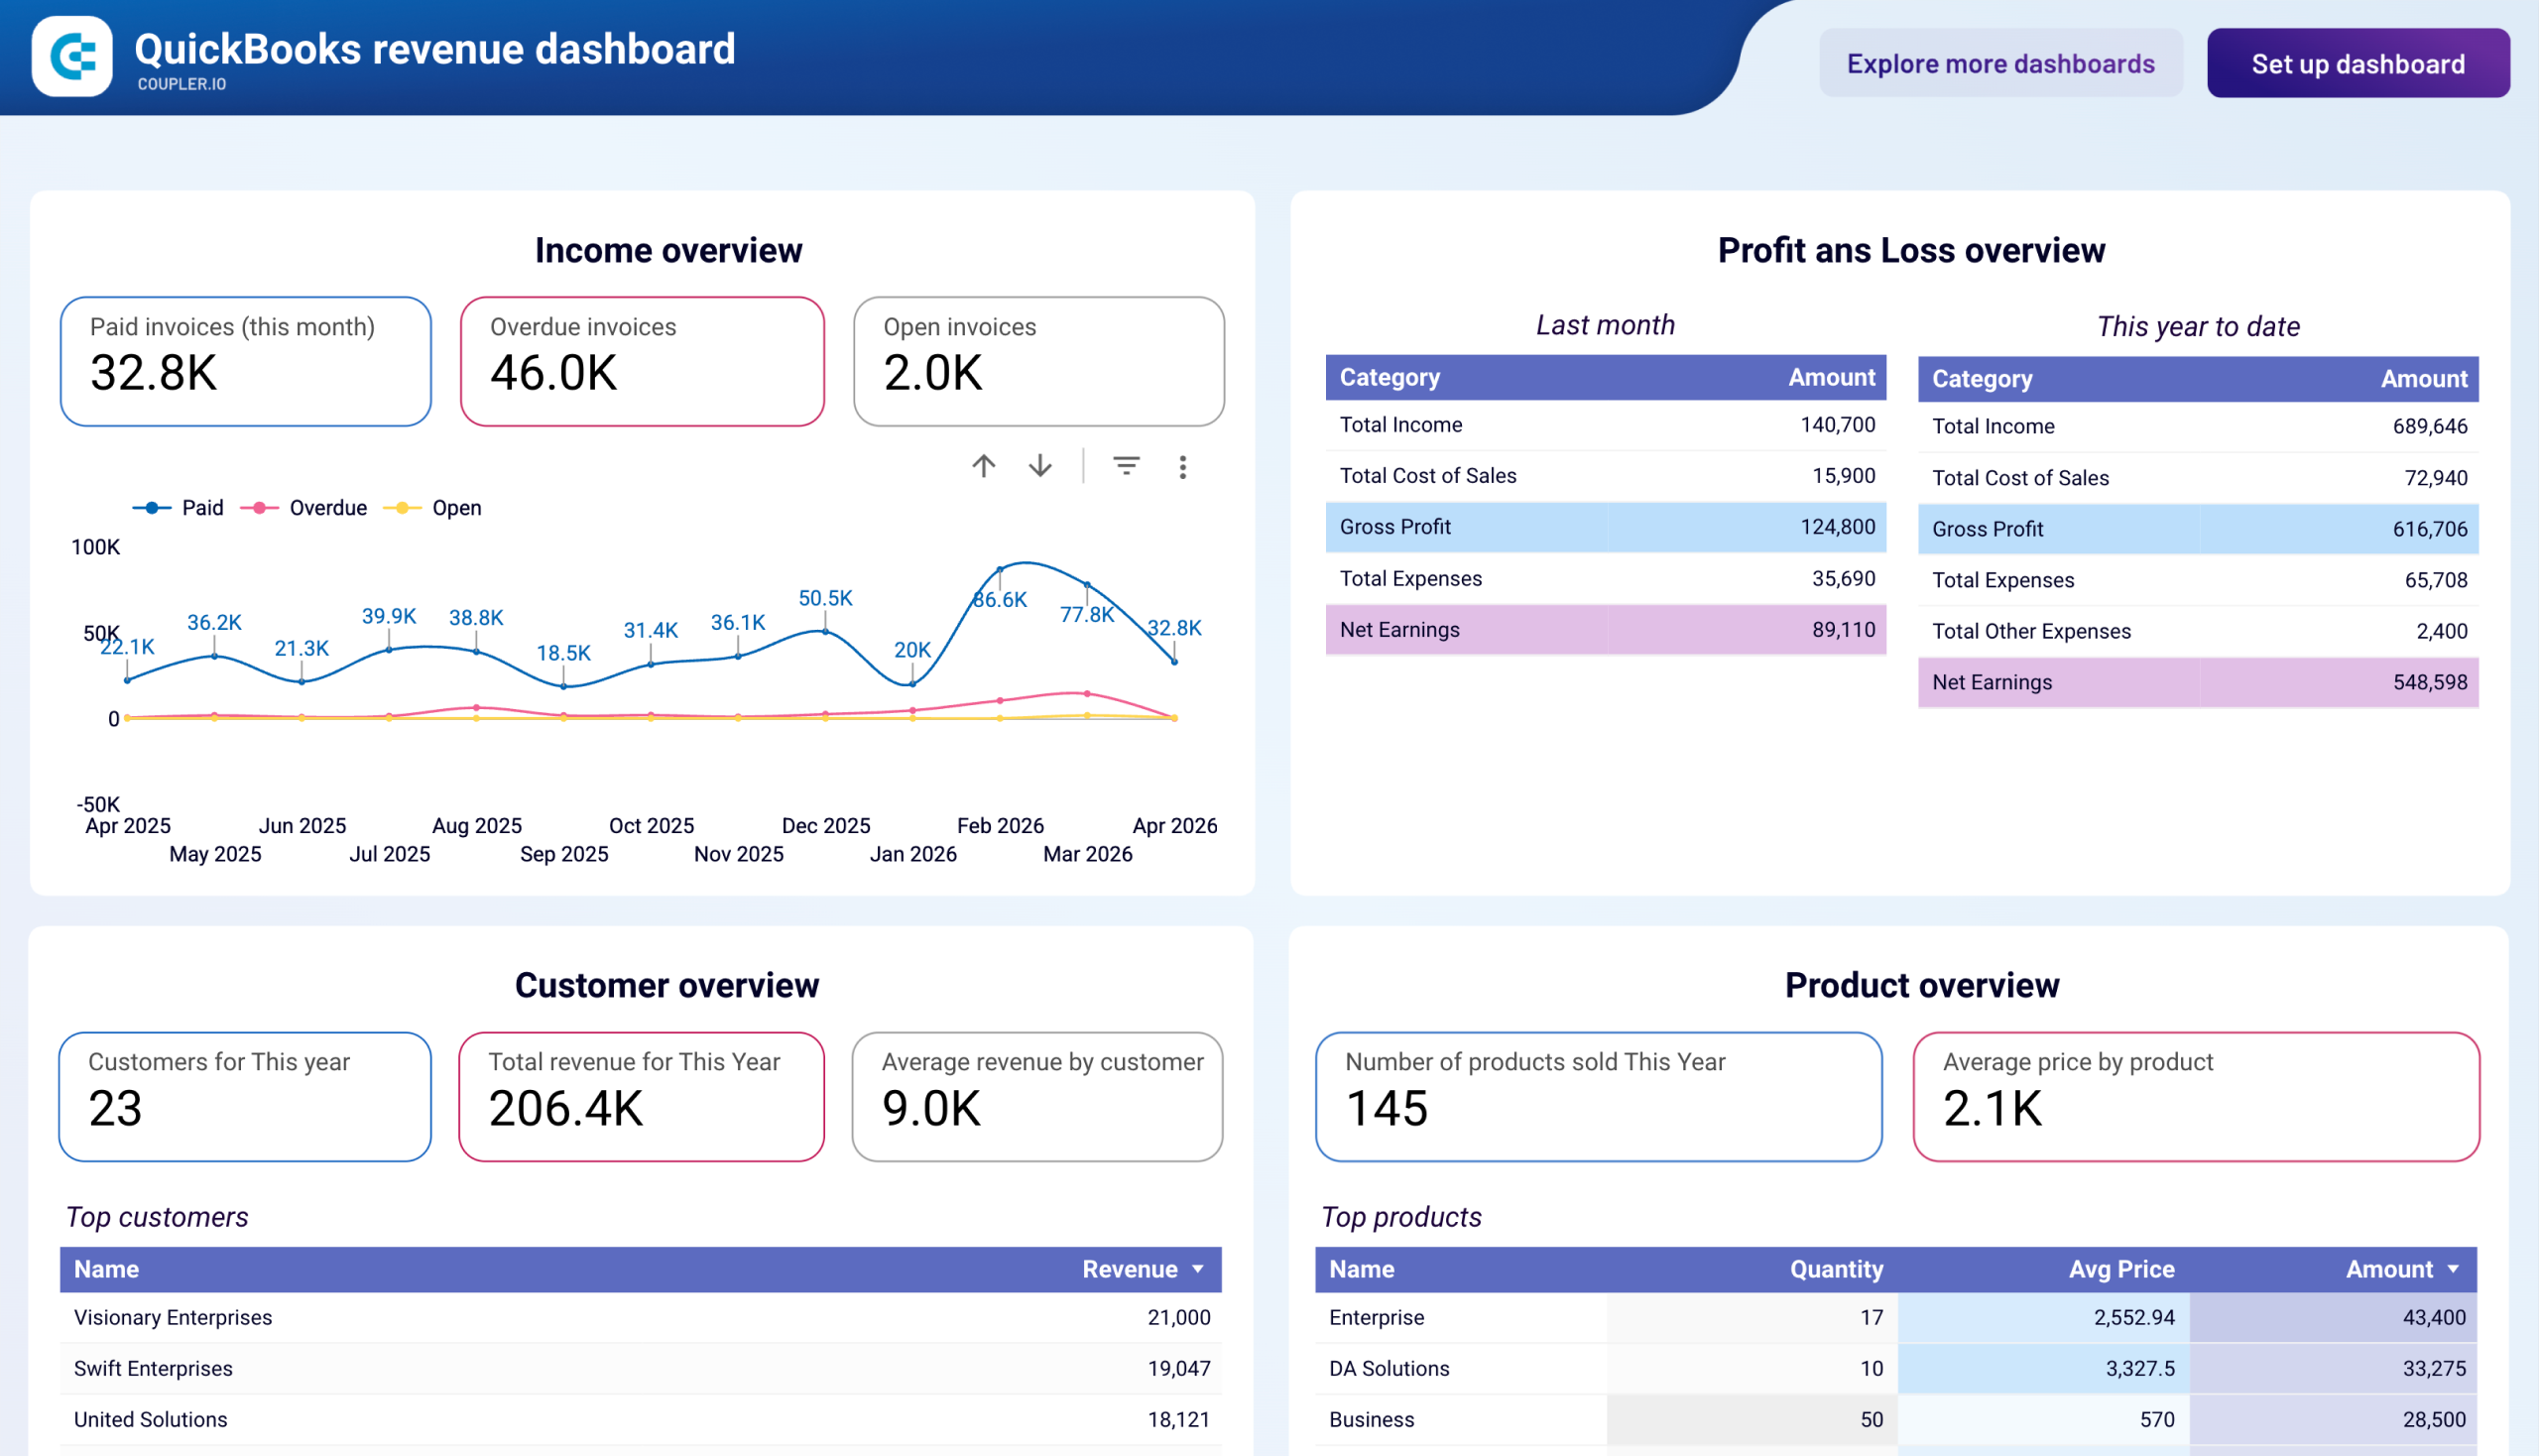
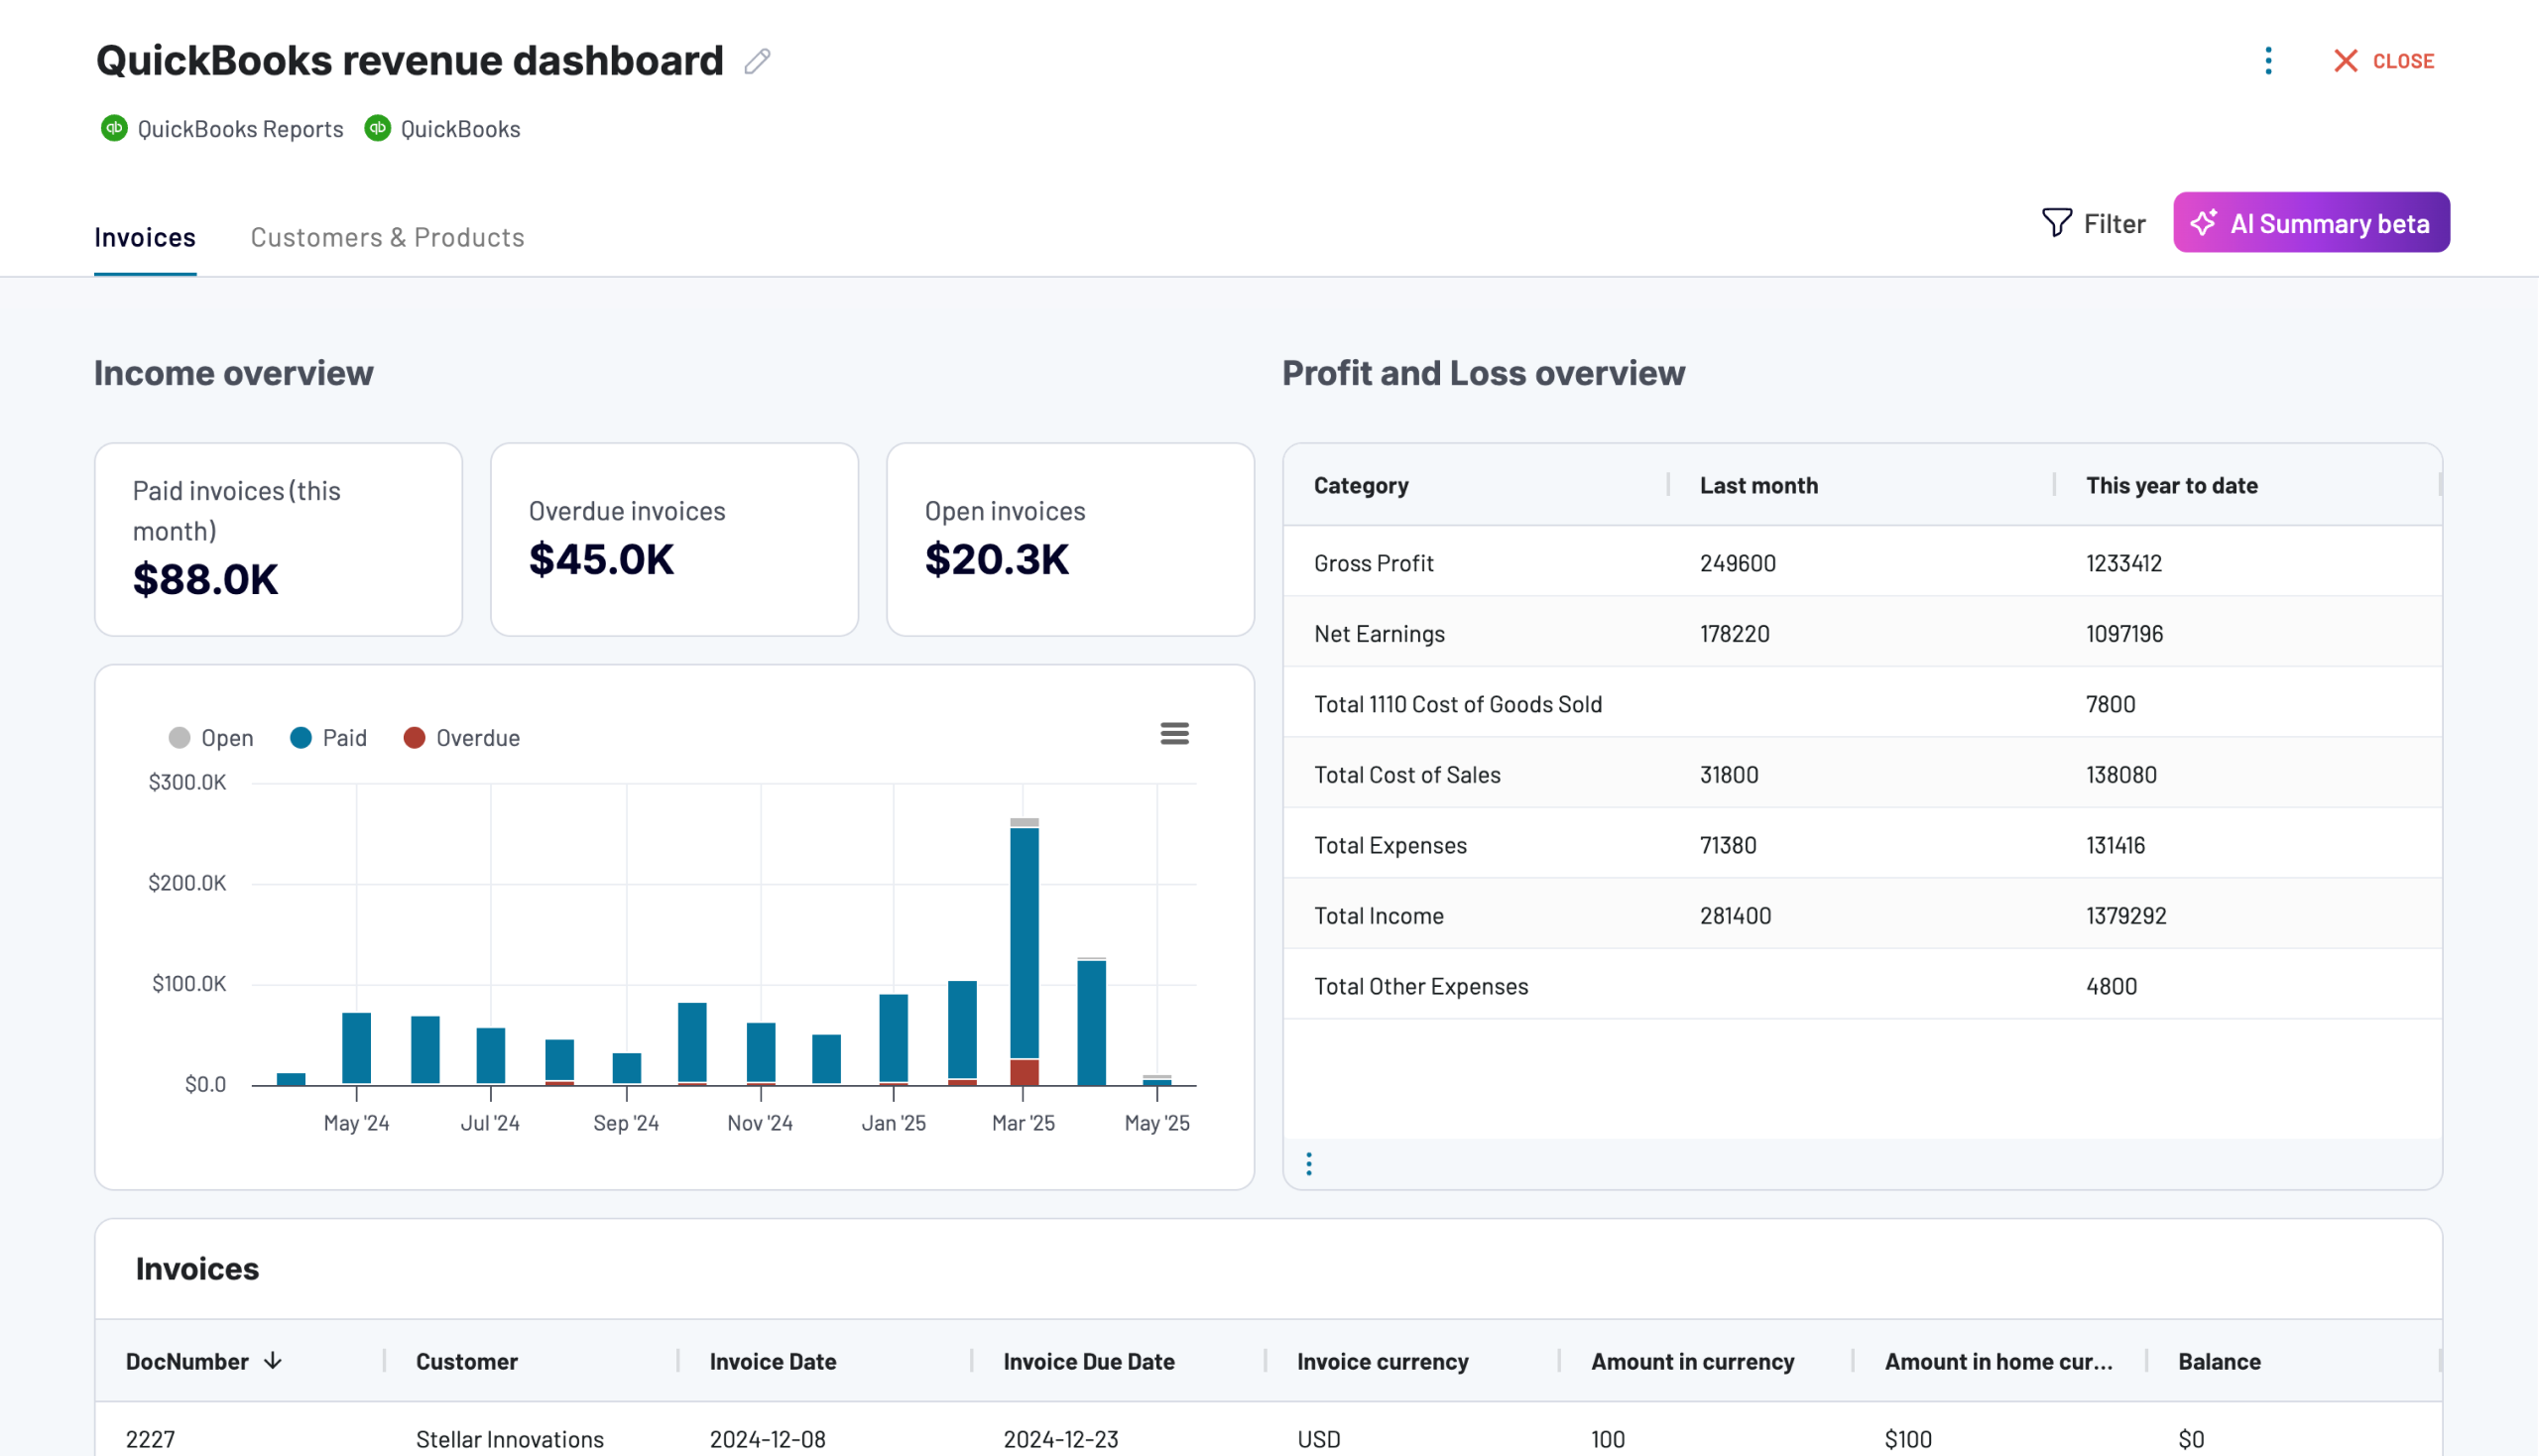
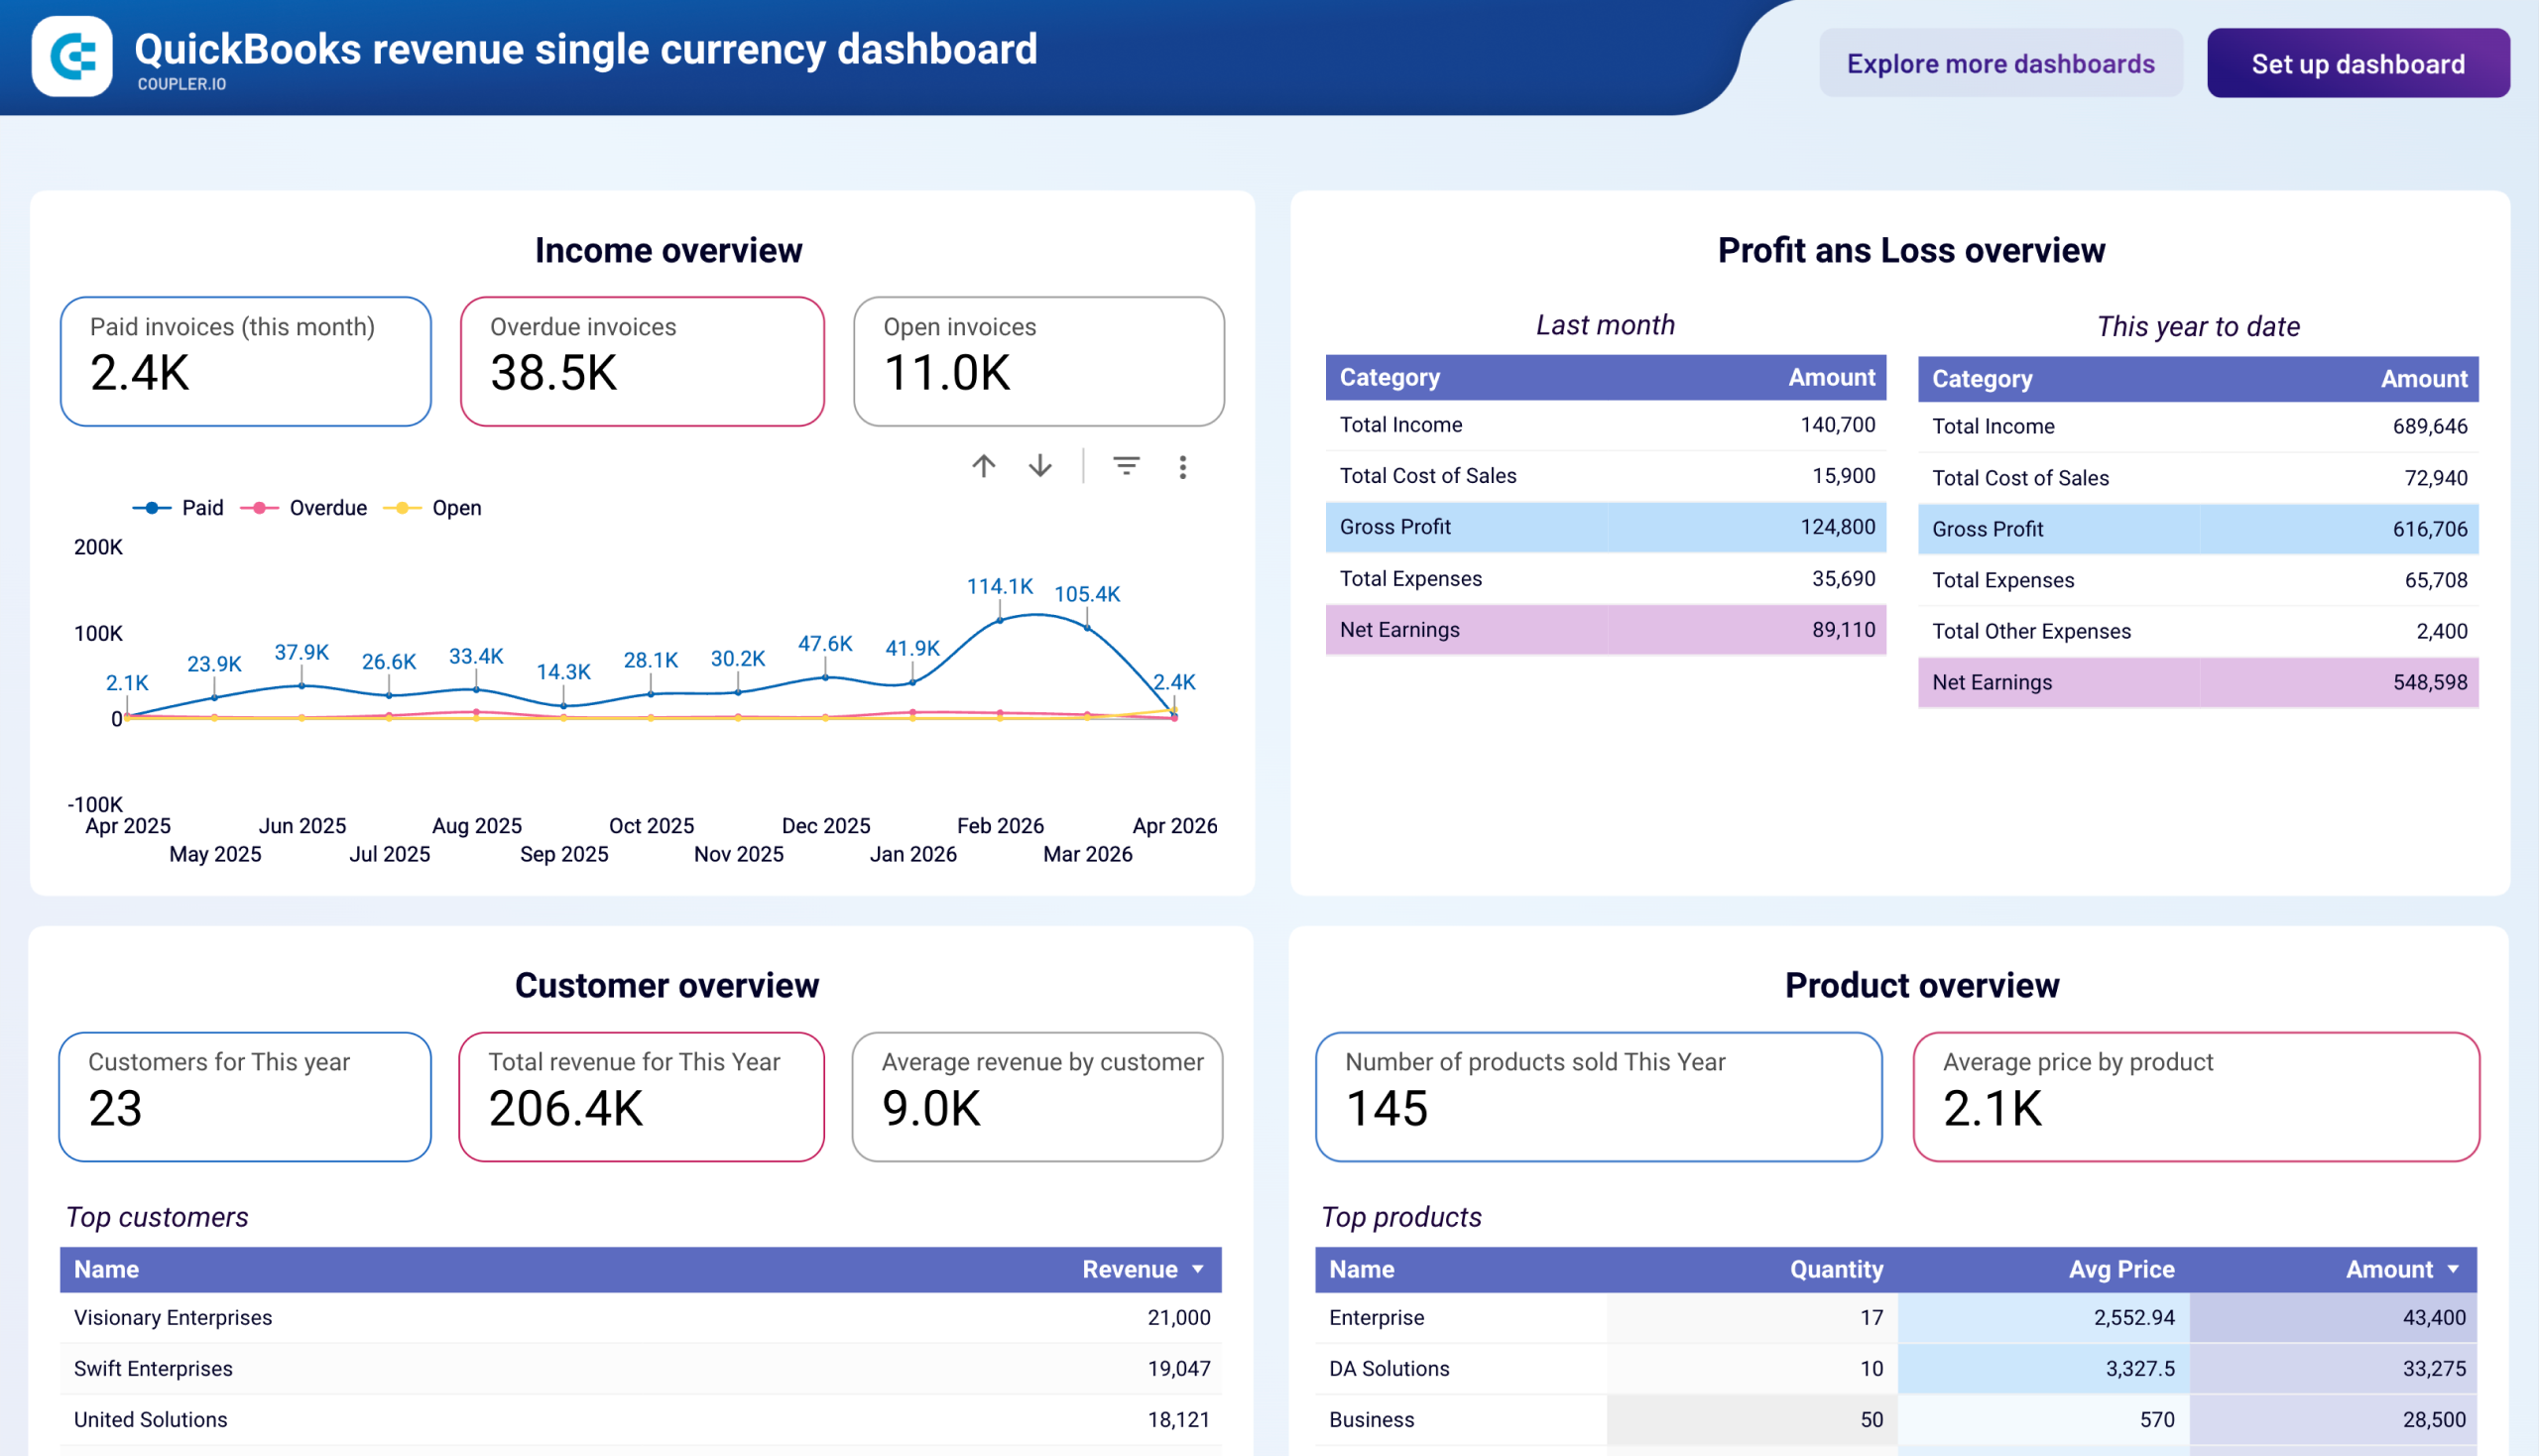
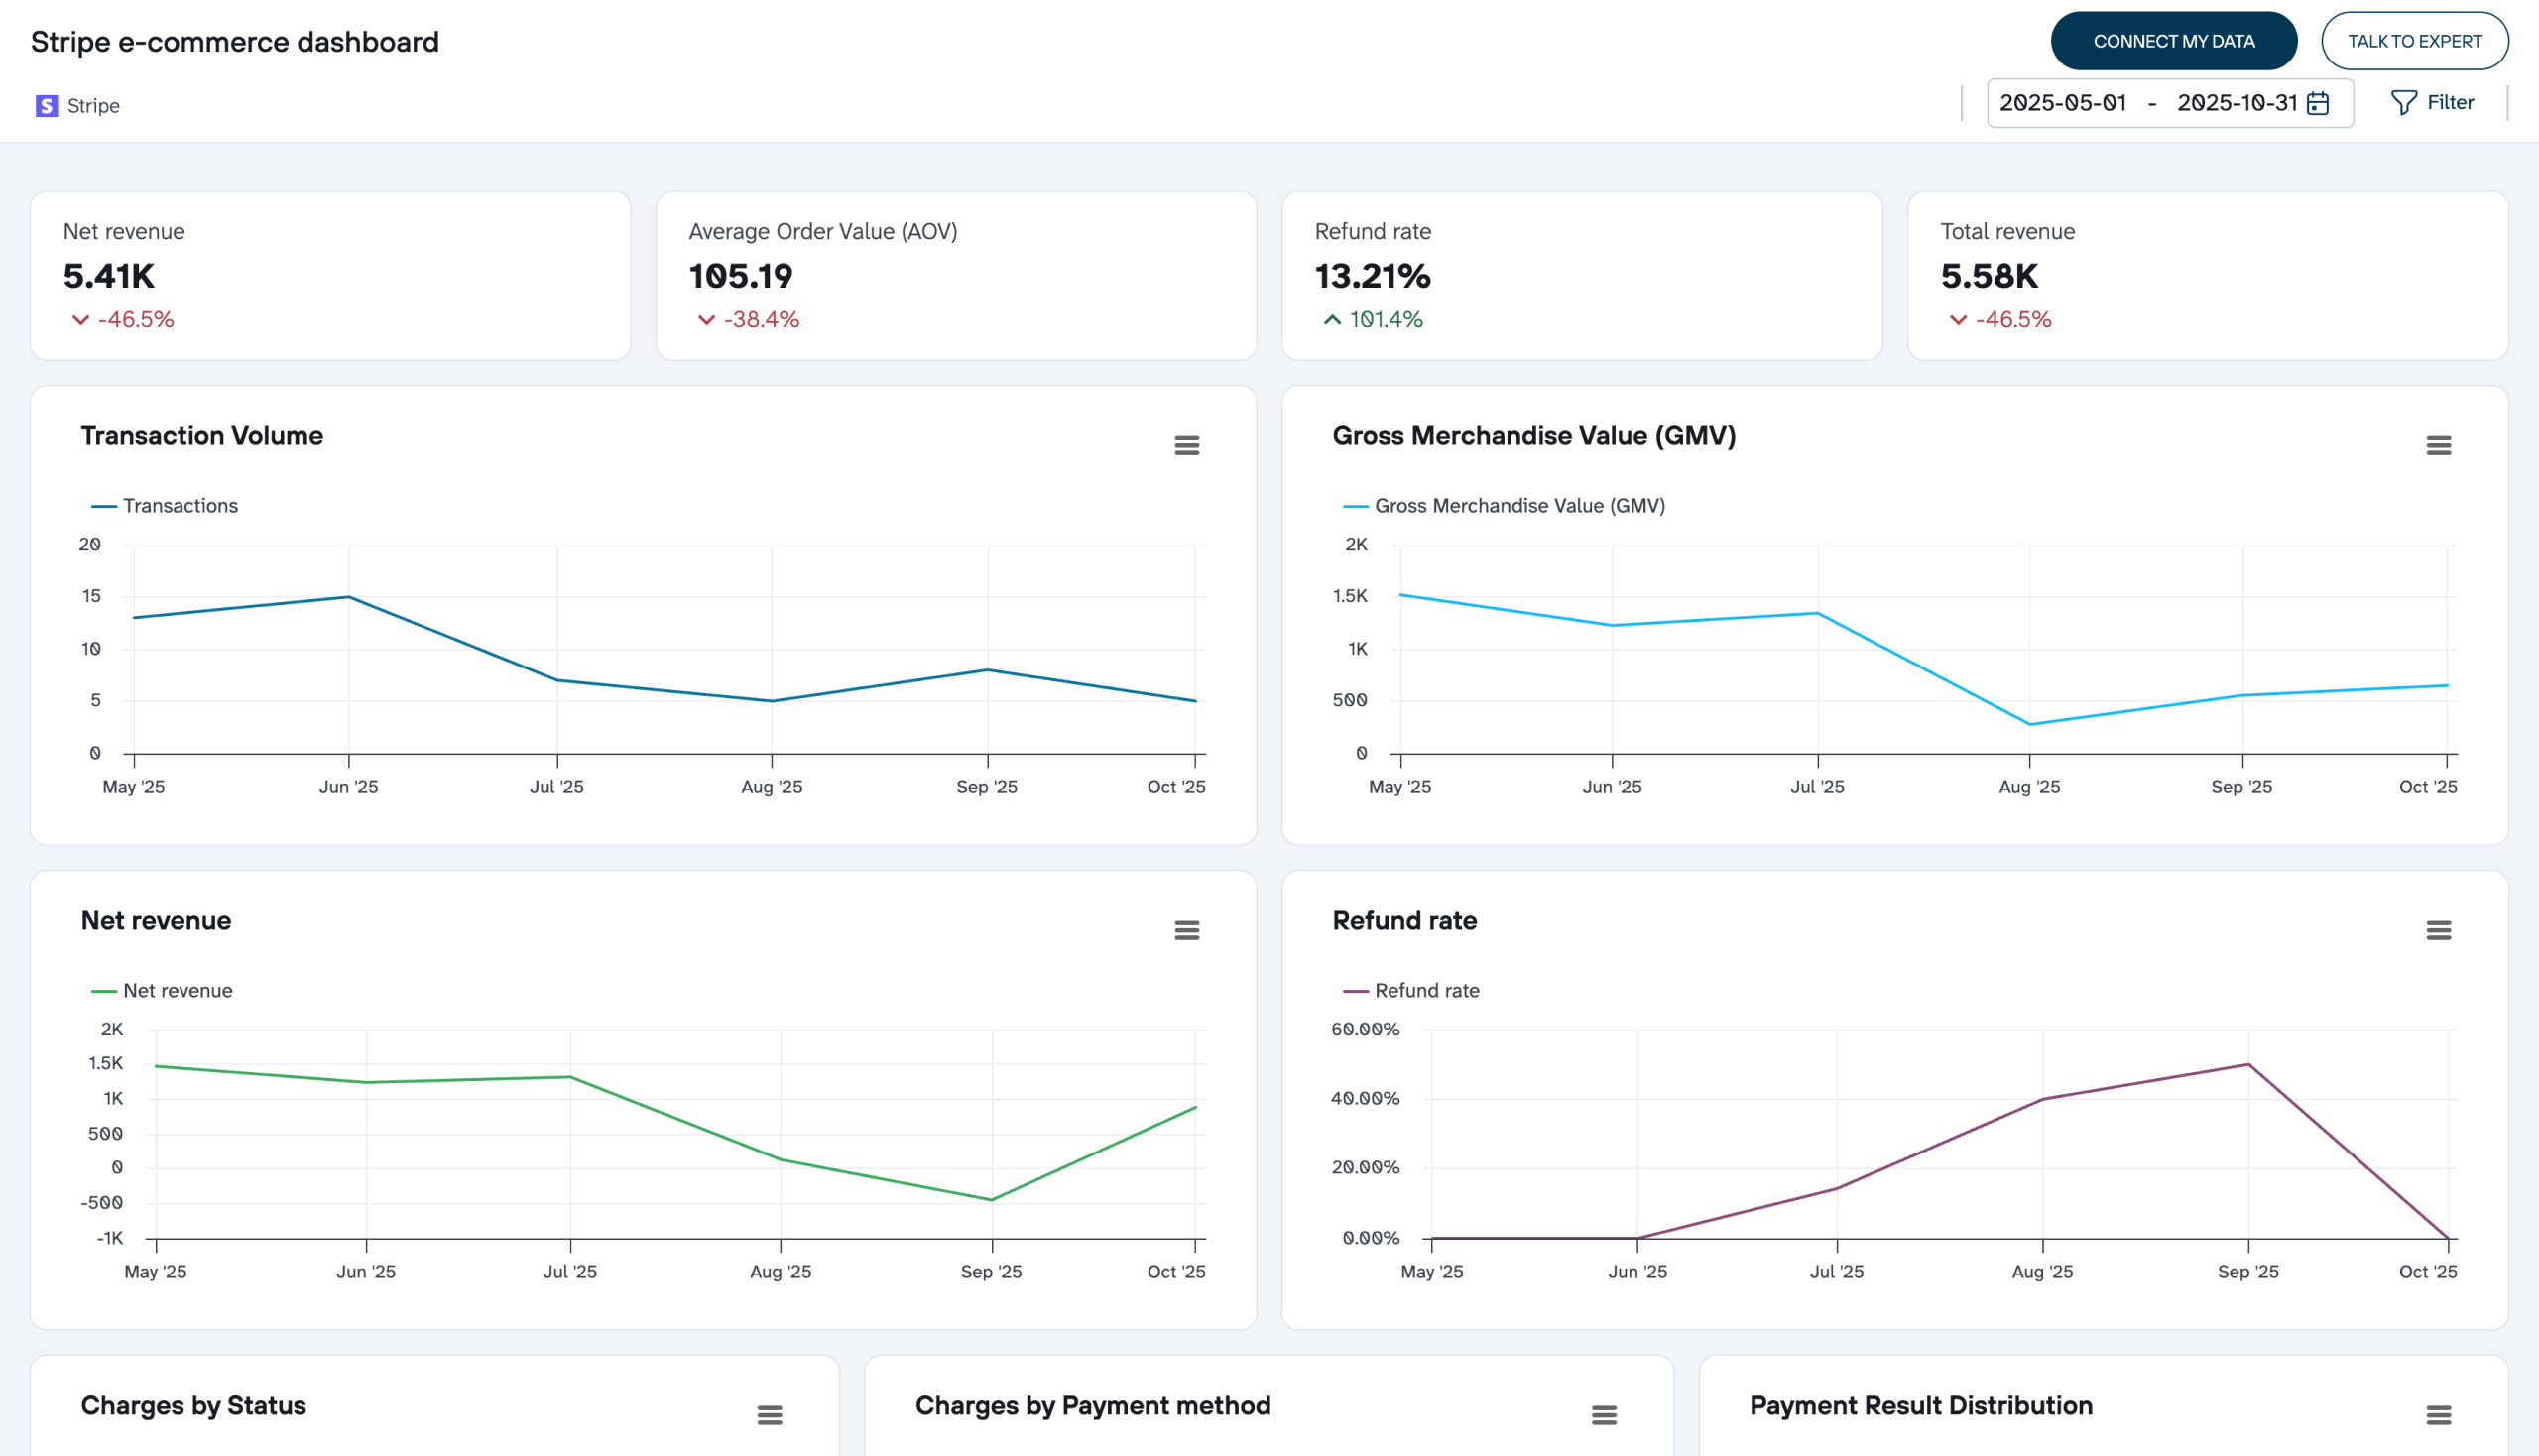
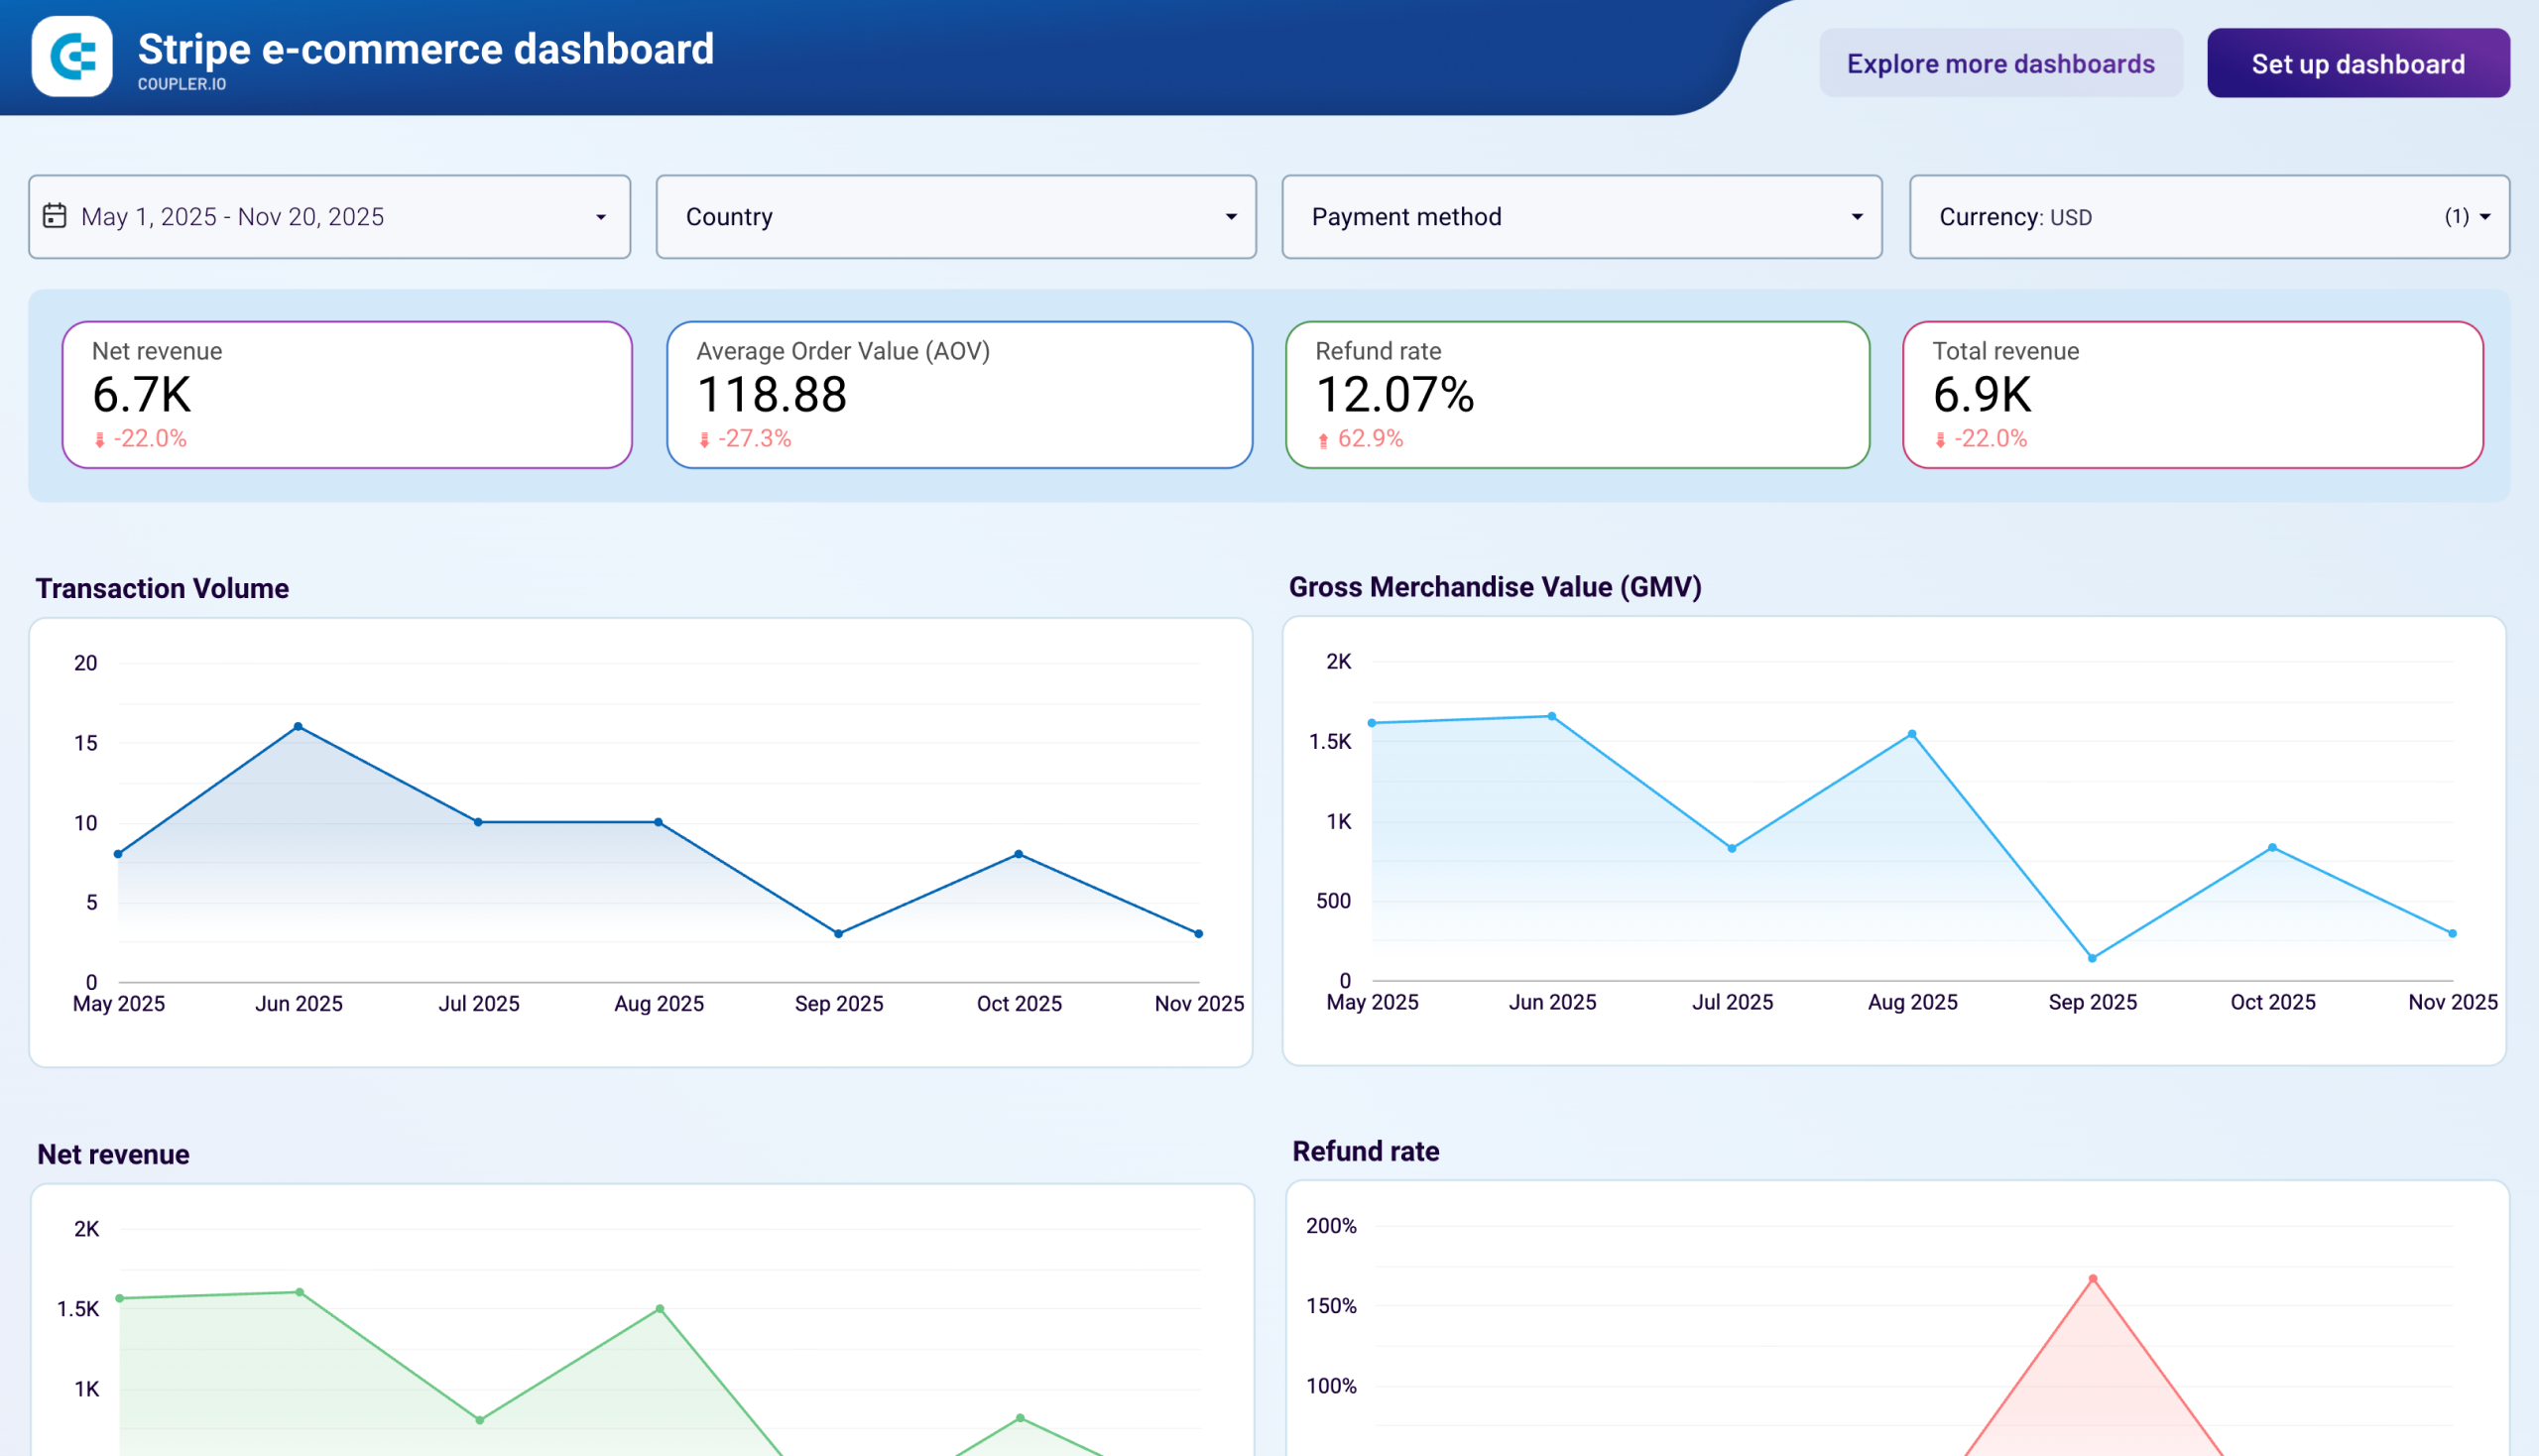
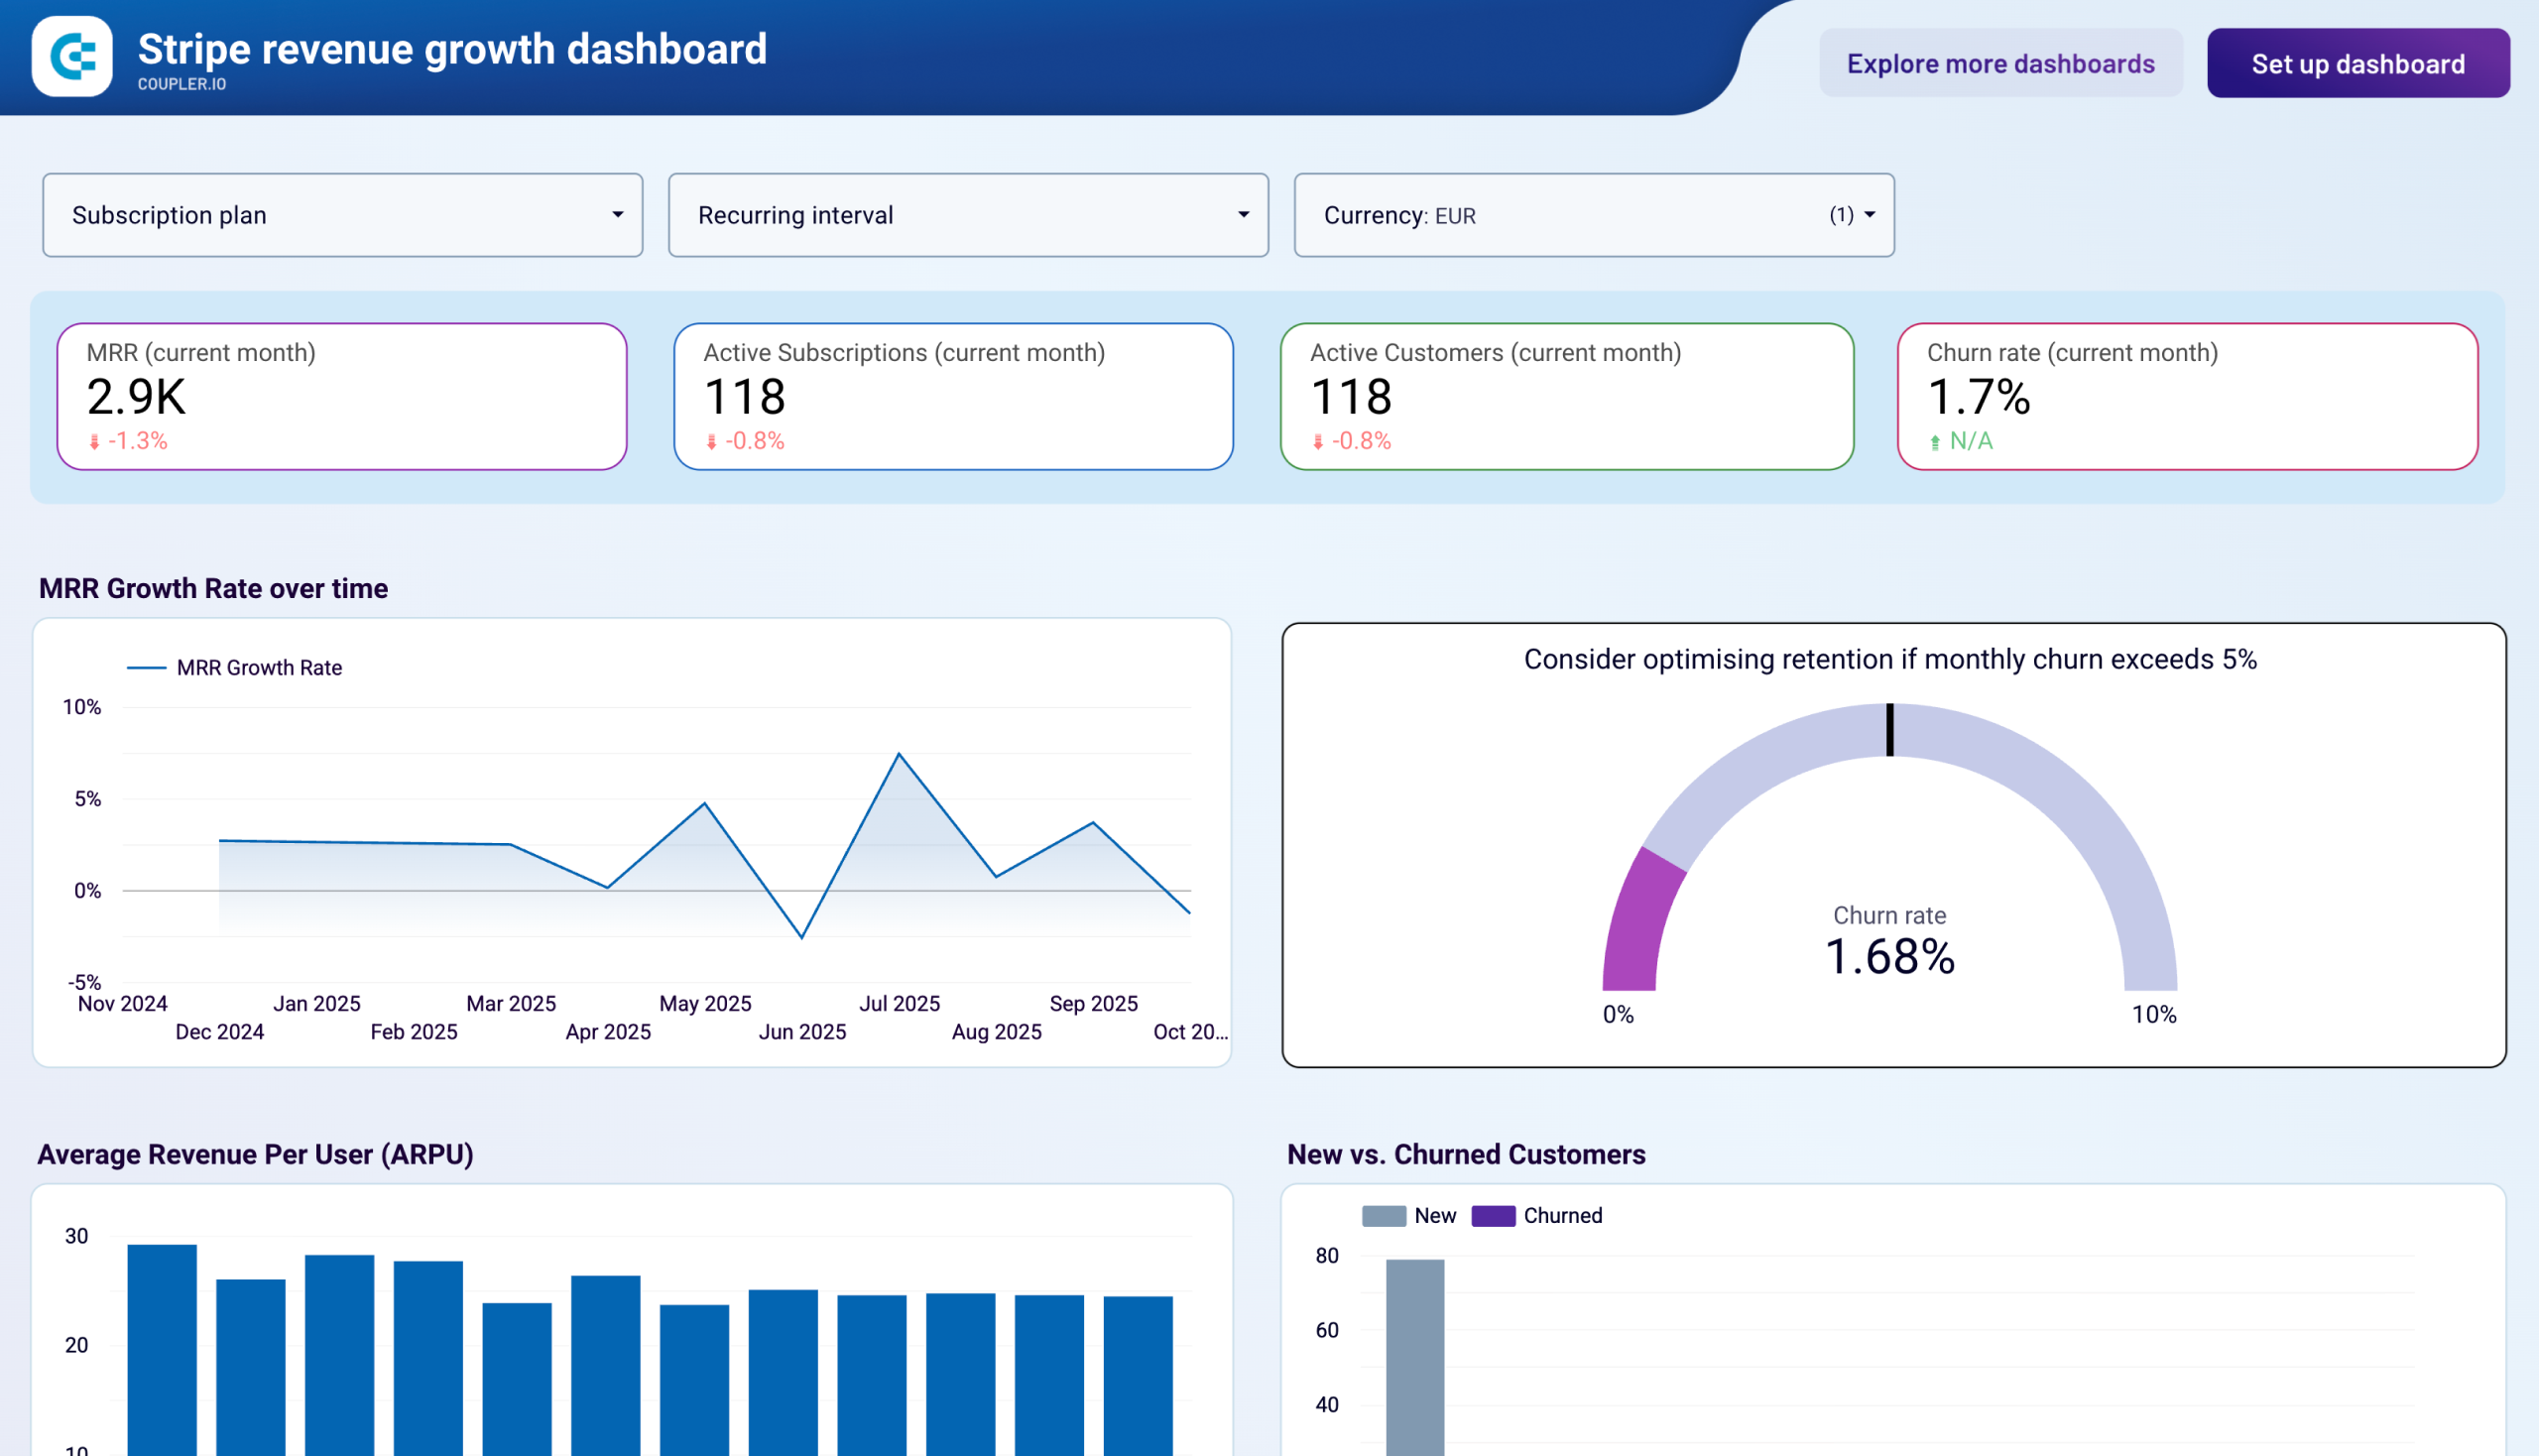
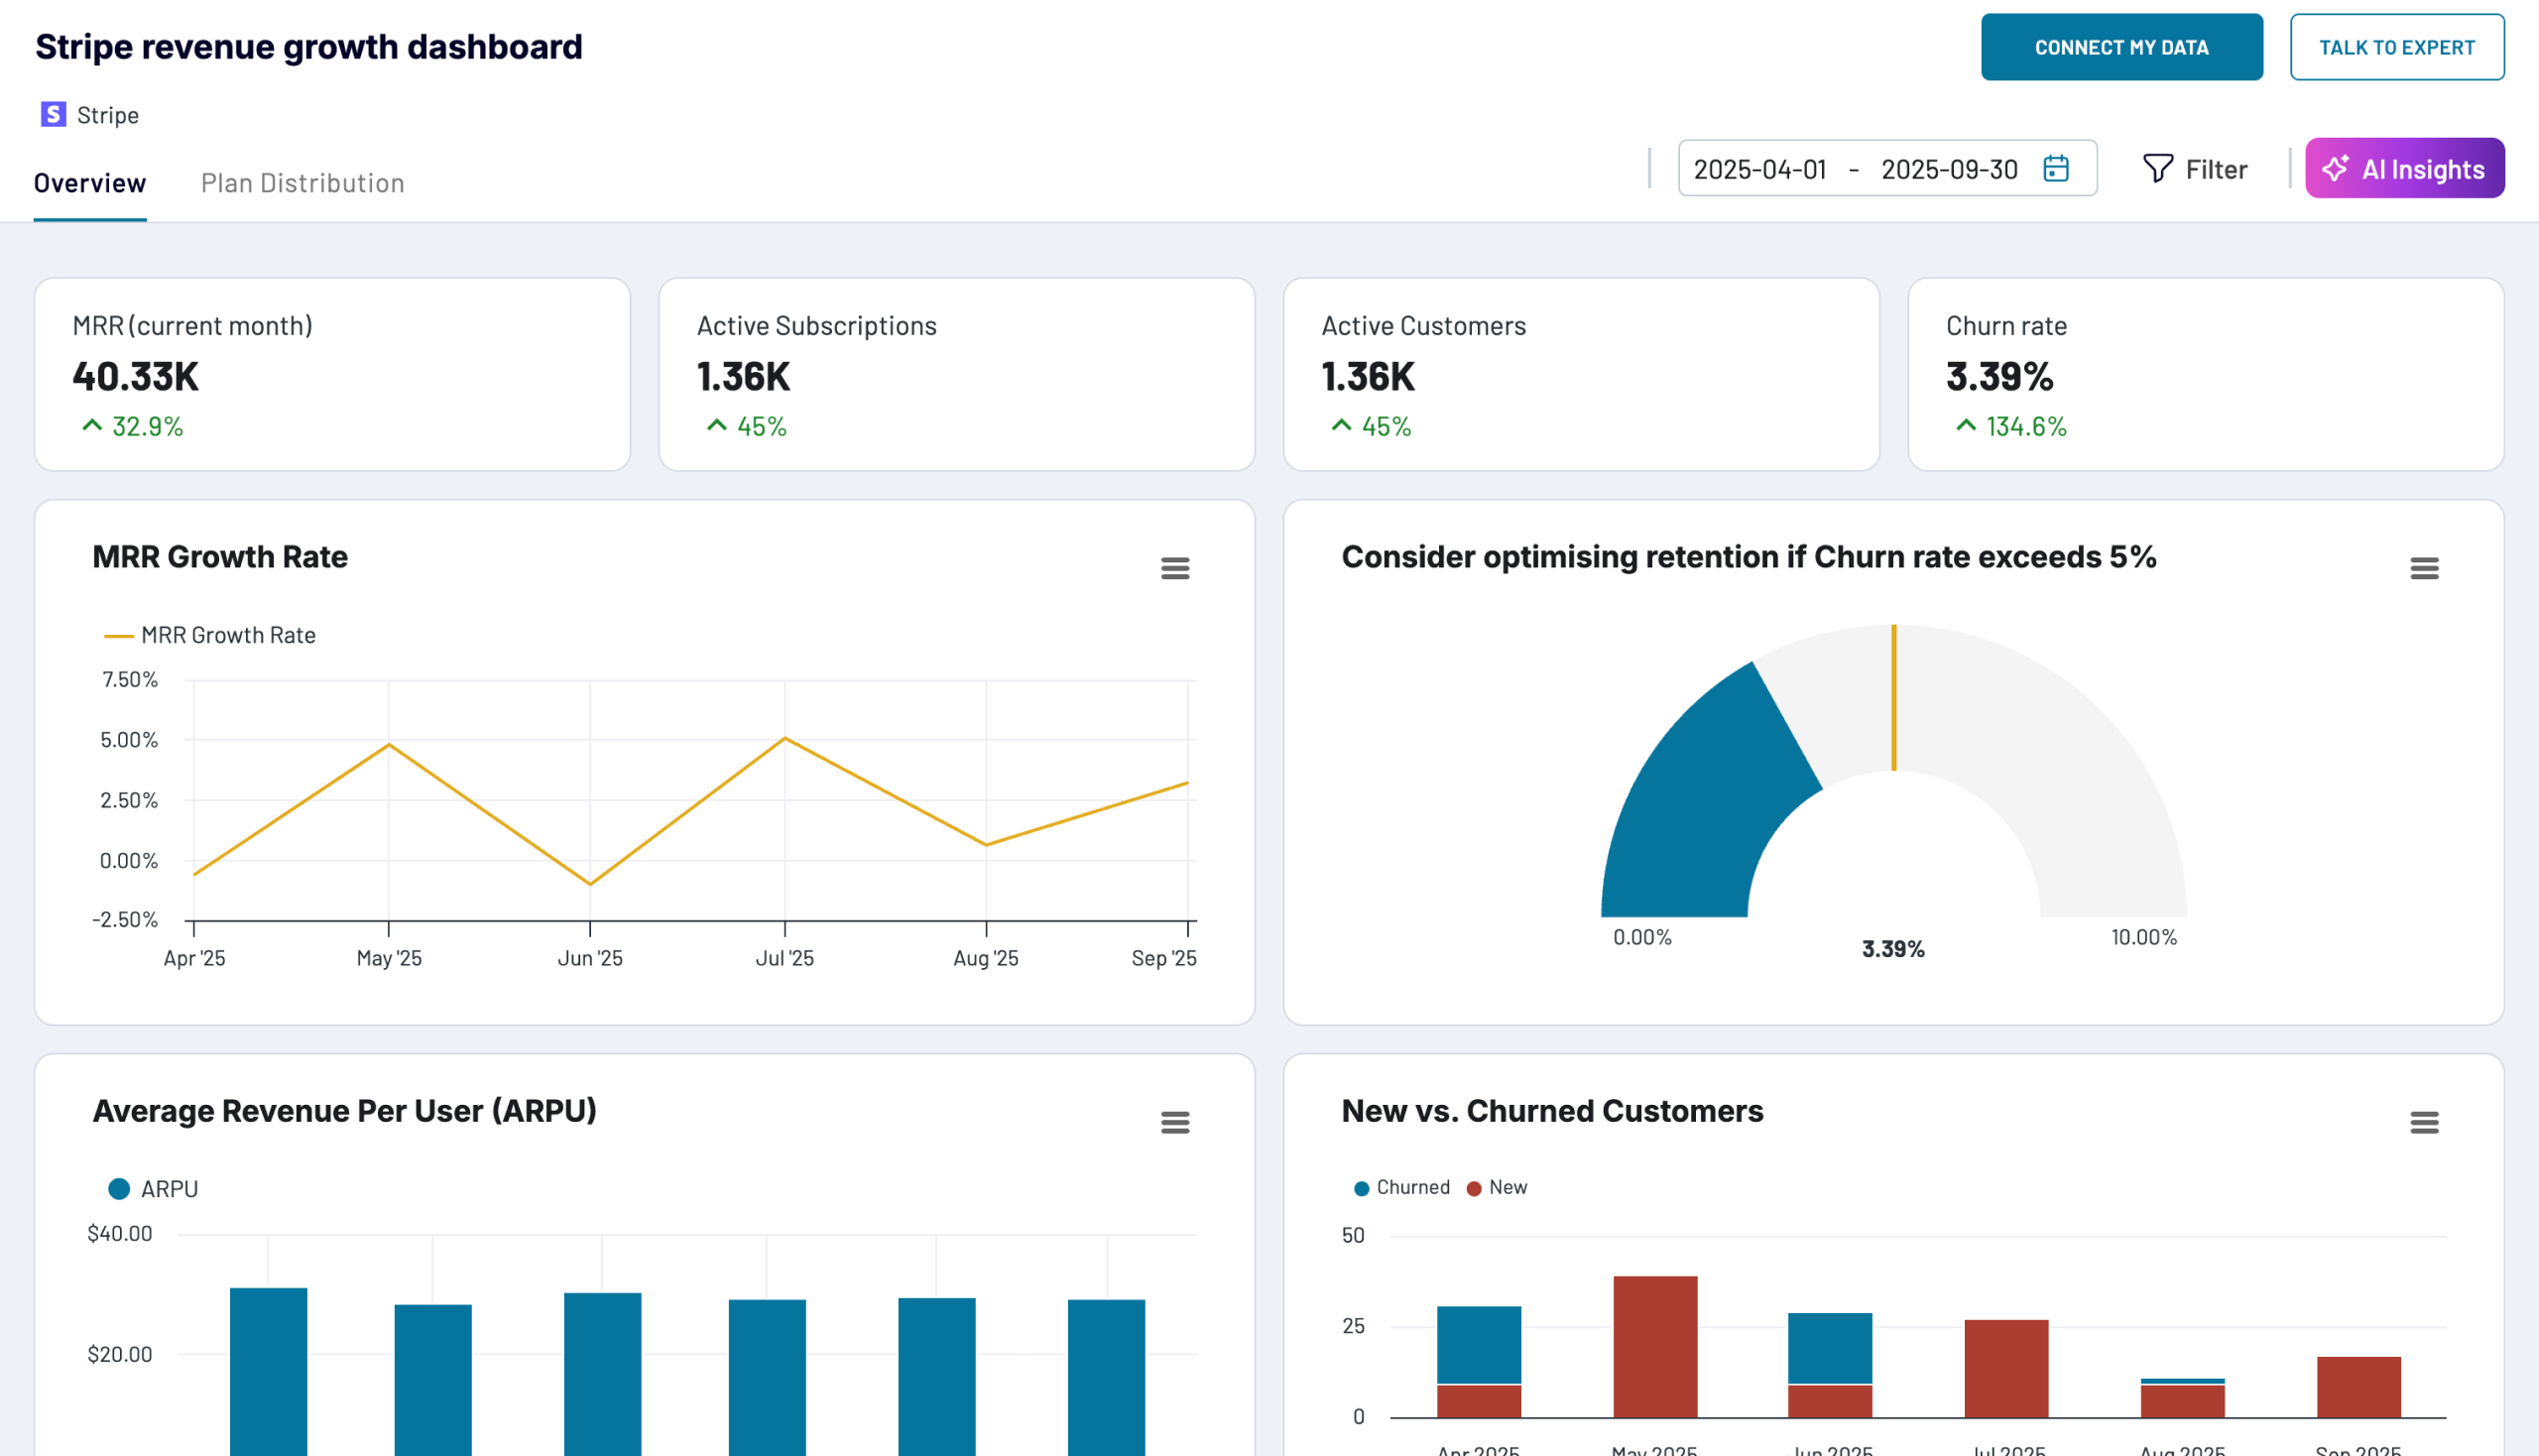
Revenue dashboards
Track your company’s income streams, monitor growth trends, and analyze revenue distribution. With our financial dashboard templates, you can understand where your income is coming from and identify opportunities to increase profitability. Evaluate performance and make informed decisions to drive revenue growth.
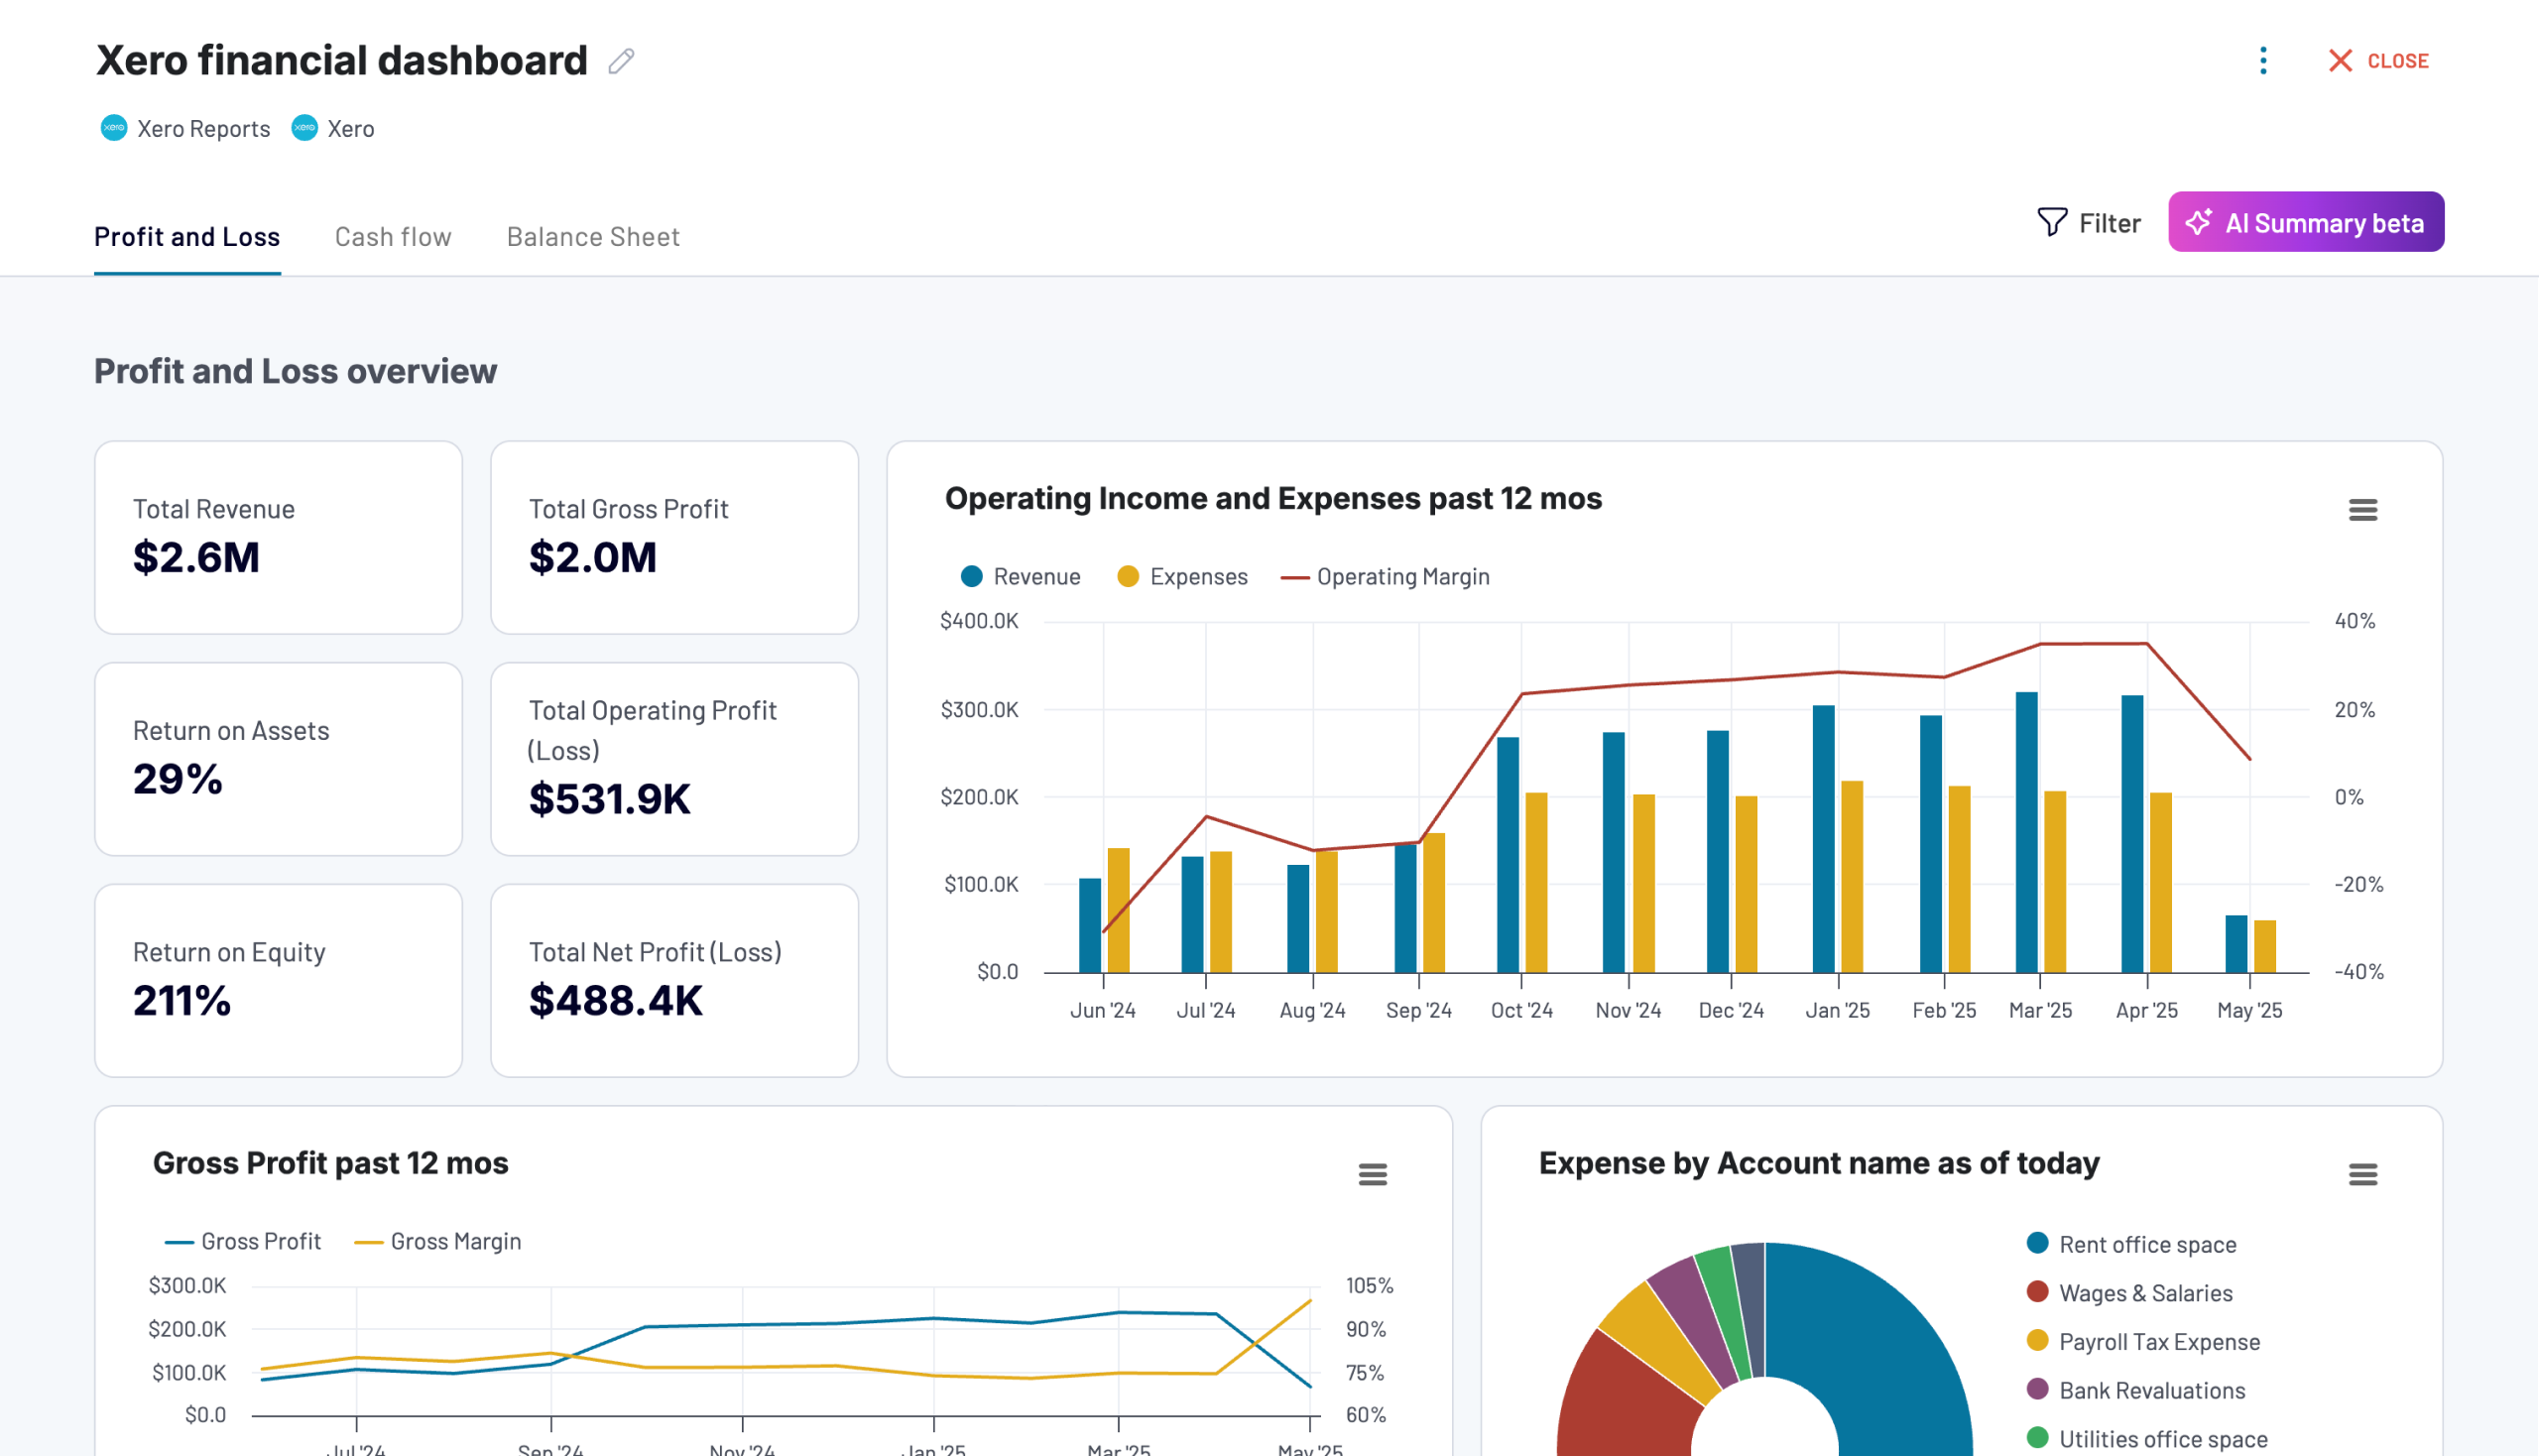
Balance Sheet dashboards
Track your company's assets, liabilities, and equity with our comprehensive balance sheet dashboards. These templates provide a clear snapshot of your financial position, so you can maintain healthy financial relationships. Use visualized insights to understand your company's net worth and make strategic decisions about resource allocation.
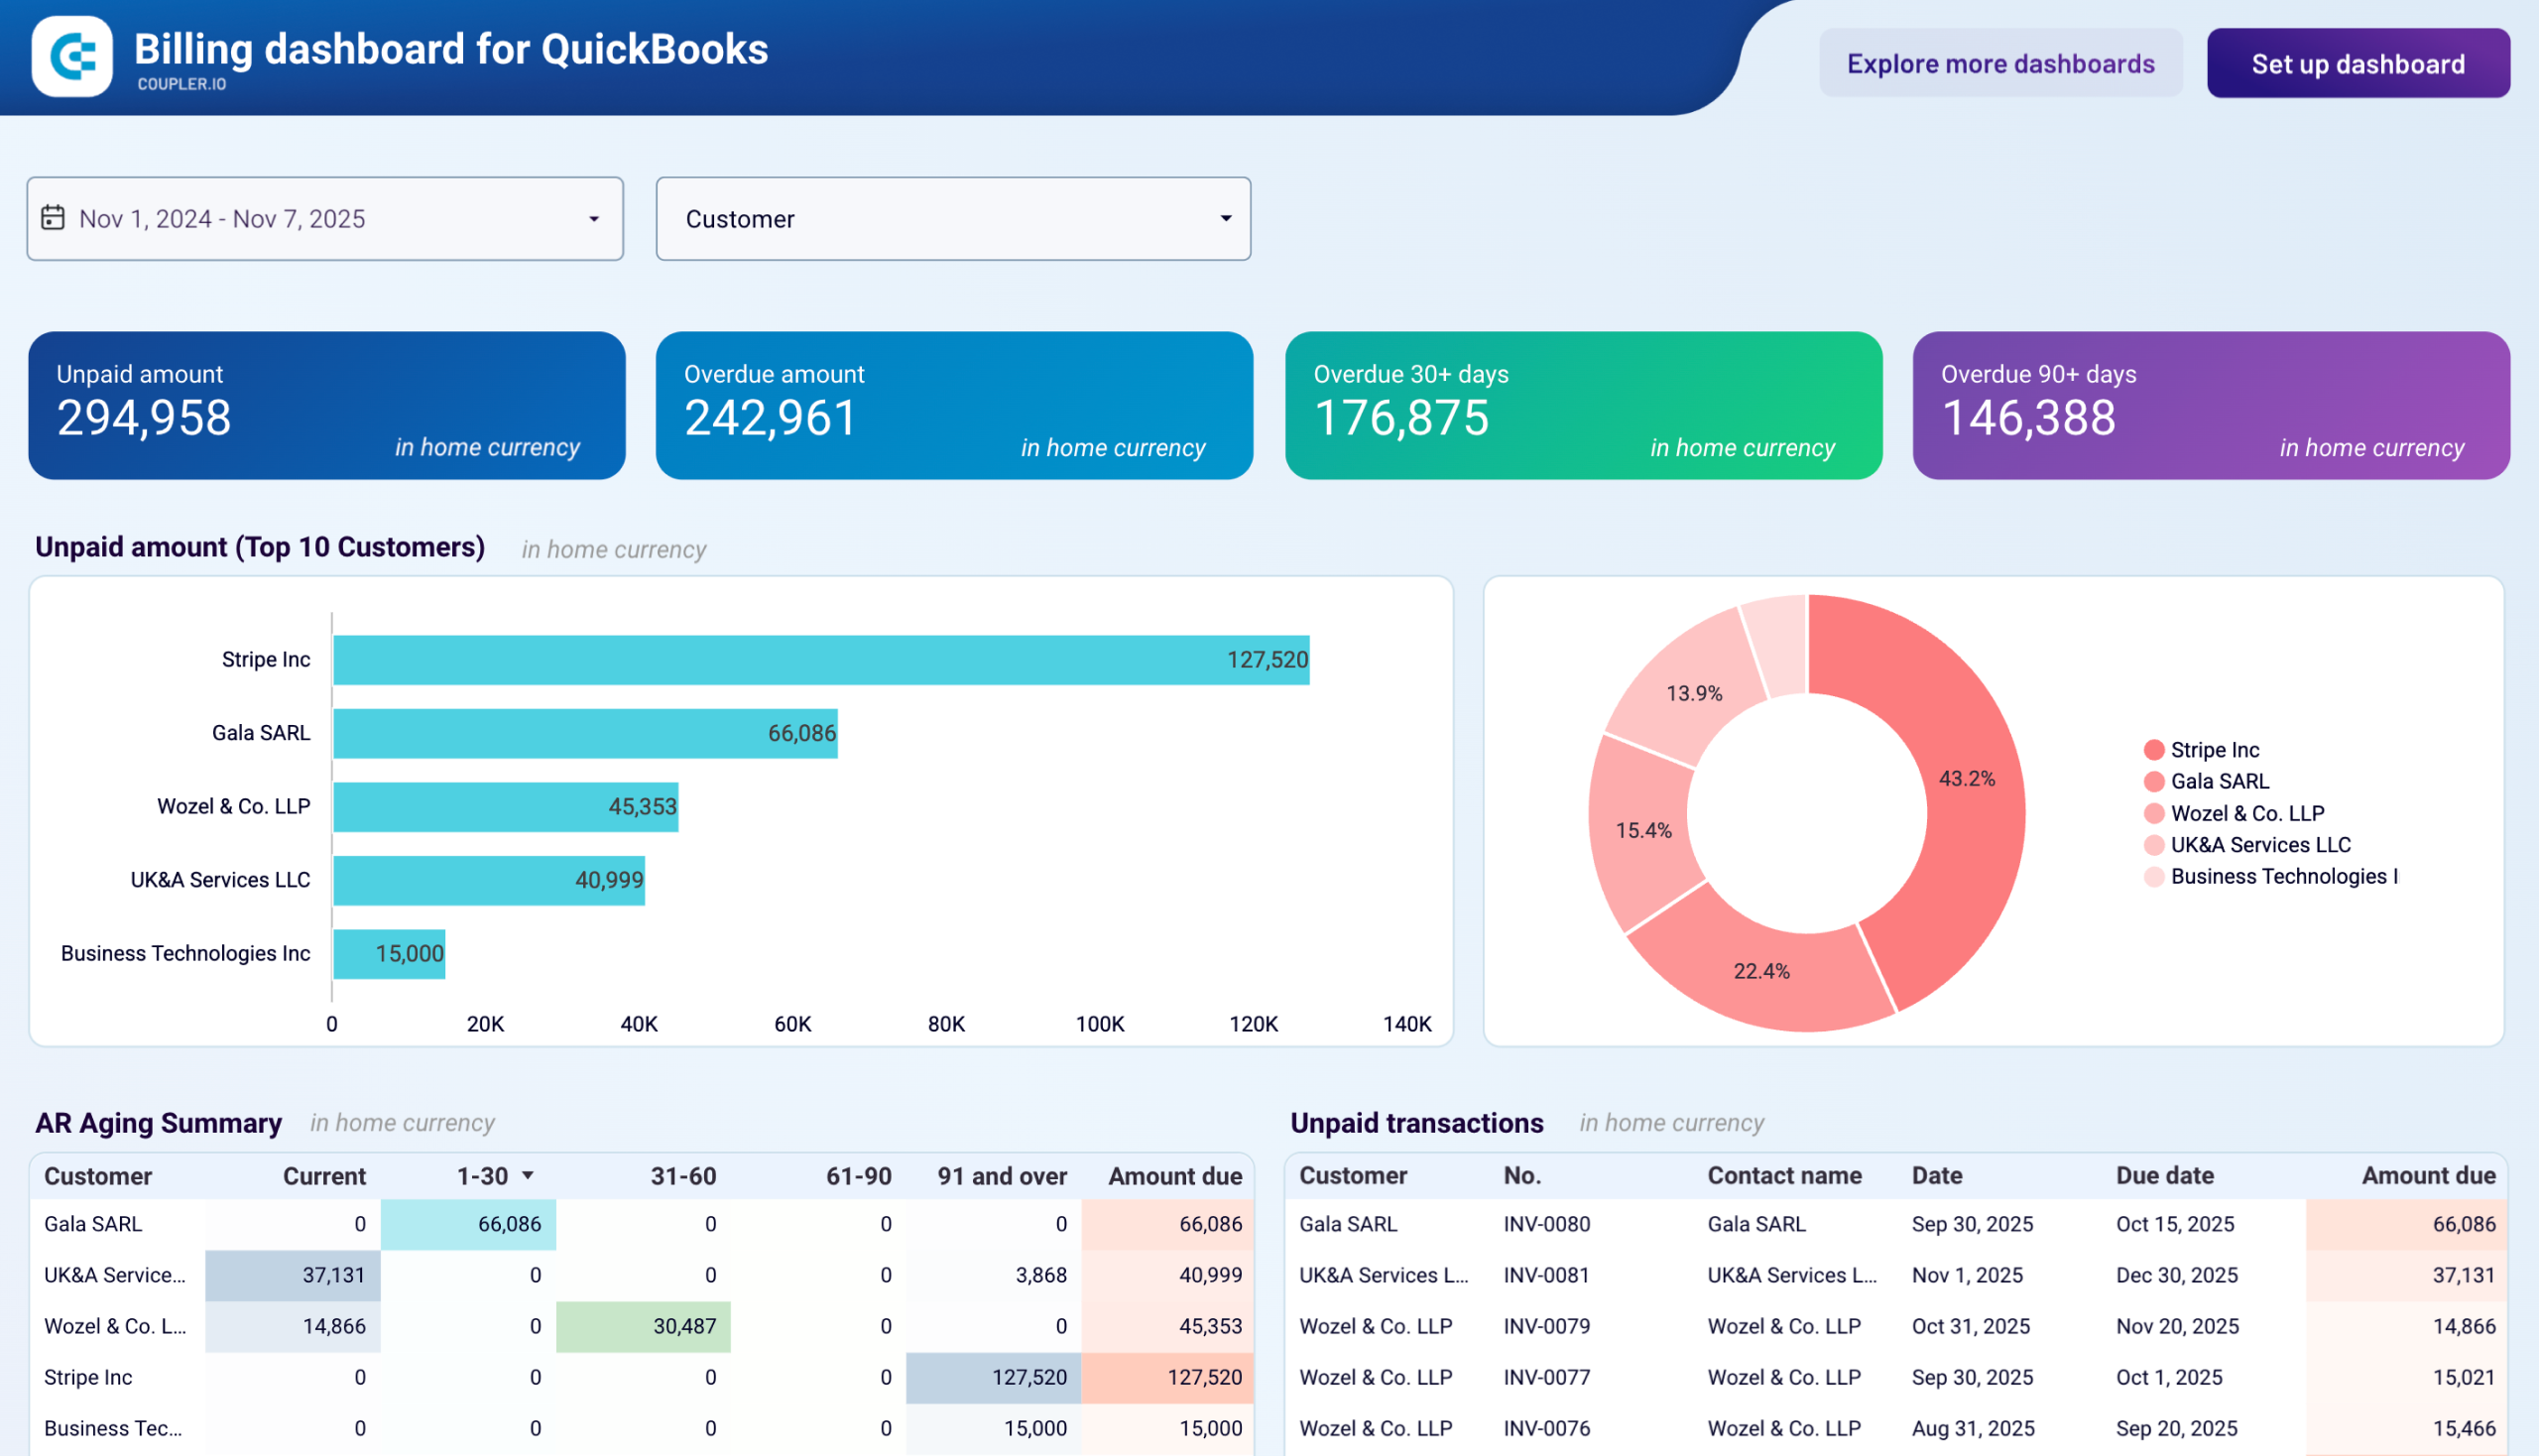
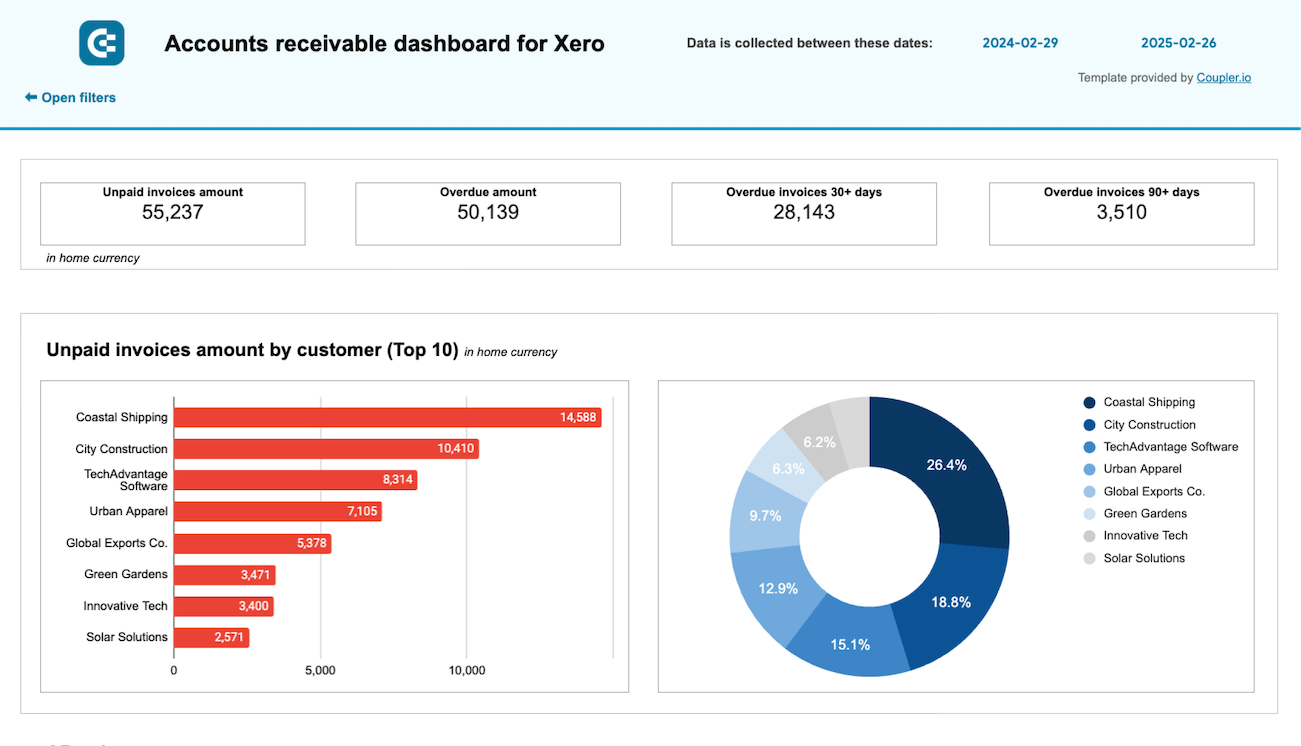
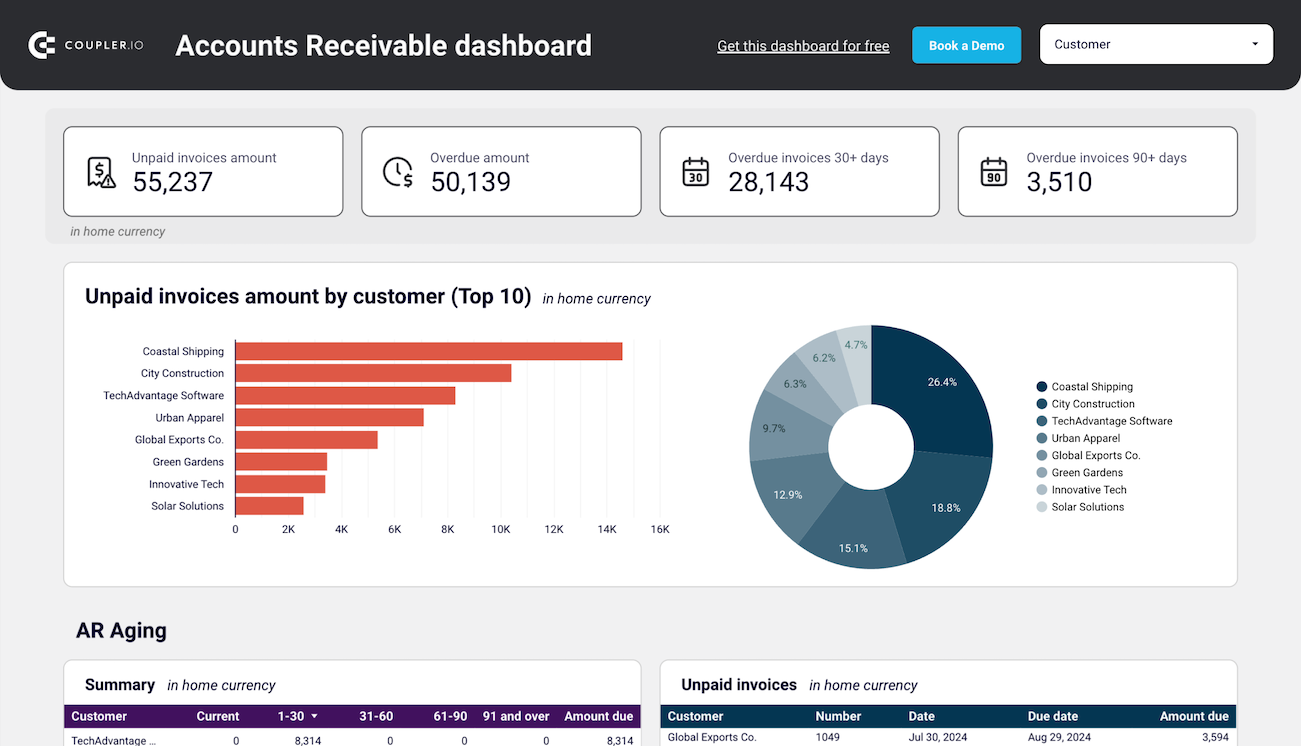
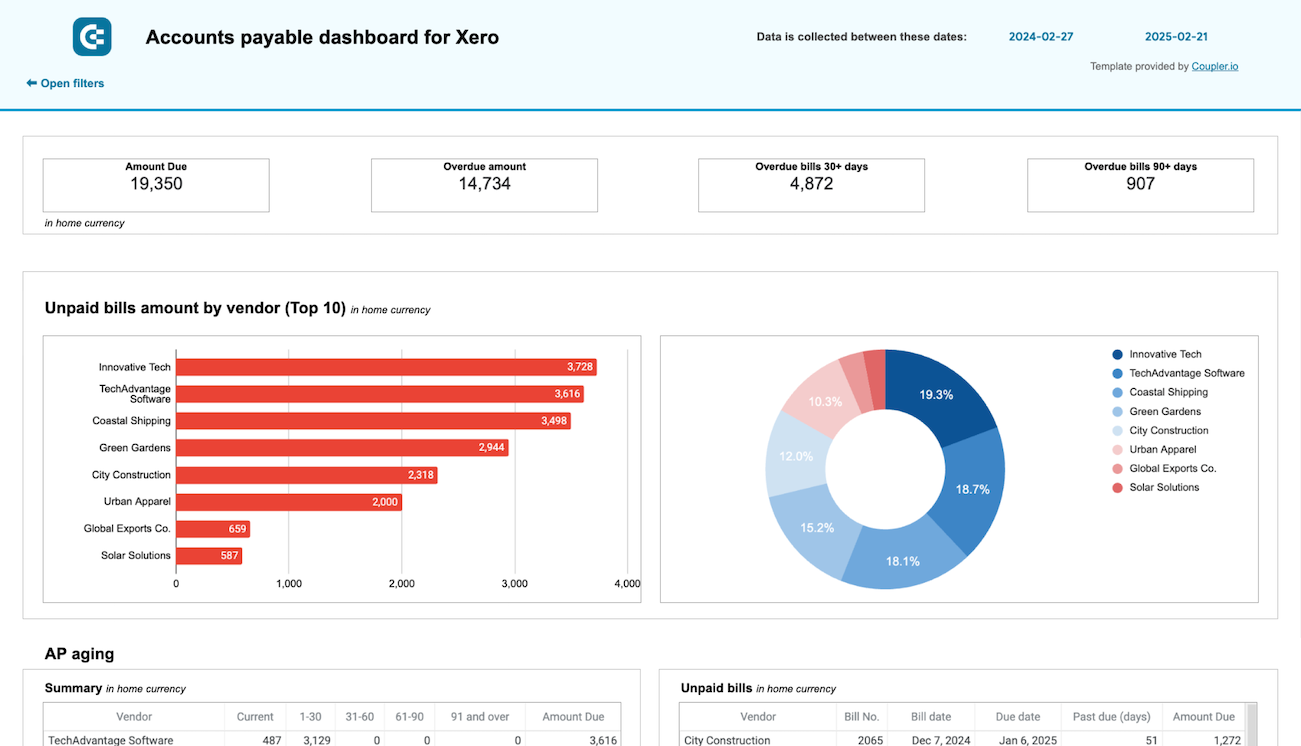
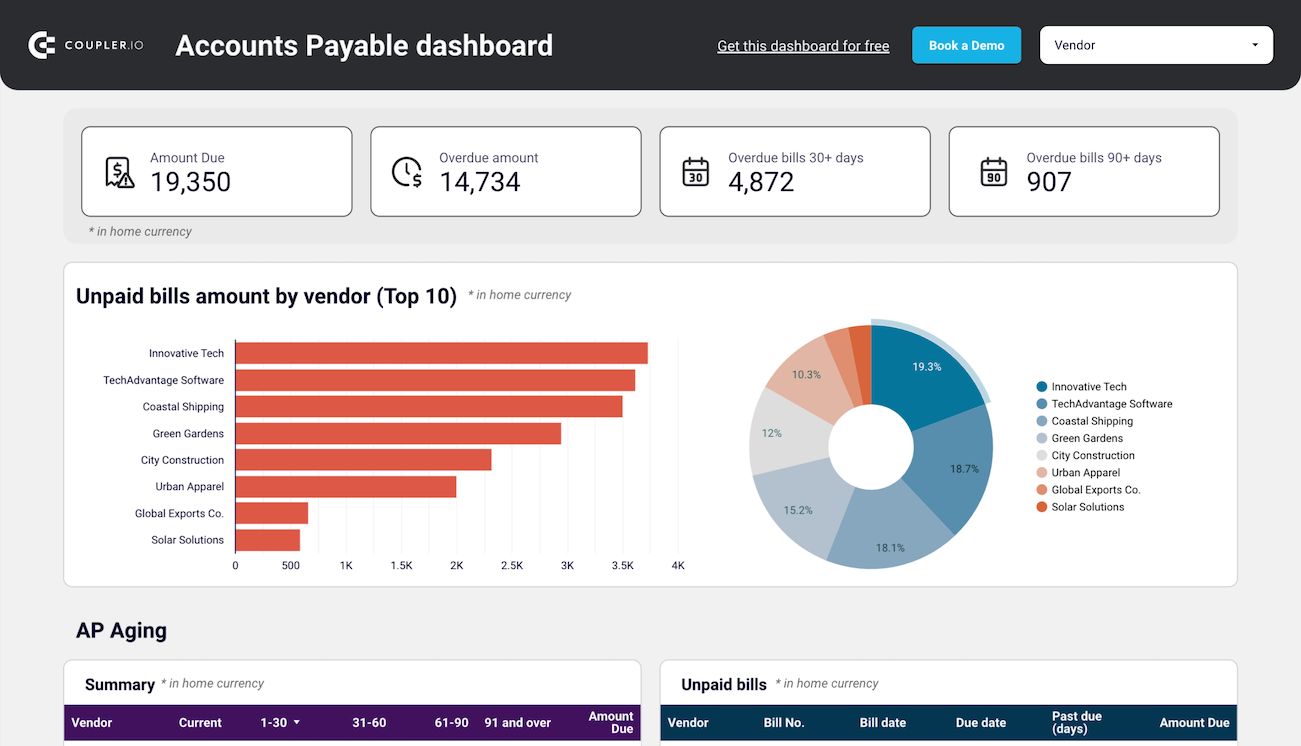
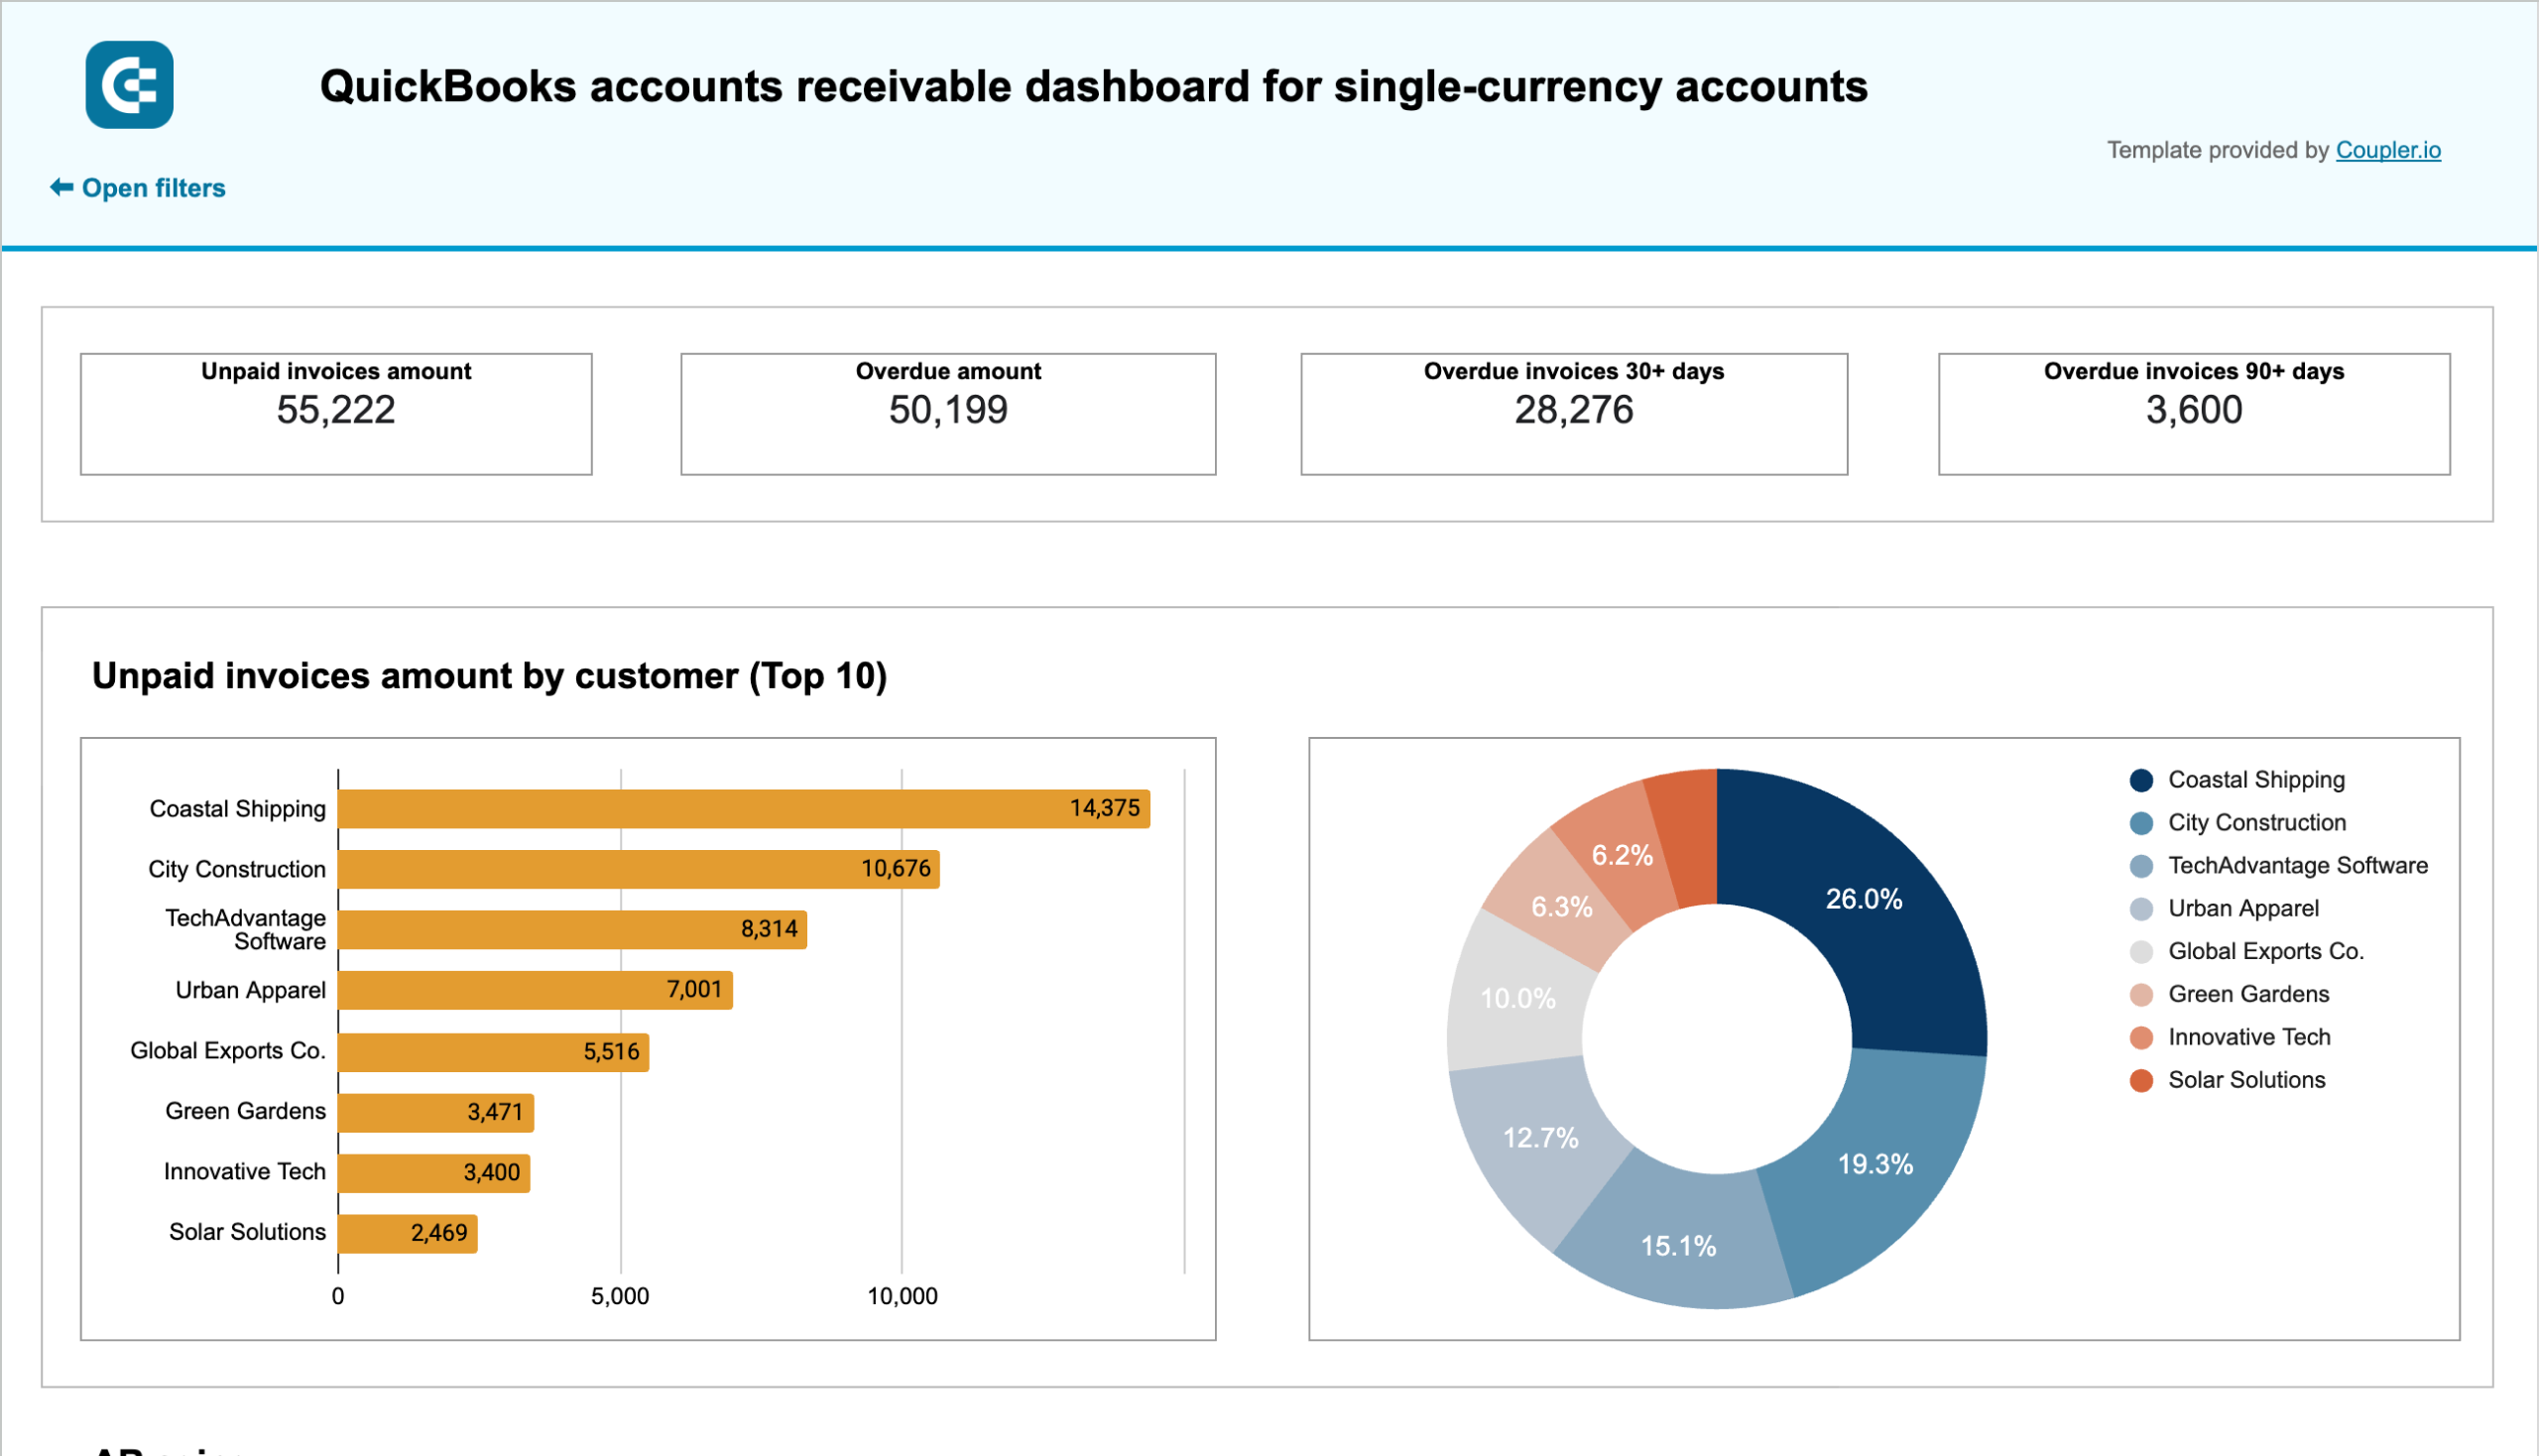
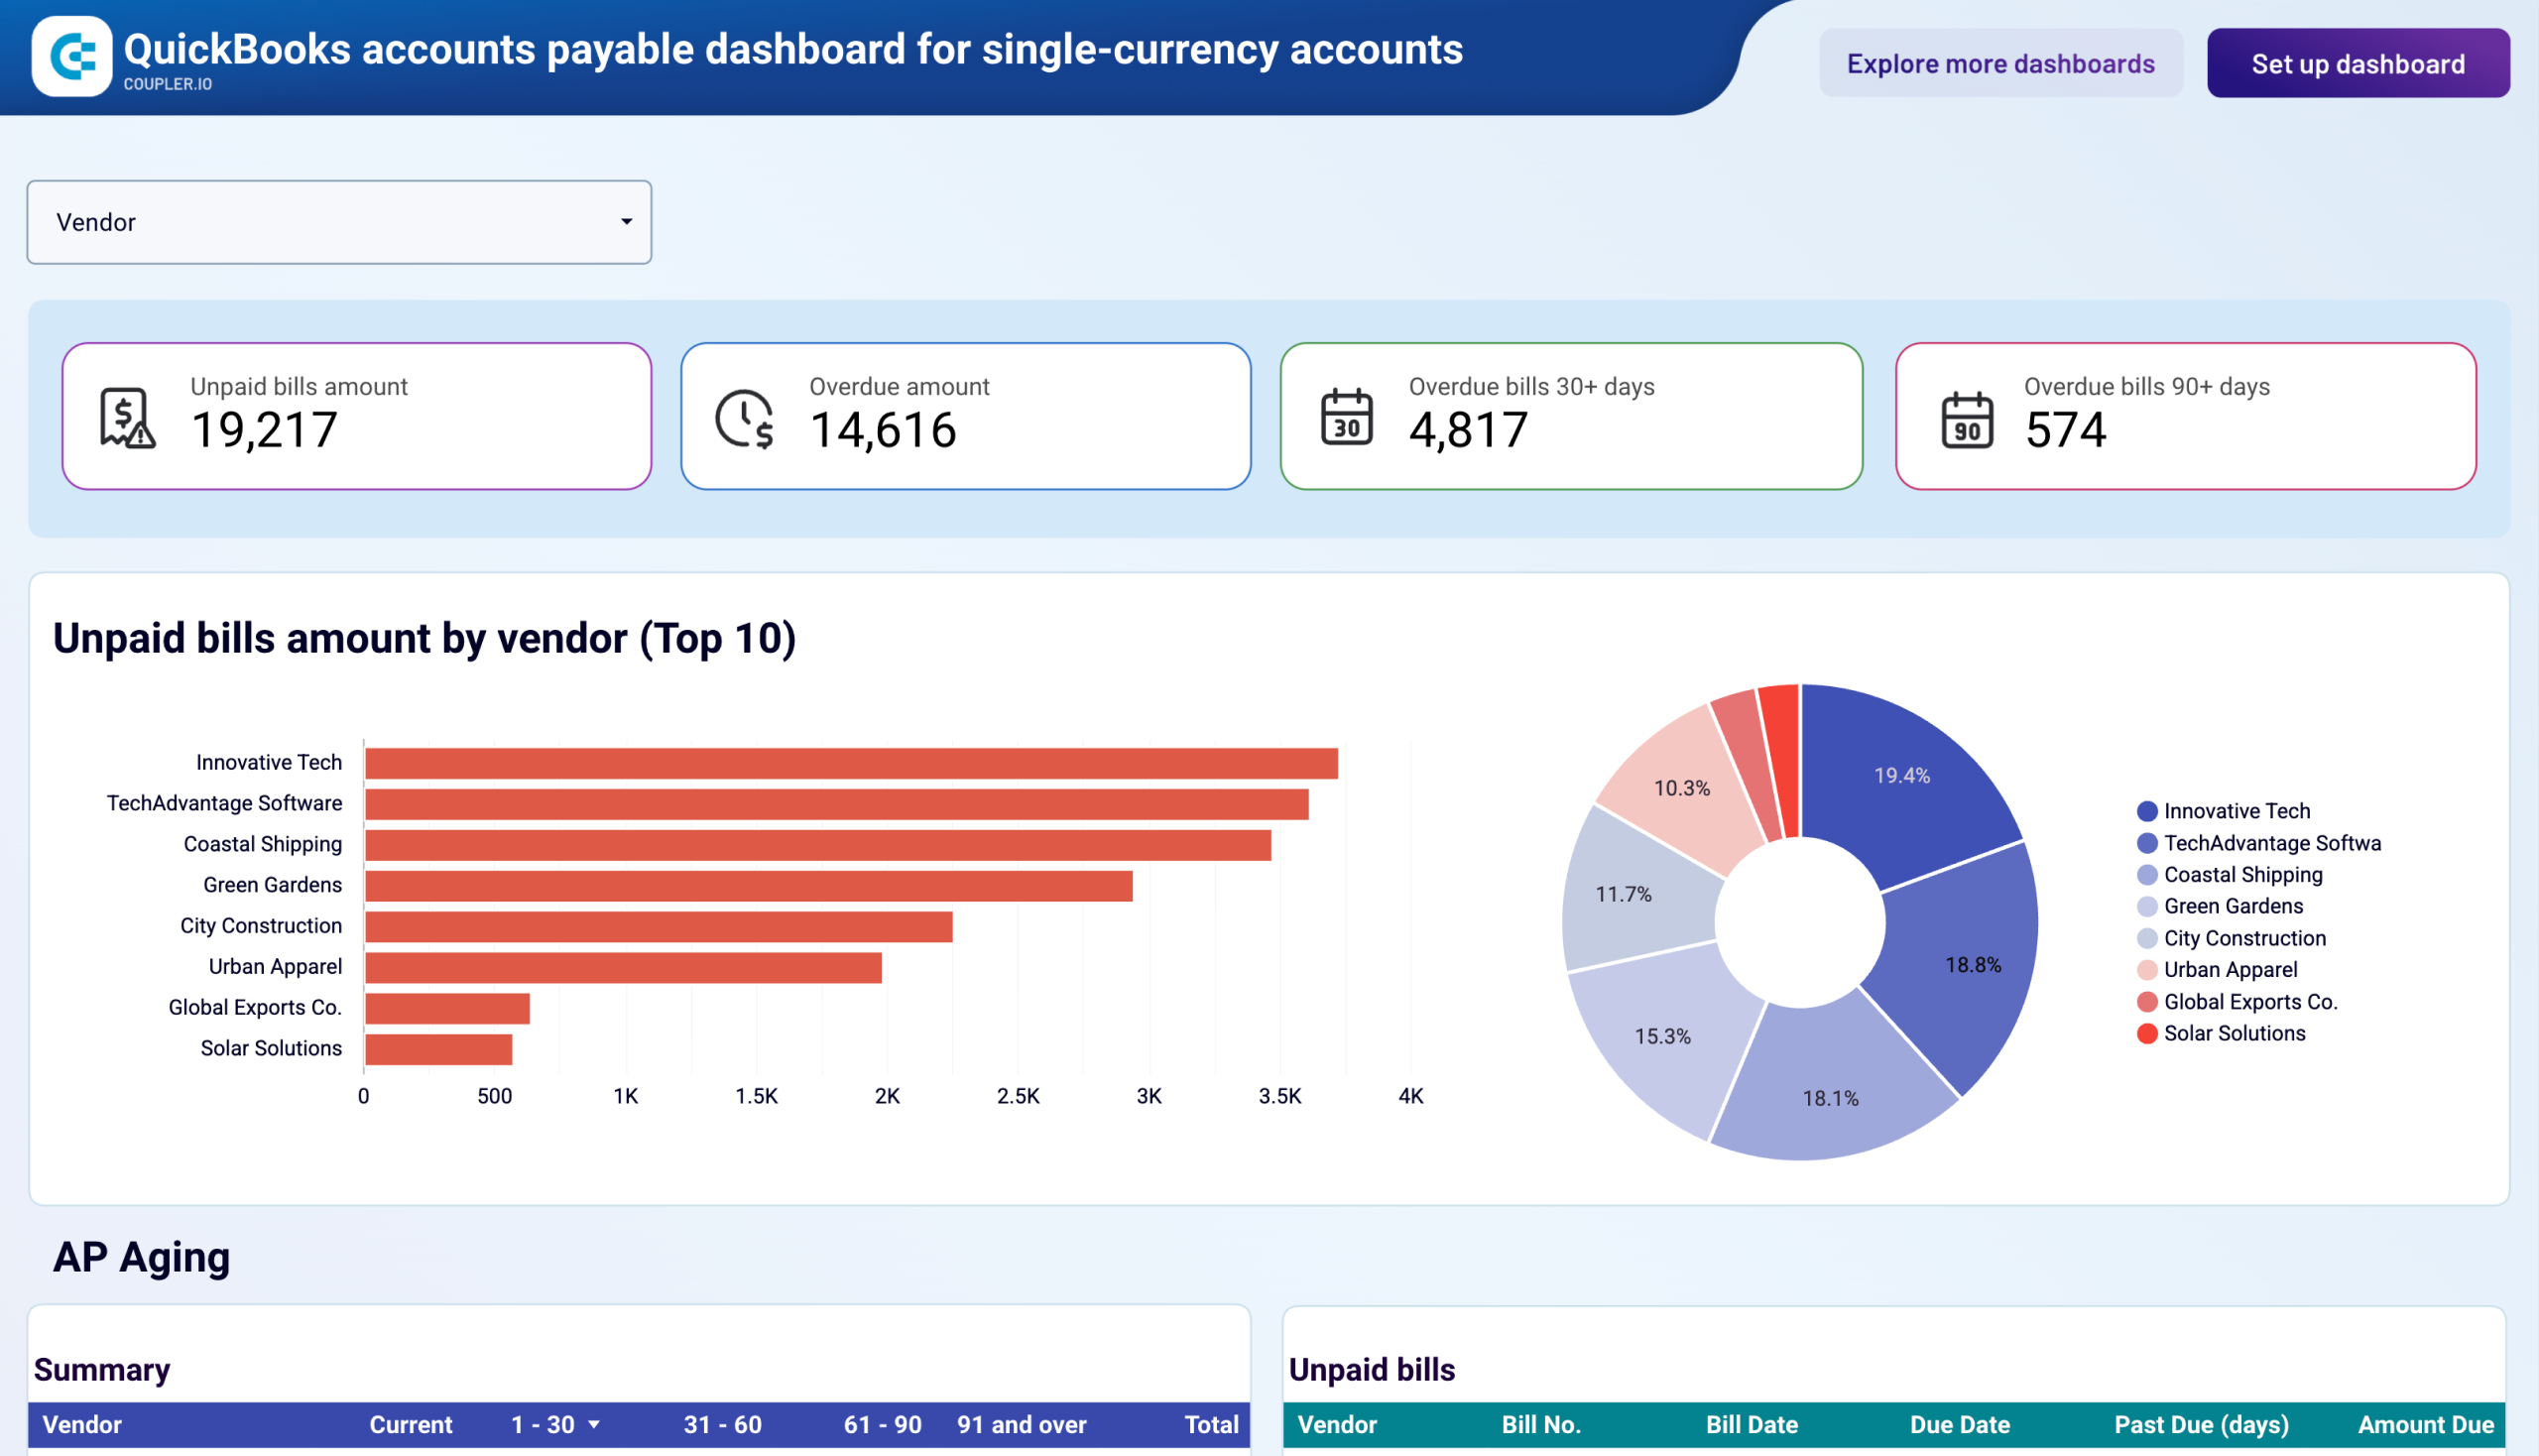
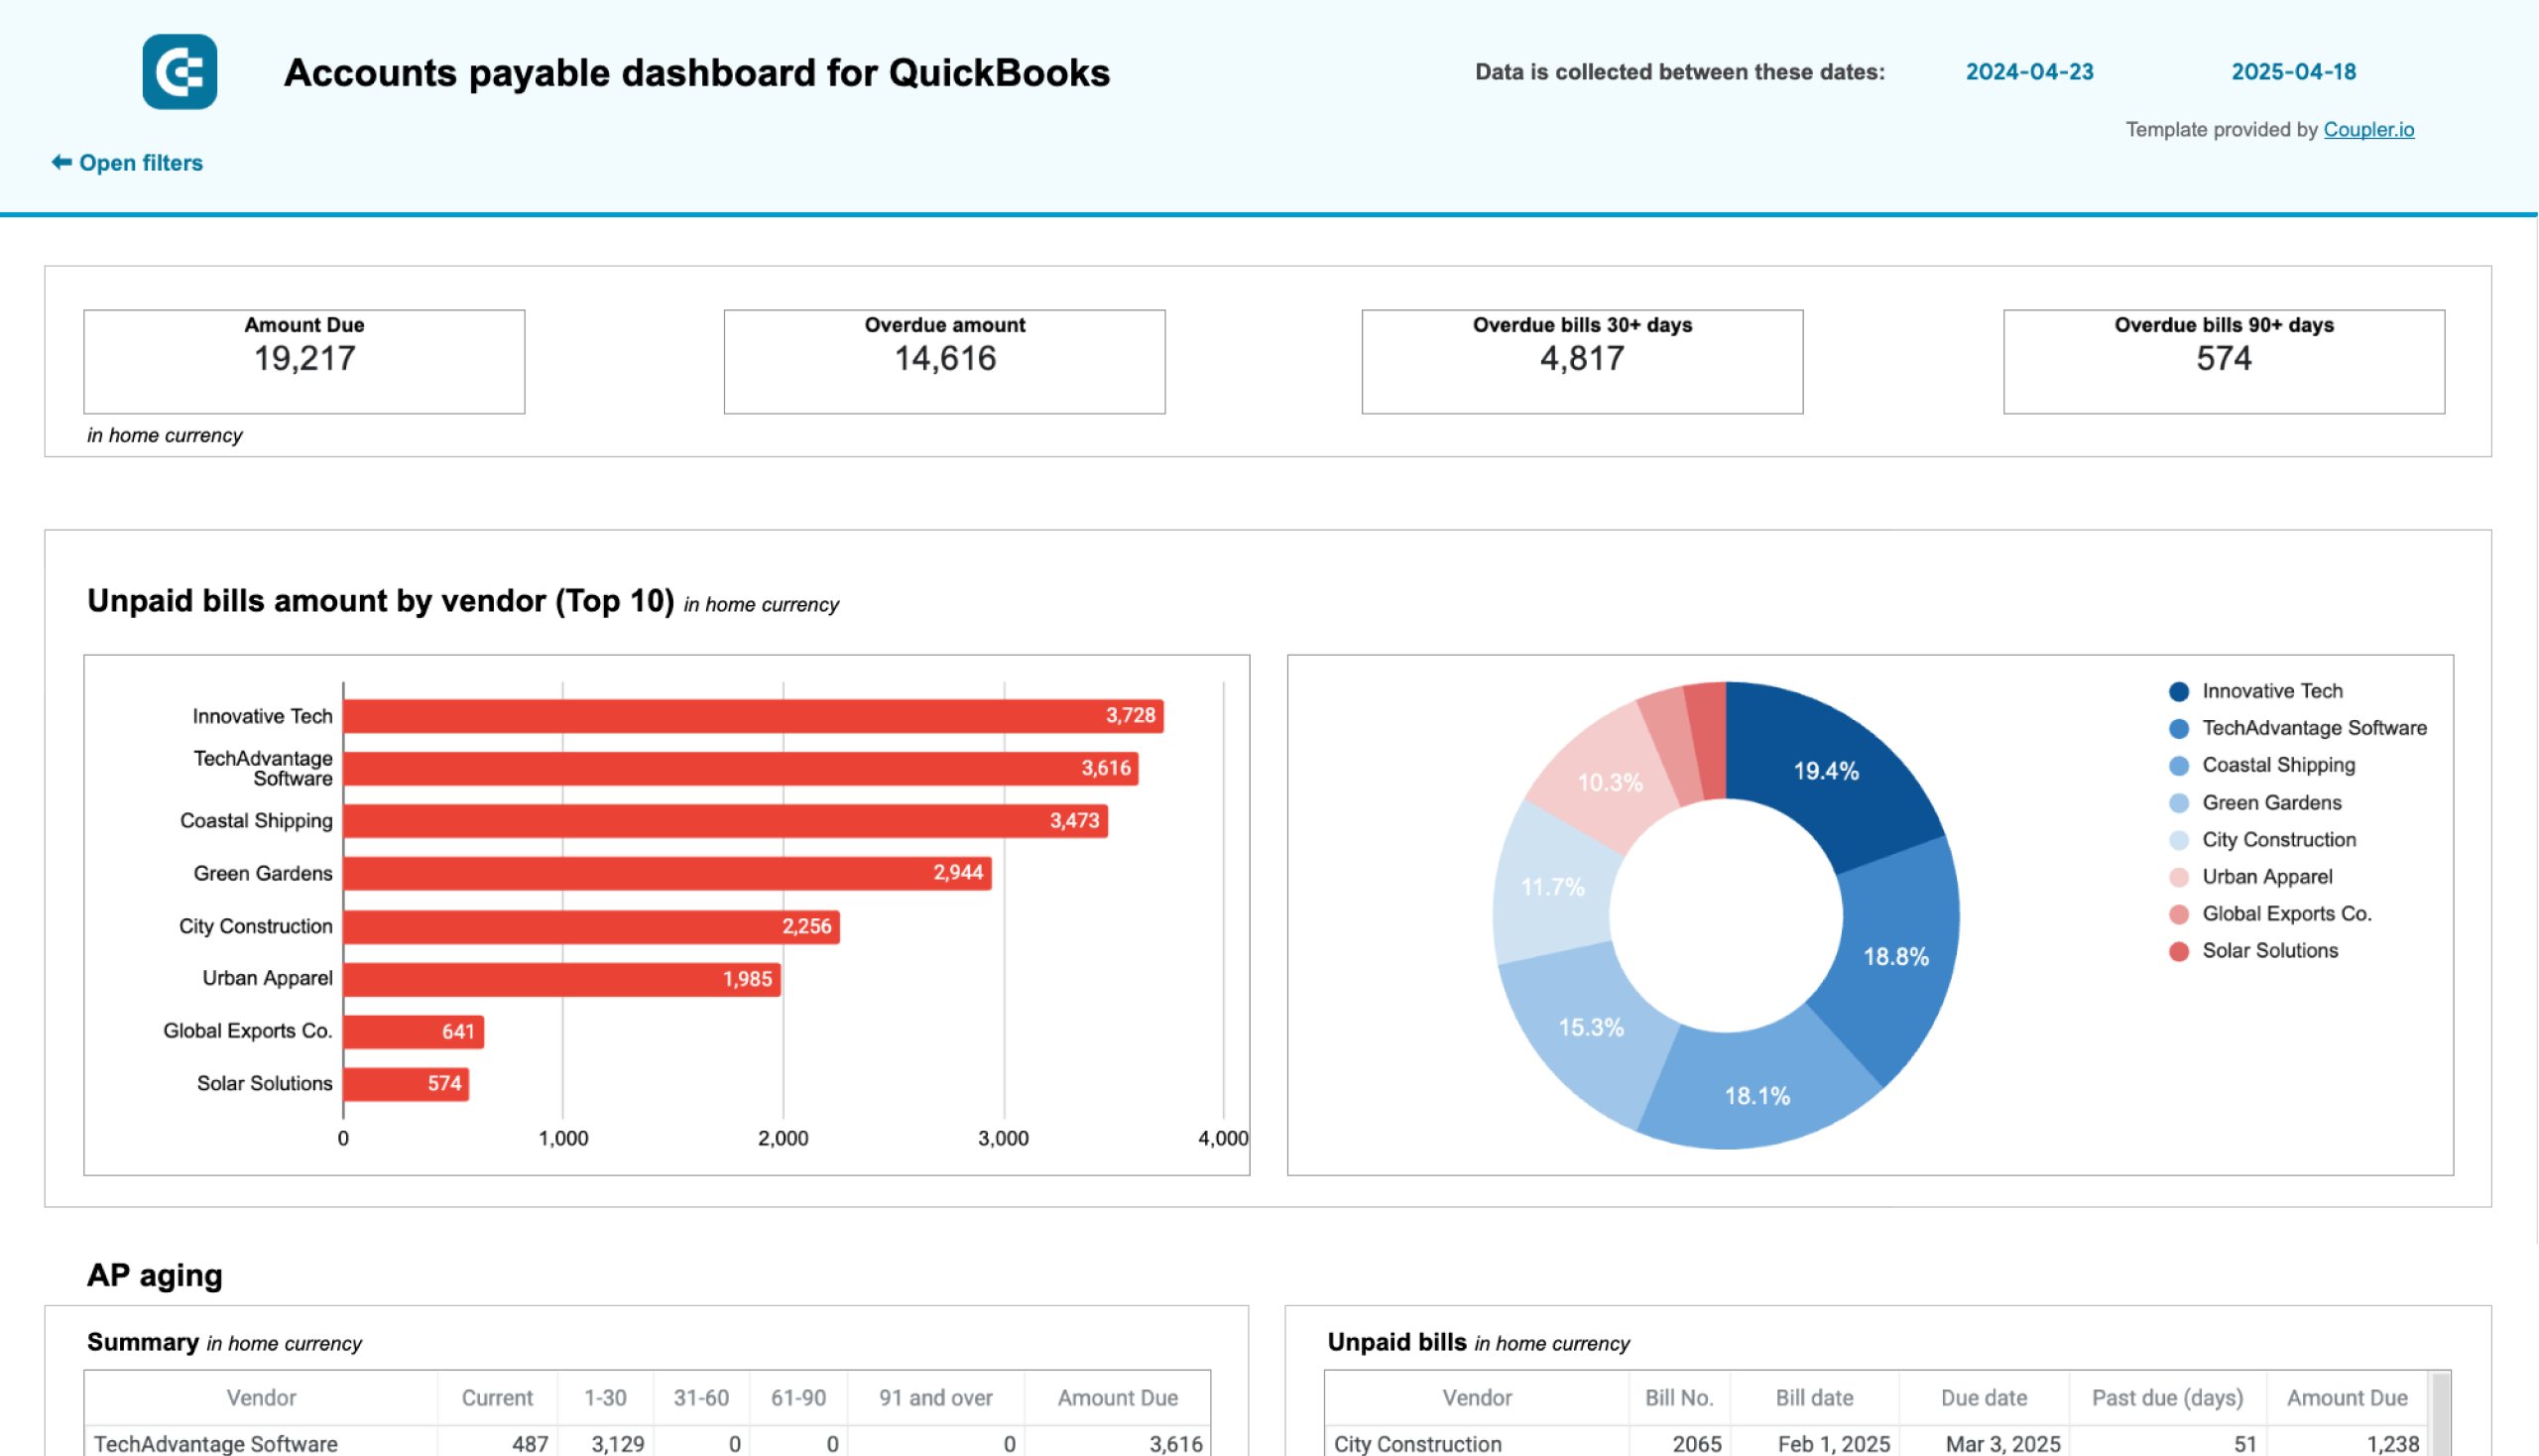
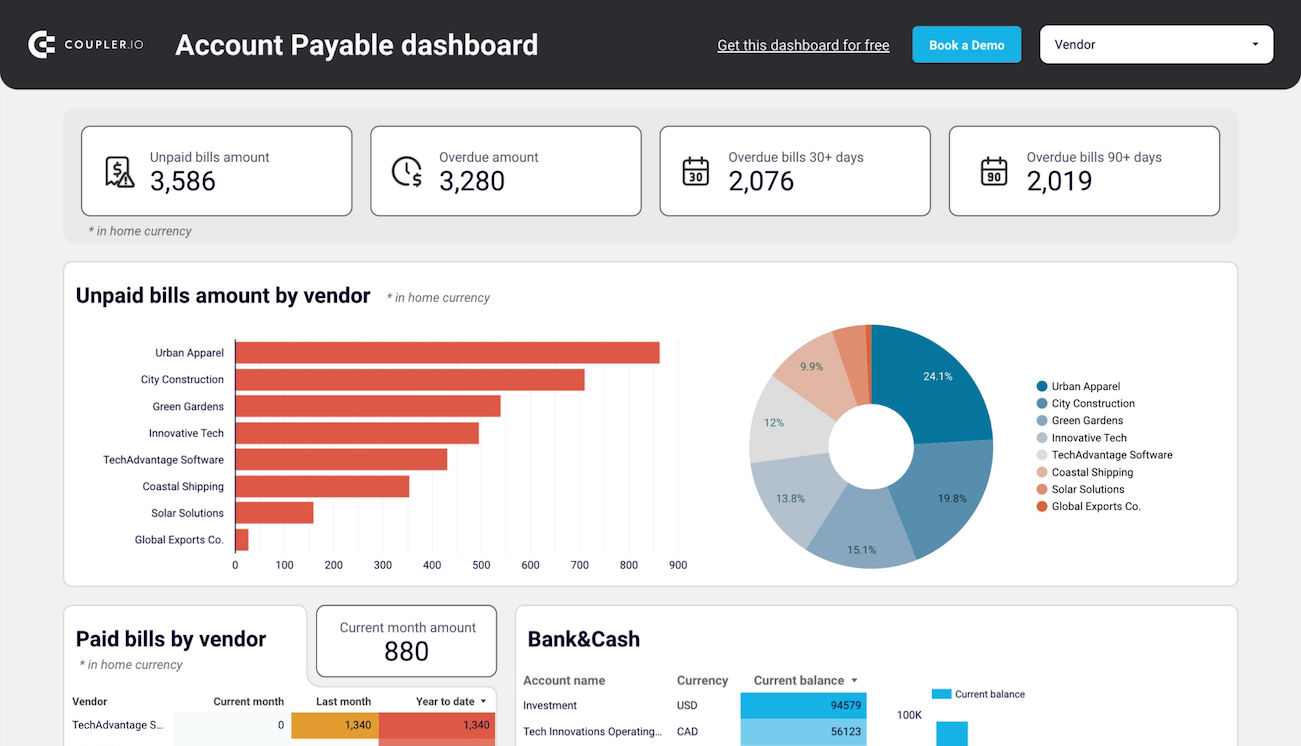
Accounting dashboards
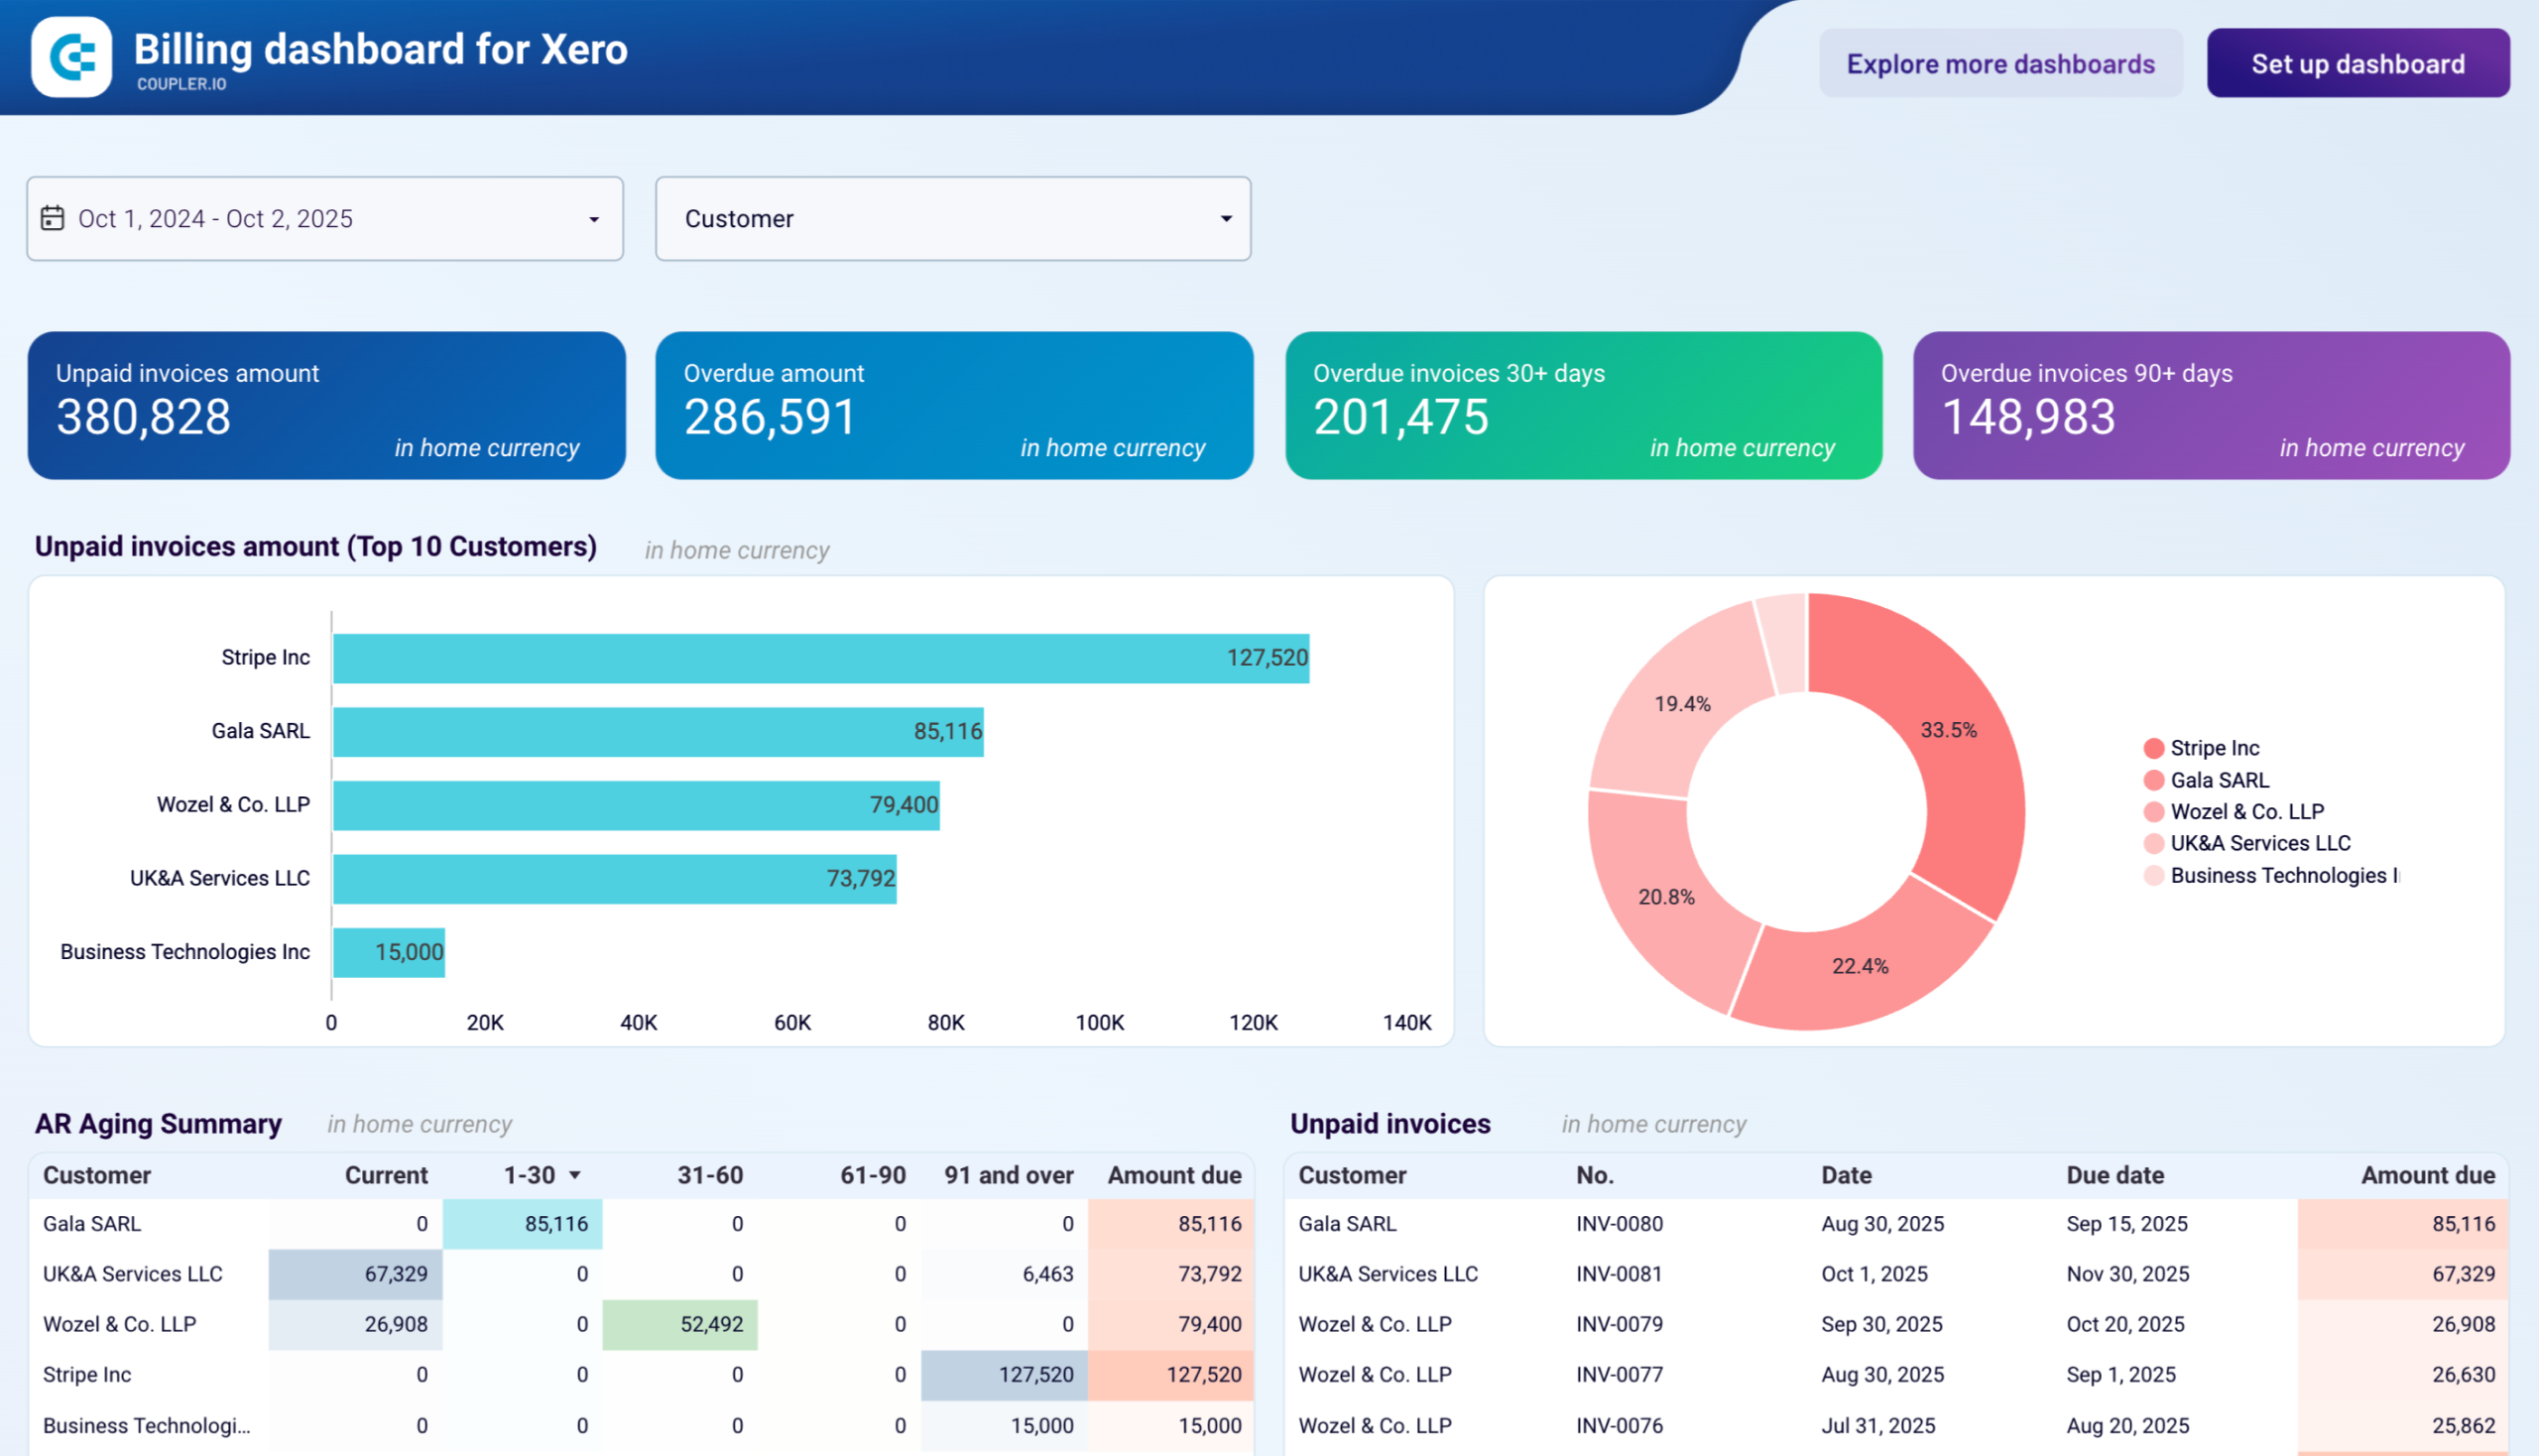
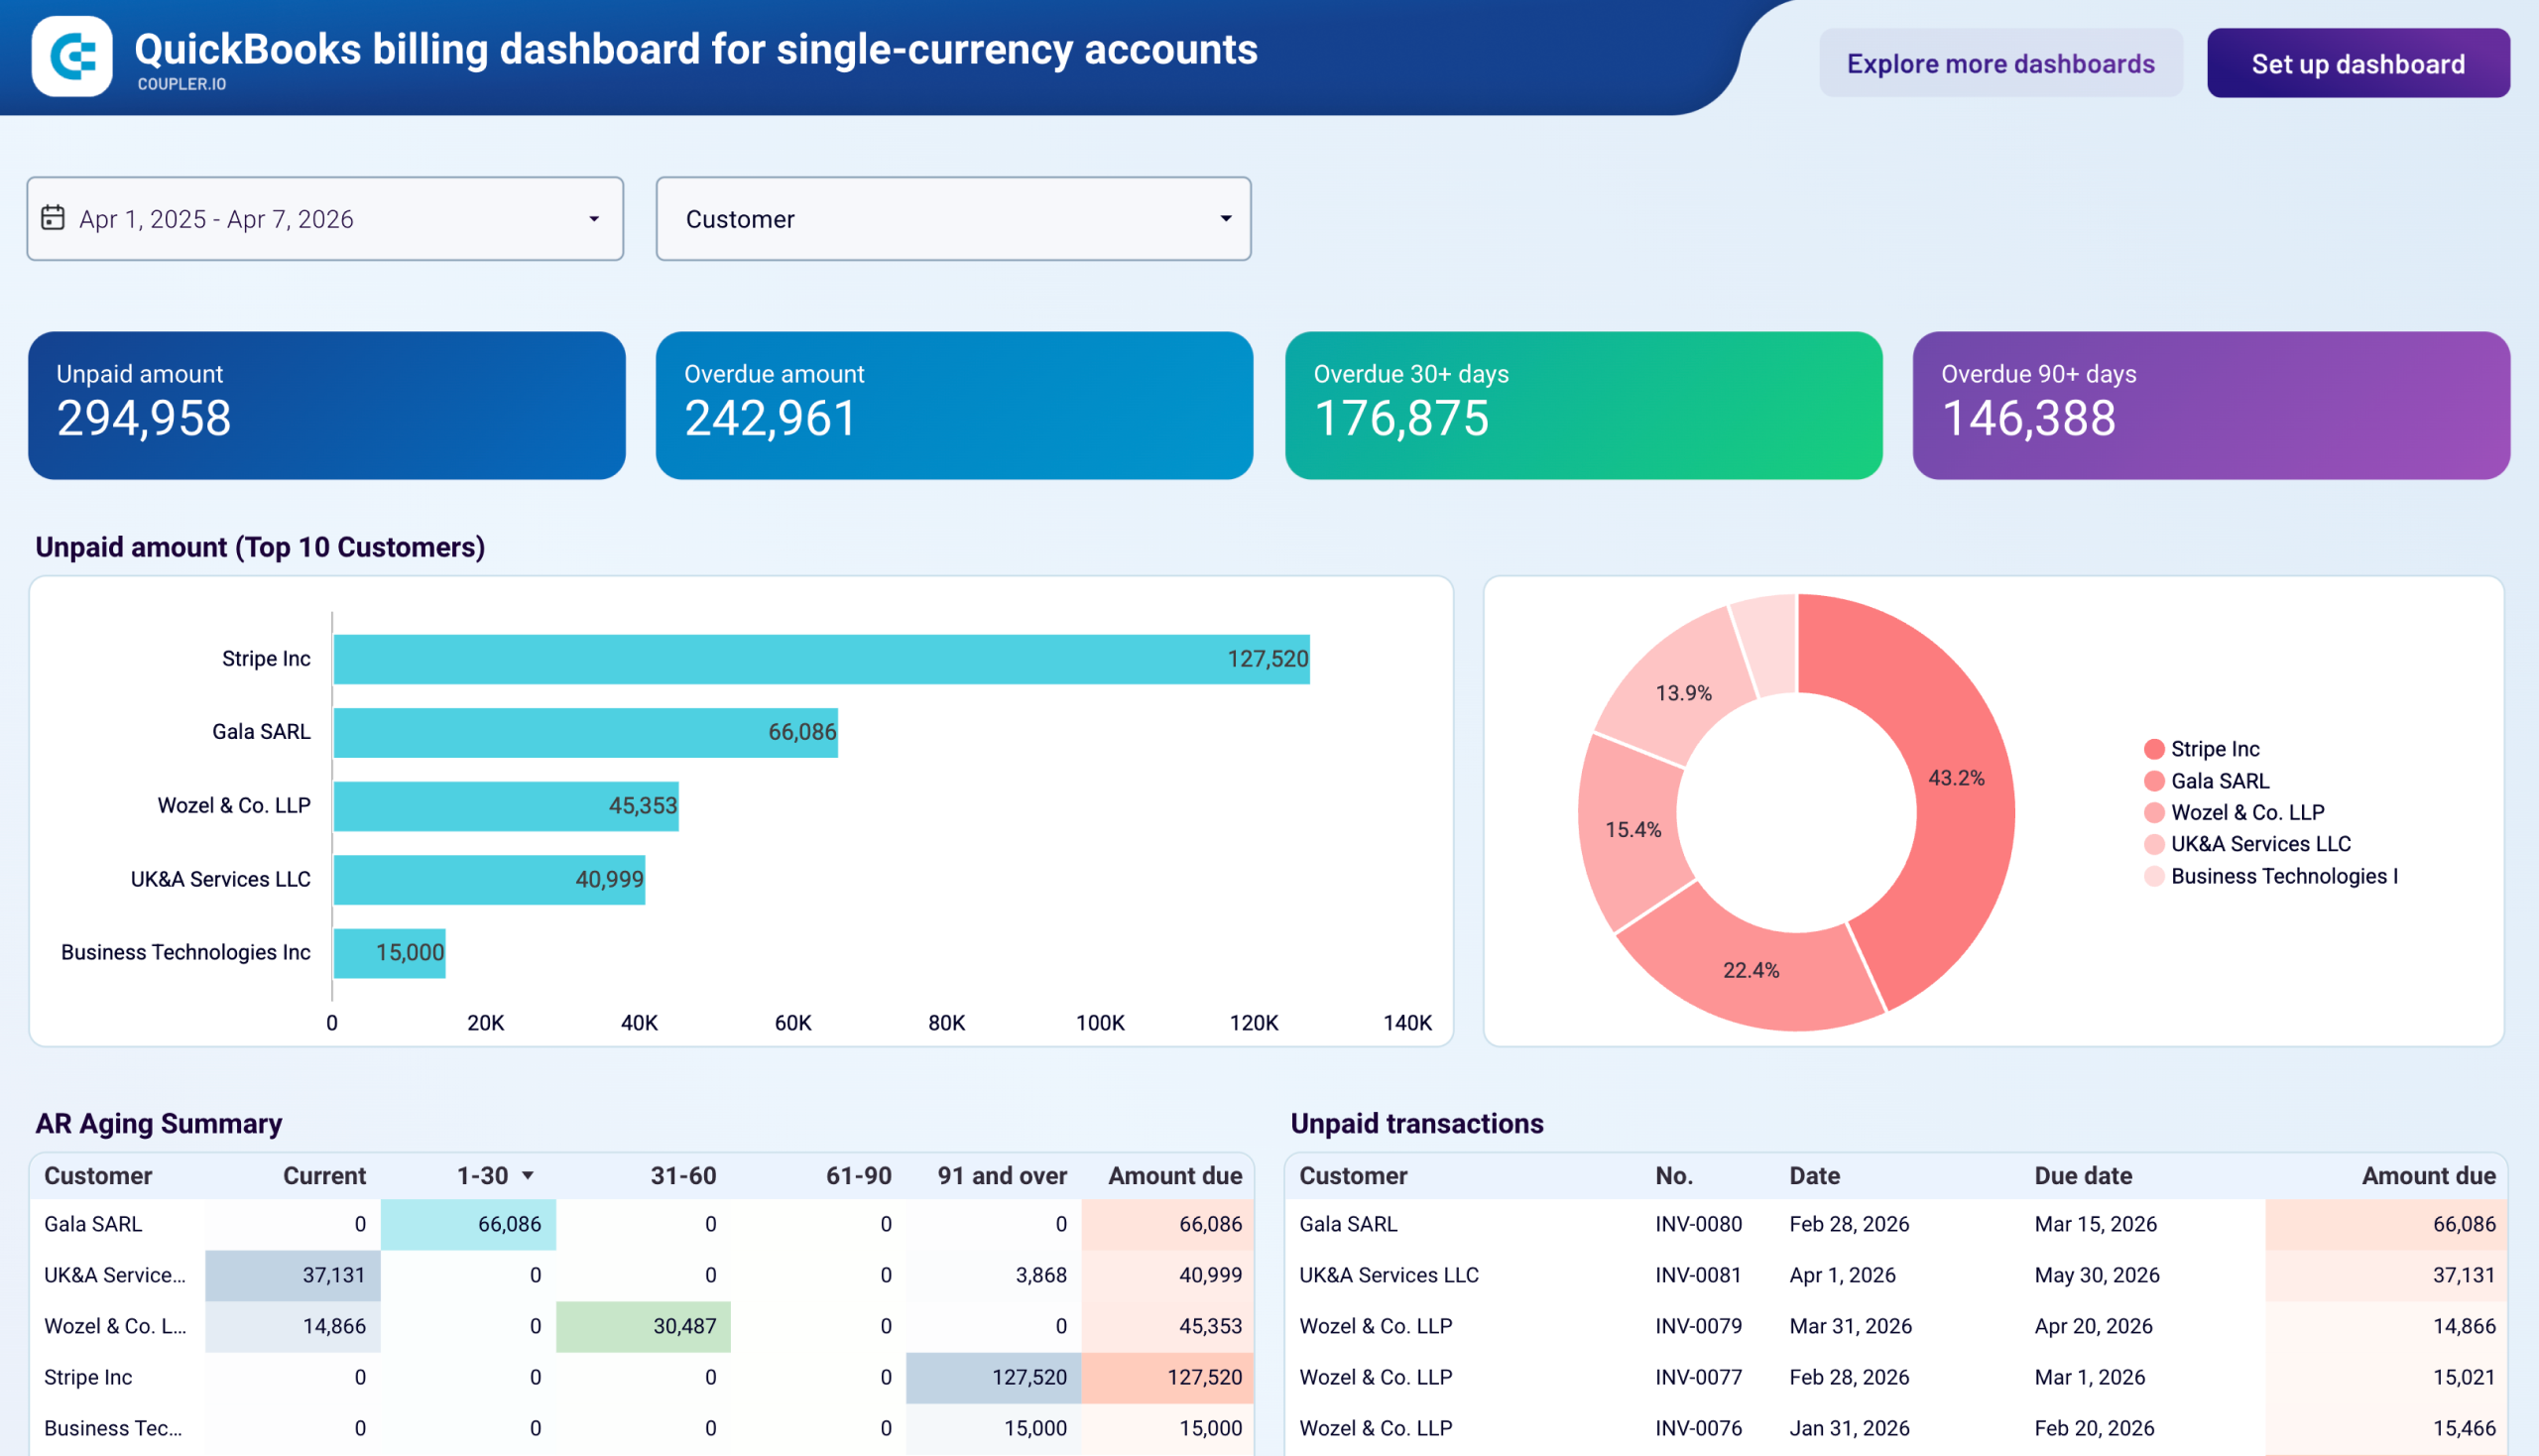
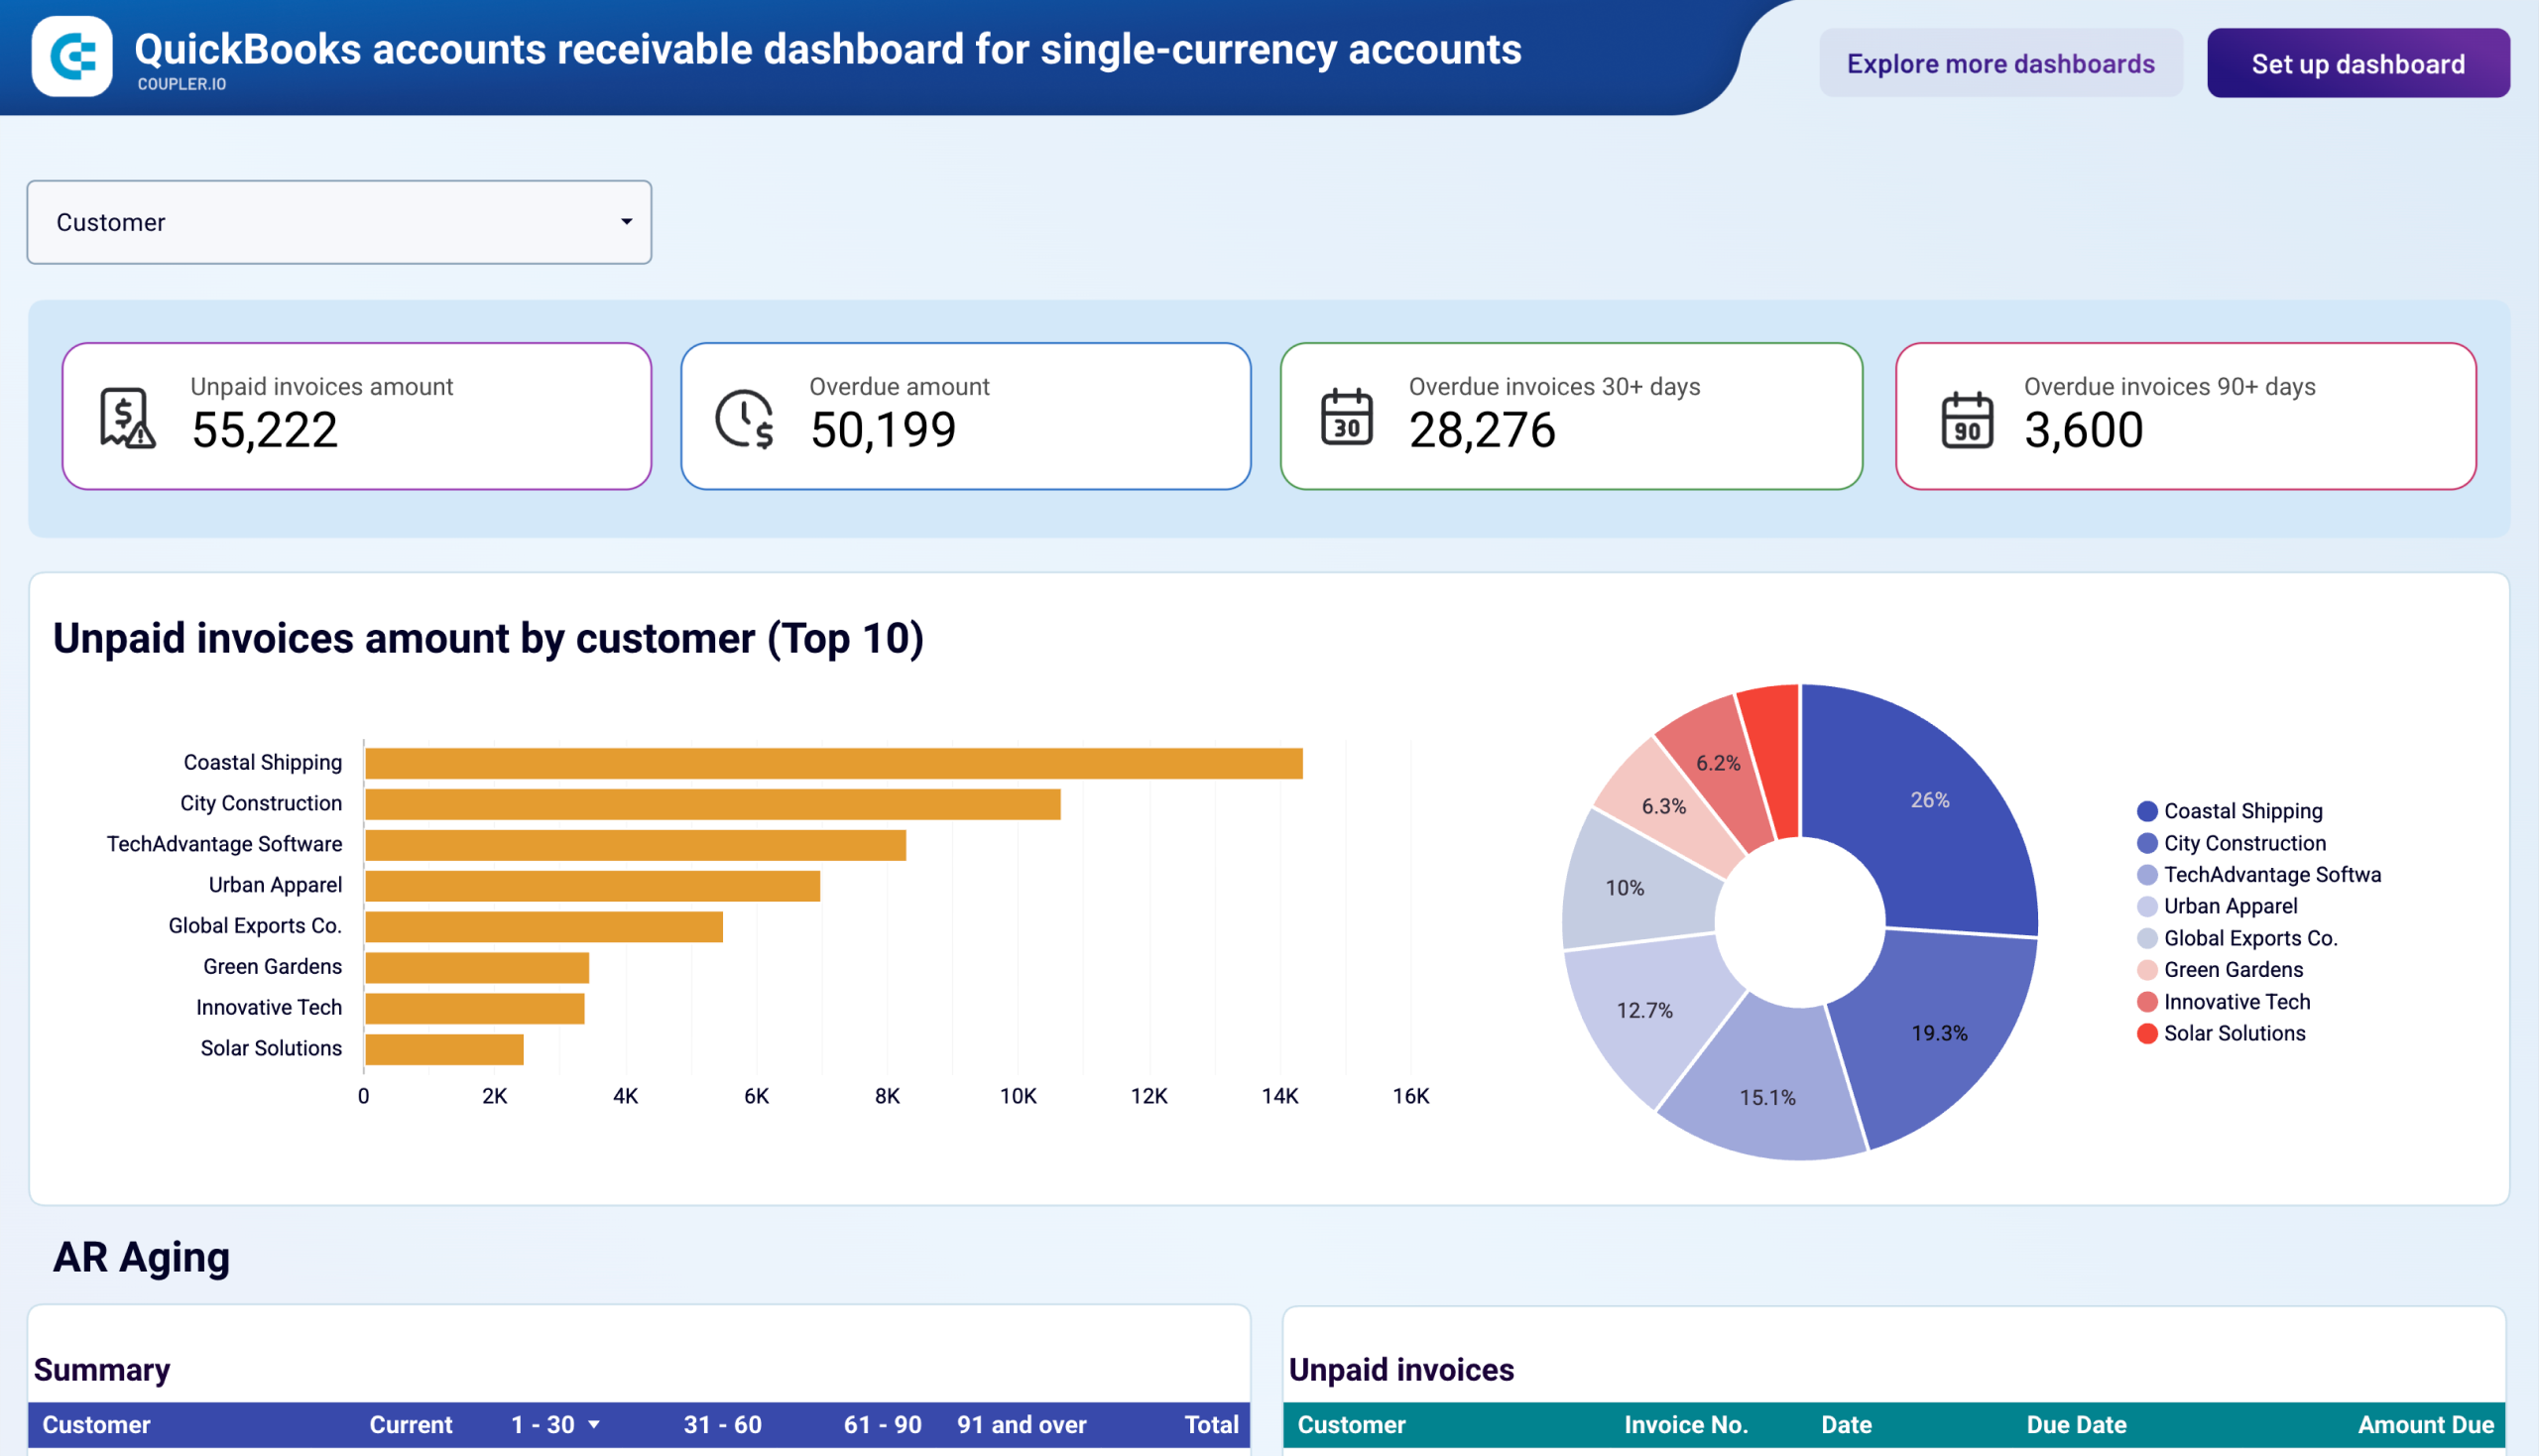
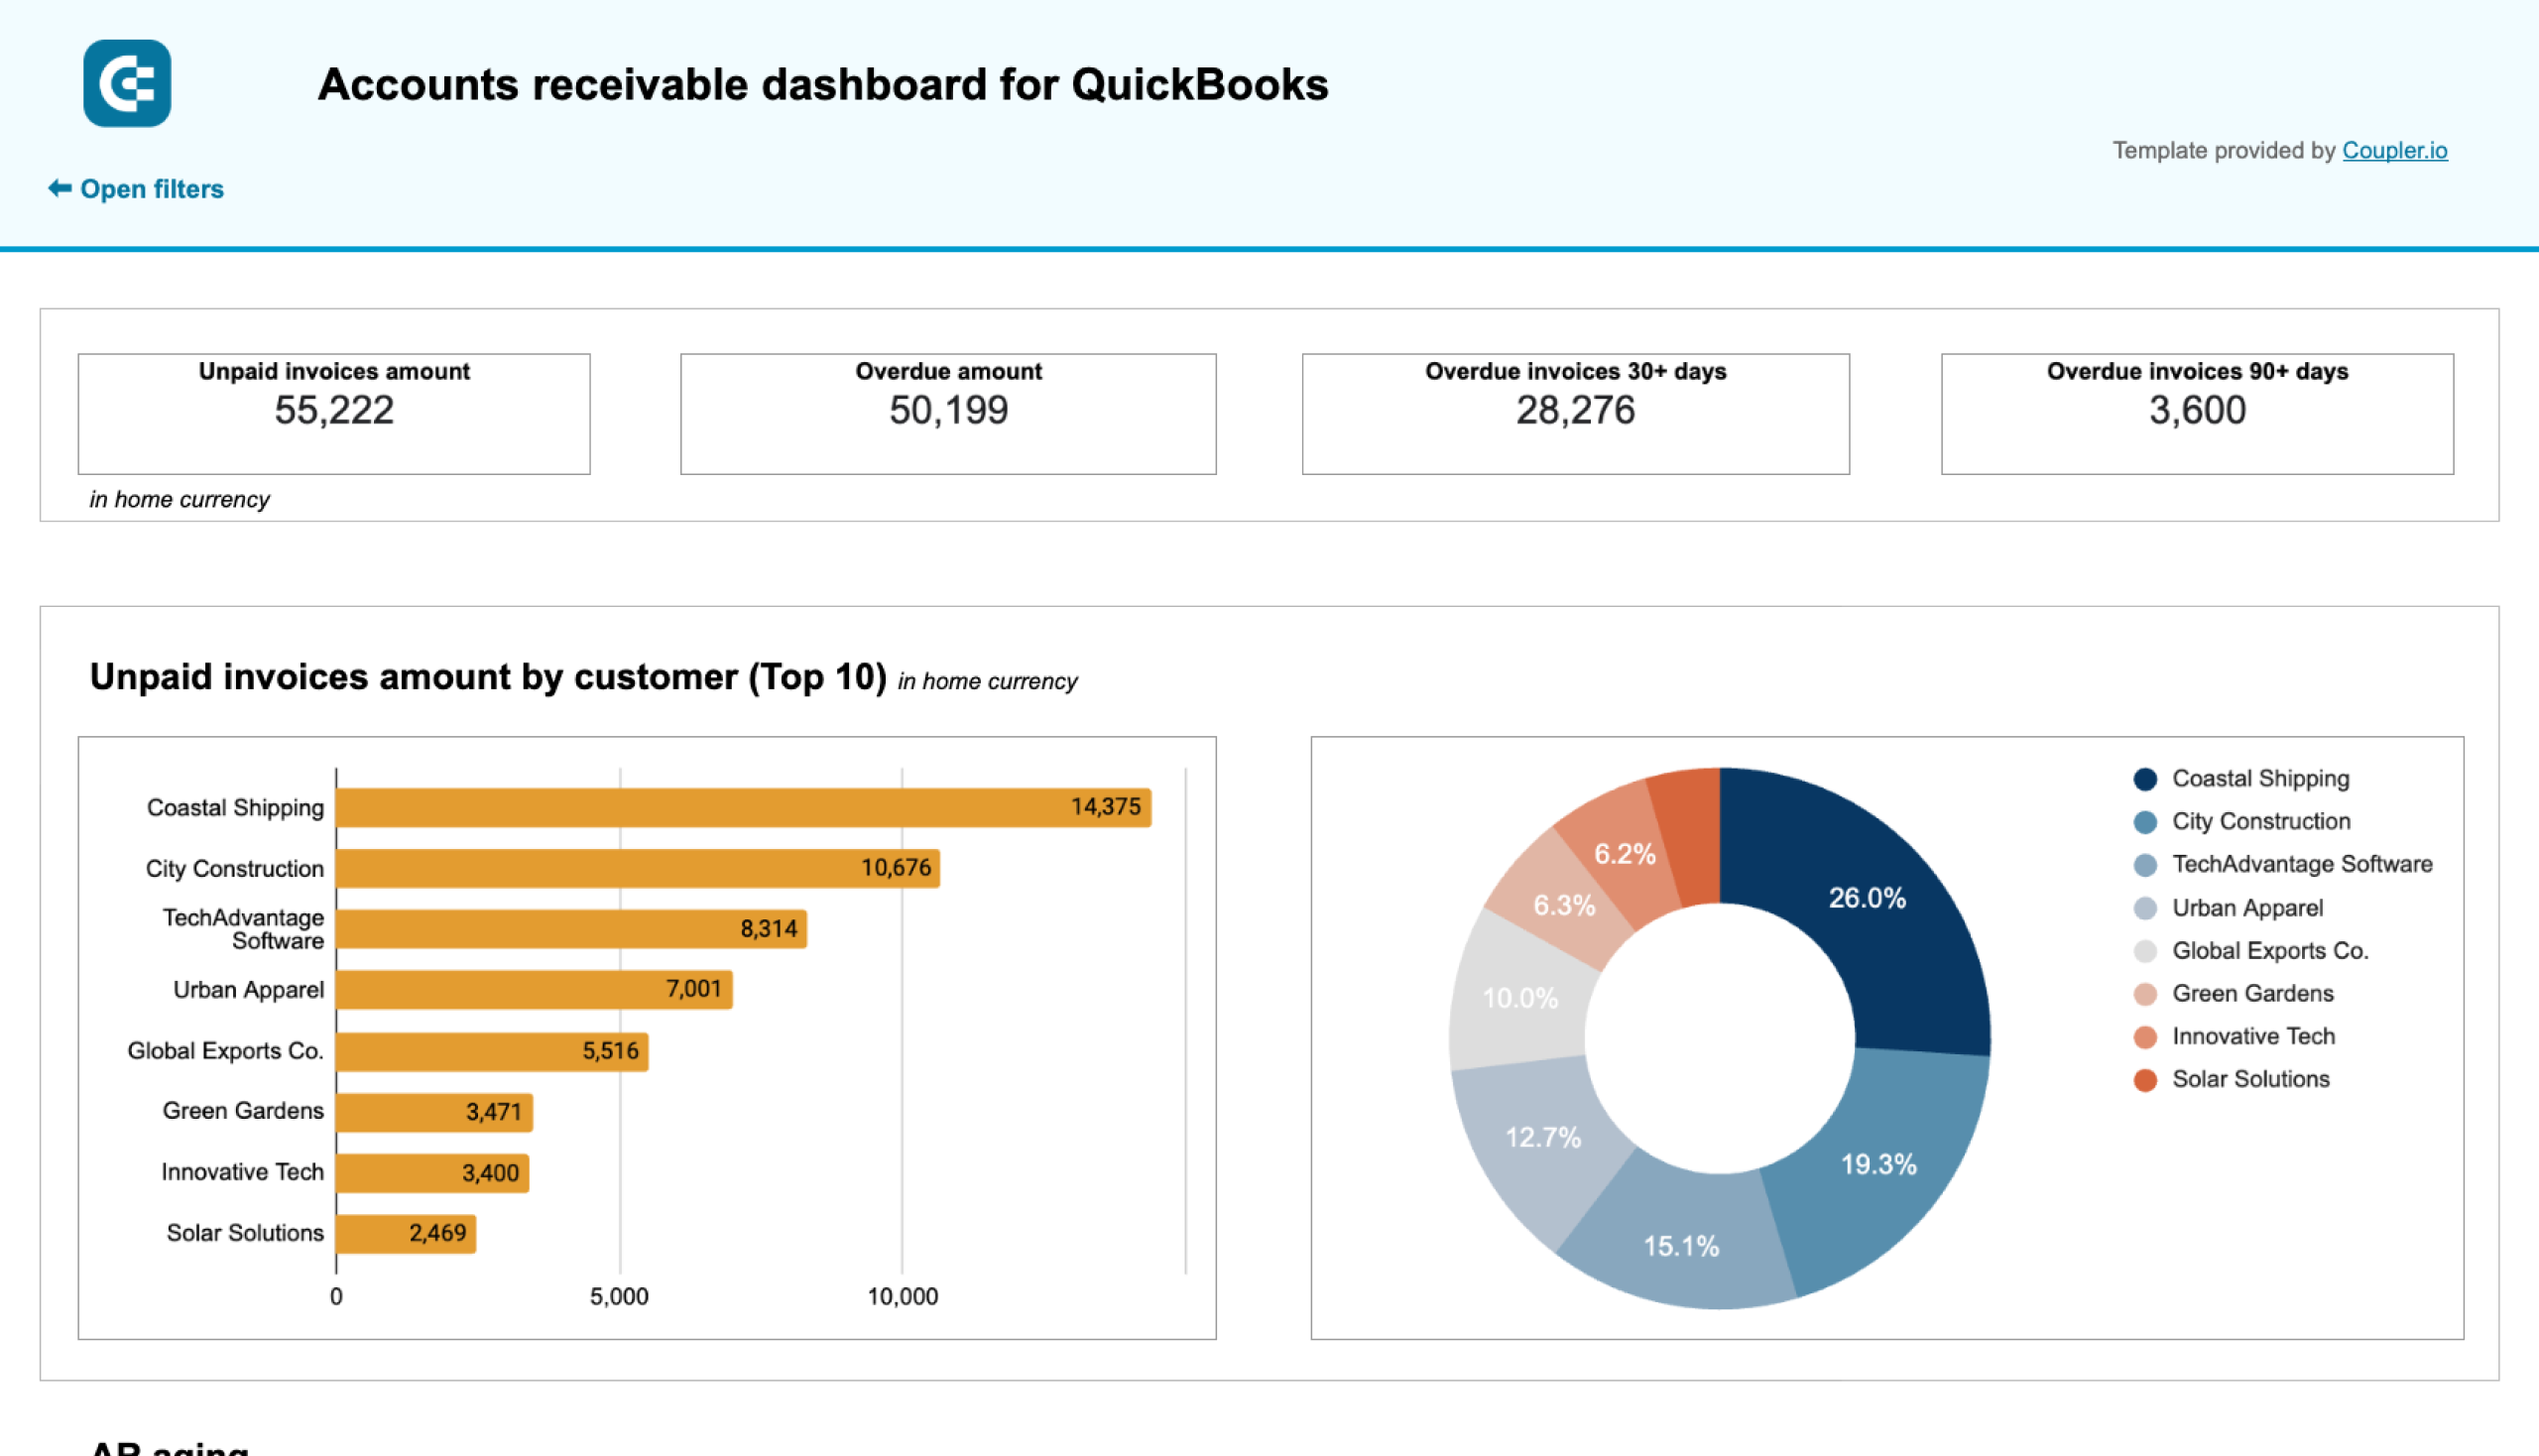
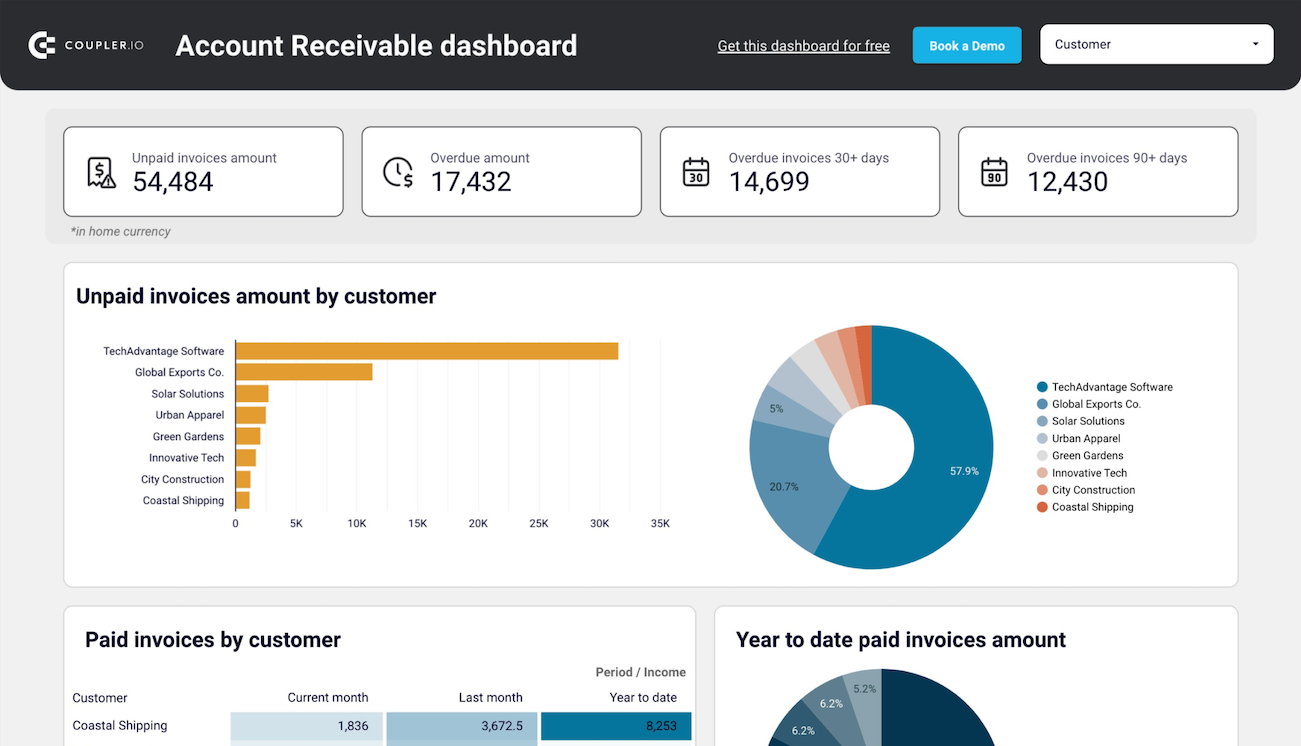
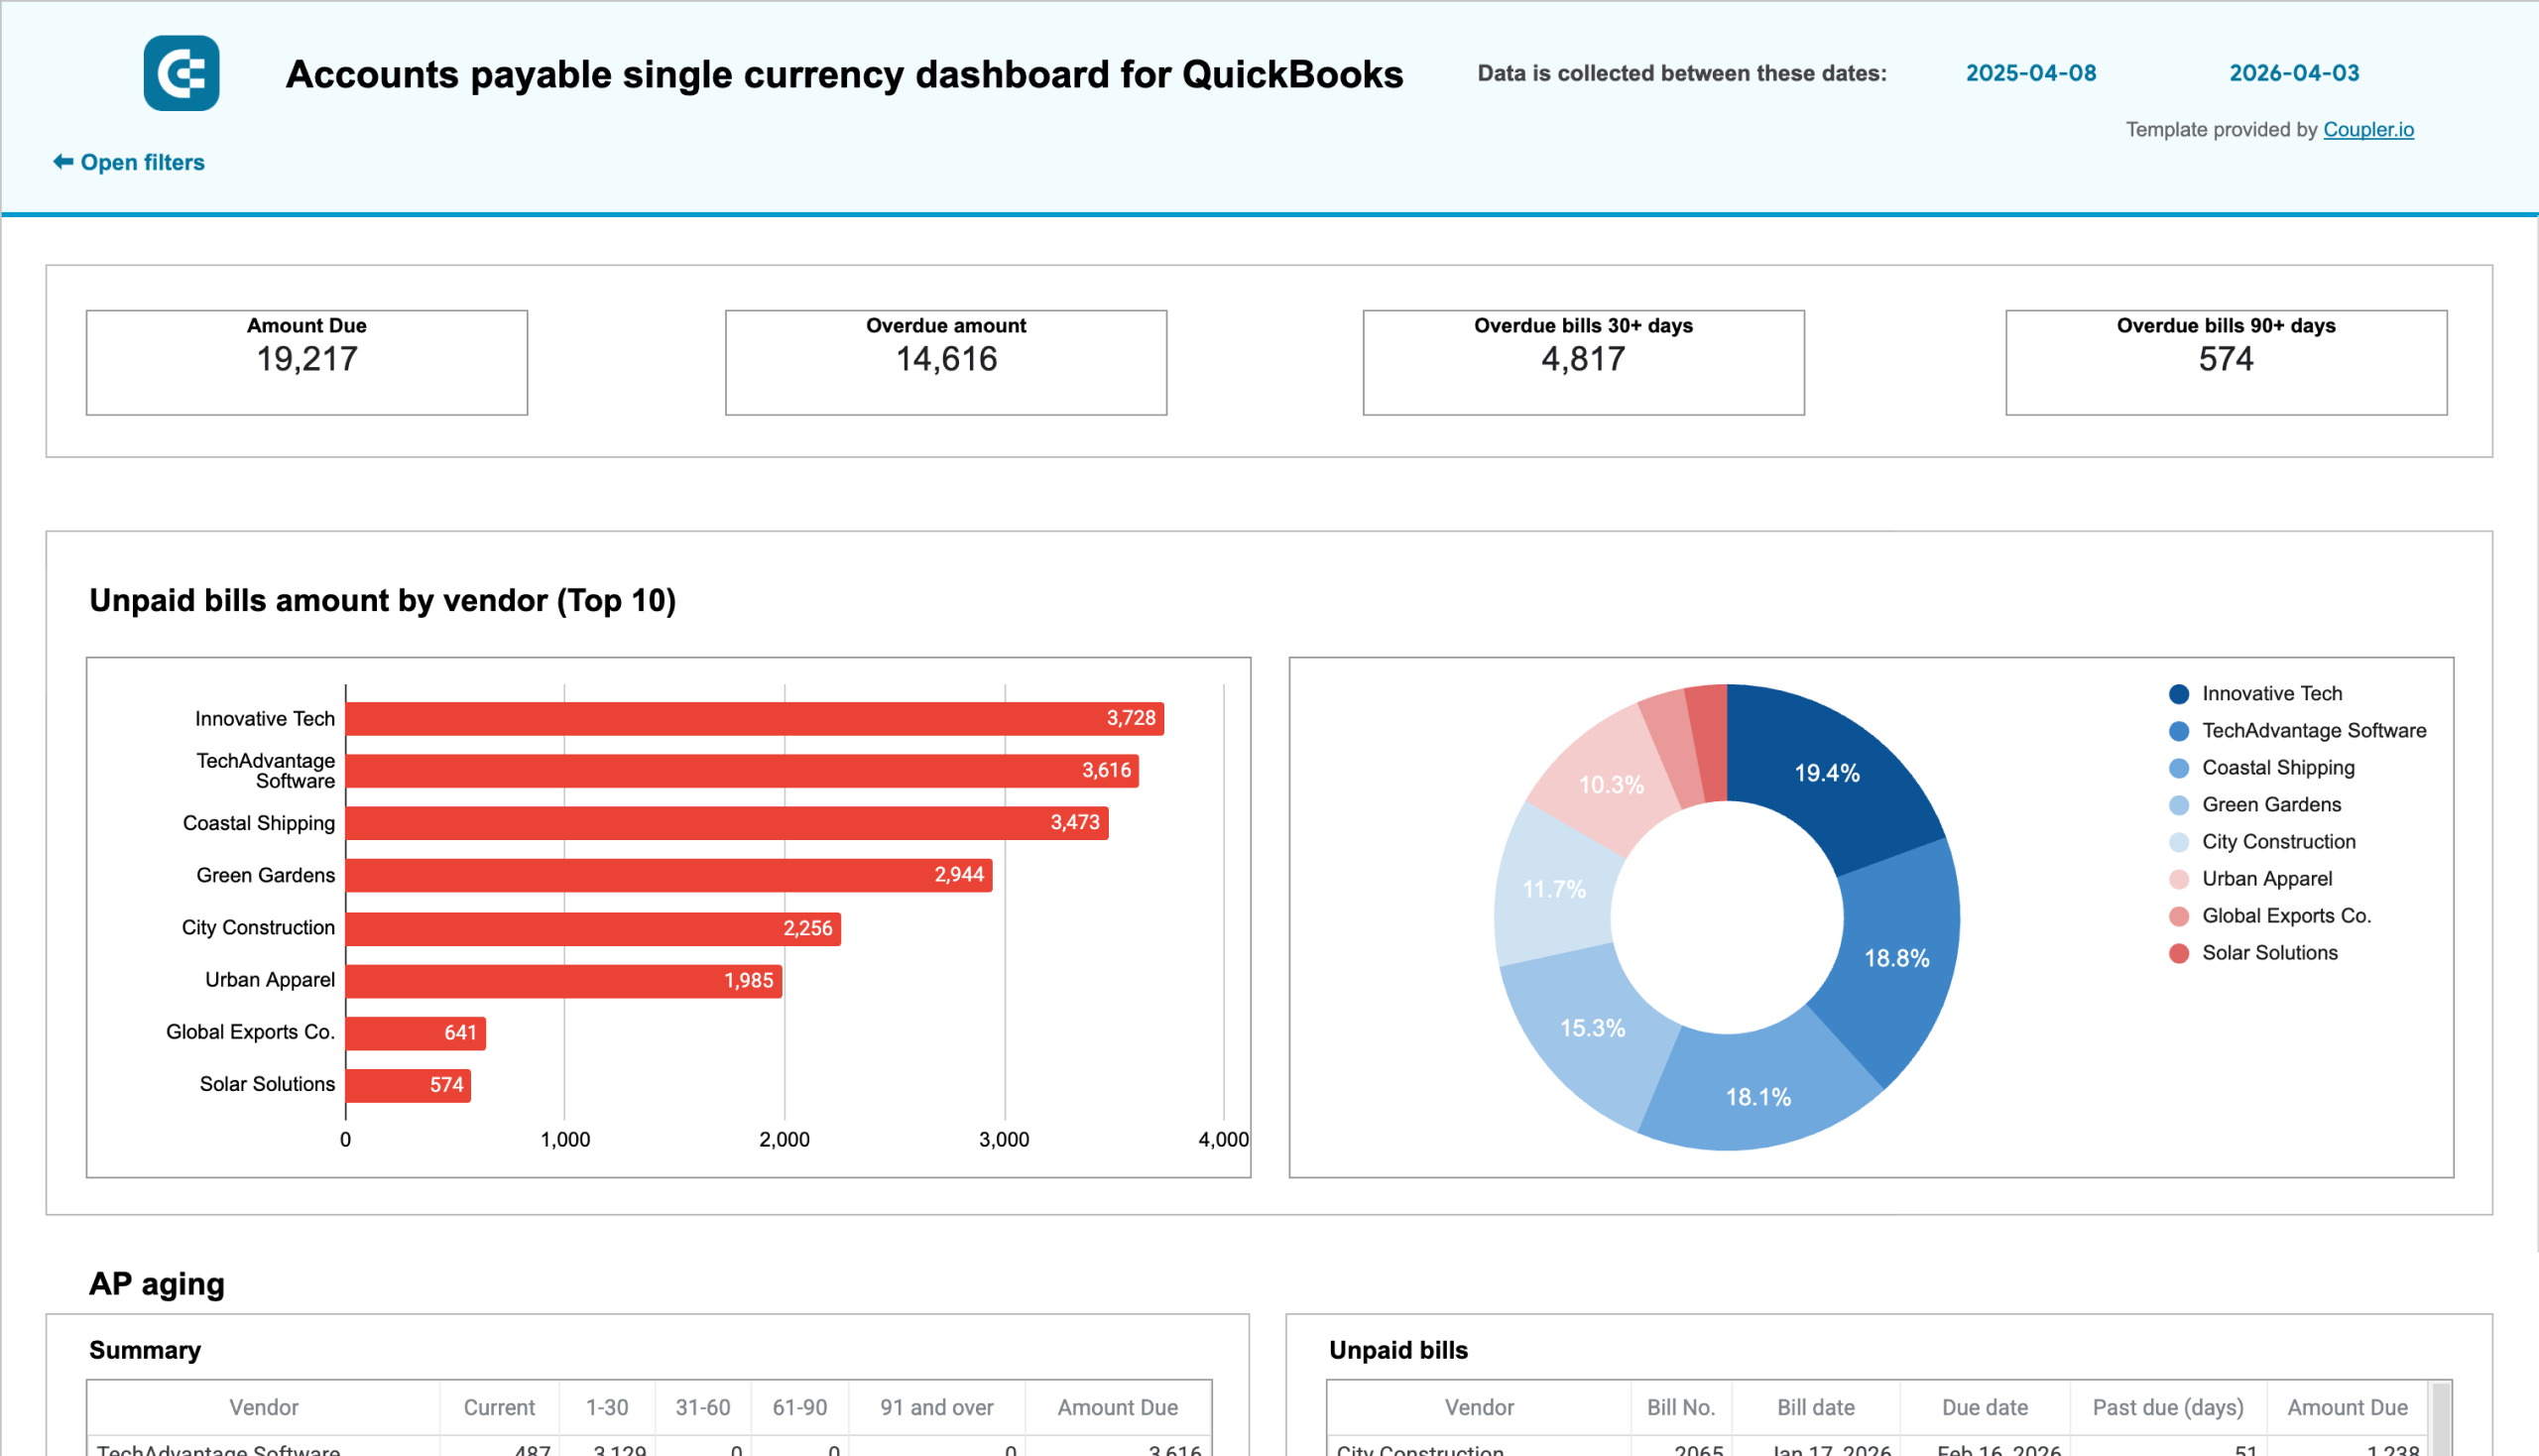
Optimize your accounting workflows using financial reporting dashboards that consolidate data from invoices, accounts receivable, accounts payable, and more. Our templates provide an up-to-date snapshot of your accounting processes. This is a crucial value to stay organized and ensure compliance.
Choose your Financial dashboard template to kick off
What is a financial dashboard?
At its core, a financial reporting dashboard features dynamic visualizations including interactive charts, customizable tables, and performance scorecards. These elements work together with filters and controllers to tell your financial story. You can track high-level metrics like revenue growth and profit margins and get detailed breakdowns of expenses and cash flow. The ability to filter data and adjust time periods lets you dive deep into specific aspects of your financial performance.
With Coupler.io, you can build financial dashboards from scratch but it does not mean that you have to. Our ready-to-use dashboard templates allow you to focus on what matters most — analyzing your financial data. Seamlessly integrate your financial data sources using the built-in connector and get dashboards that deliver immediate value to your business.

What should financial reporting dashboards include?
A well-designed financial dashboard showcases essential metrics that provide insights into your business's health and performance. At its core, you should be able to track critical indicators such as net income, operating cash flow, gross profit margin, and expense ratios. These metrics enable you to evaluate the effectiveness of your business strategies and make data-driven decisions.
Your dashboard should offer continuous access to key financial data streams, including revenue generation, expense management, and cash flow patterns. This accessibility is vital to identify emerging trends and address potential challenges before they become critical. When you can overview all these metrics in a single interface, the financial monitoring and decision-making process becomes more efficient.
To transform raw data into insights, your financial dashboard must include visual elements and drill-down functionality. Interactive charts and graphs should present complex financial relationships in a clear and user-friendly format. Drill-down options allow you to delve deeper into the underlying data. All these analytical capabilities ensure that financial insights are not only accessible but also actionable for all stakeholders.
How to create financial dashboards from templates?
