Google Calendar dashboard examples and reporting templates
Transform your time management with automated Google Calendar dashboards that reveal hidden patterns in your schedule. Monitor meeting loads, track availability windows, and analyze productivity cycles through visual reports that connect directly to your calendar data. Make strategic decisions about time allocation based on real scheduling insights rather than guesswork.
Google Calendar dashboard examples for every need


about your case. It doesn't cost you a penny 😉
Choose your white label Google Calendar dashboard to kick off
What is a Google Calendar dashboard?
An advanced Google Calendar reporting dashboard consolidates months of scheduling data into clear visualizations showing meeting frequency, duration patterns, creator analysis, and productivity cycles. Through automated data connections via Coupler.io, our Google calendar dashboard templates update continuously without manual intervention, providing real-time visibility into time allocation trends, meeting overload indicators, and work-life balance metrics that drive smarter scheduling decisions.

What reports should be included in Google Calendar dashboards?
Effective calendar analytics requires multiple perspectives on time usage patterns. Based on our analysis of successful Google calendar dashboards, we recommend incorporating these four critical report categories that address different aspects of time management and productivity optimization.
The meeting analysis report forms the foundation of calendar insights, tracking total meeting duration, frequency patterns, and type classifications over extended periods. This report distinguishes between recurring commitments and ad-hoc requests, revealing how planned versus spontaneous meetings impact your schedule. It includes creator attribution showing who generates the most calendar requests, response pattern analysis indicating your acceptance rates, and platform usage breakdowns across different meeting tools. These insights help identify meeting overload sources and optimize recurring commitment structures.
The availability tracking report monitors your actual free time versus scheduled commitments across daily, weekly, and monthly cycles. This report calculates availability percentages for past, current, and future periods, highlighting busy versus open time slots and identifying natural focus work windows. It includes workload distribution analysis showing peak scheduling periods and lighter availability zones. The report reveals when you have genuine capacity for new commitments versus when your calendar is already saturated, enabling proactive time protection strategies.
The productivity pattern report examines the relationship between meeting density and work output potential, identifying optimal scheduling configurations for different types of work. This report tracks focus time versus meeting time ratios, analyzes day-of-week productivity variations, and monitors the impact of meeting clustering on available deep work periods. It includes time fragmentation analysis showing how meeting distribution affects concentrated work opportunities and energy level assessments based on scheduling intensity patterns.
The work-life balance report compares scheduled commitments against out-of-office time, vacation usage, and recovery periods to prevent burnout and maintain sustainable productivity levels. This report tracks meeting load versus personal time allocation, identifies periods of excessive calendar density without adequate breaks, and monitors long-term scheduling sustainability. It includes stress indicator analysis based on consecutive high-meeting periods and recommendations for incorporating buffer time and recovery windows into regular scheduling patterns.
What insights you can get with the Google Calendar dashboard
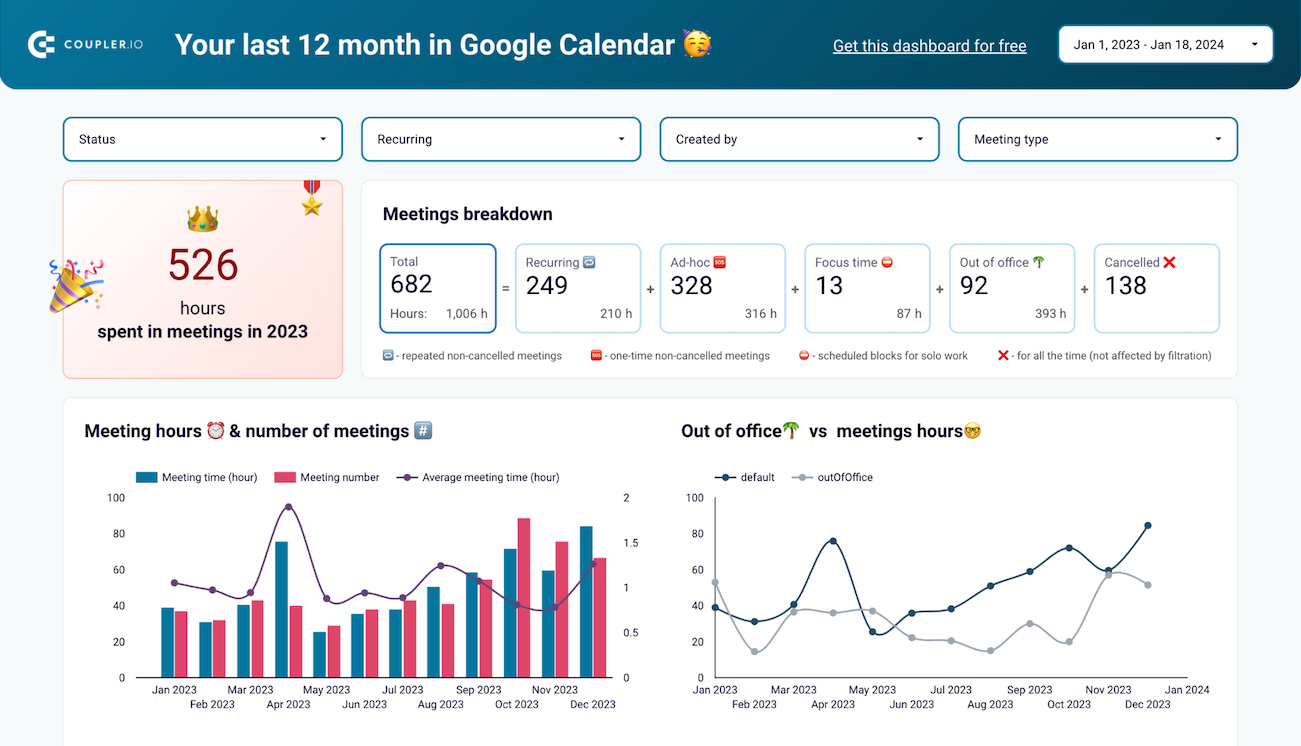
Track your complete time allocation with detailed breakdowns of meeting duration versus available work time across multiple timeframes. The Google calendar reporting dashboard displays total meeting hours, availability percentages, and productivity window identification to help you understand actual time distribution patterns. This insight reveals opportunities to protect focus time and optimize recurring meeting schedules for better work-life integration.

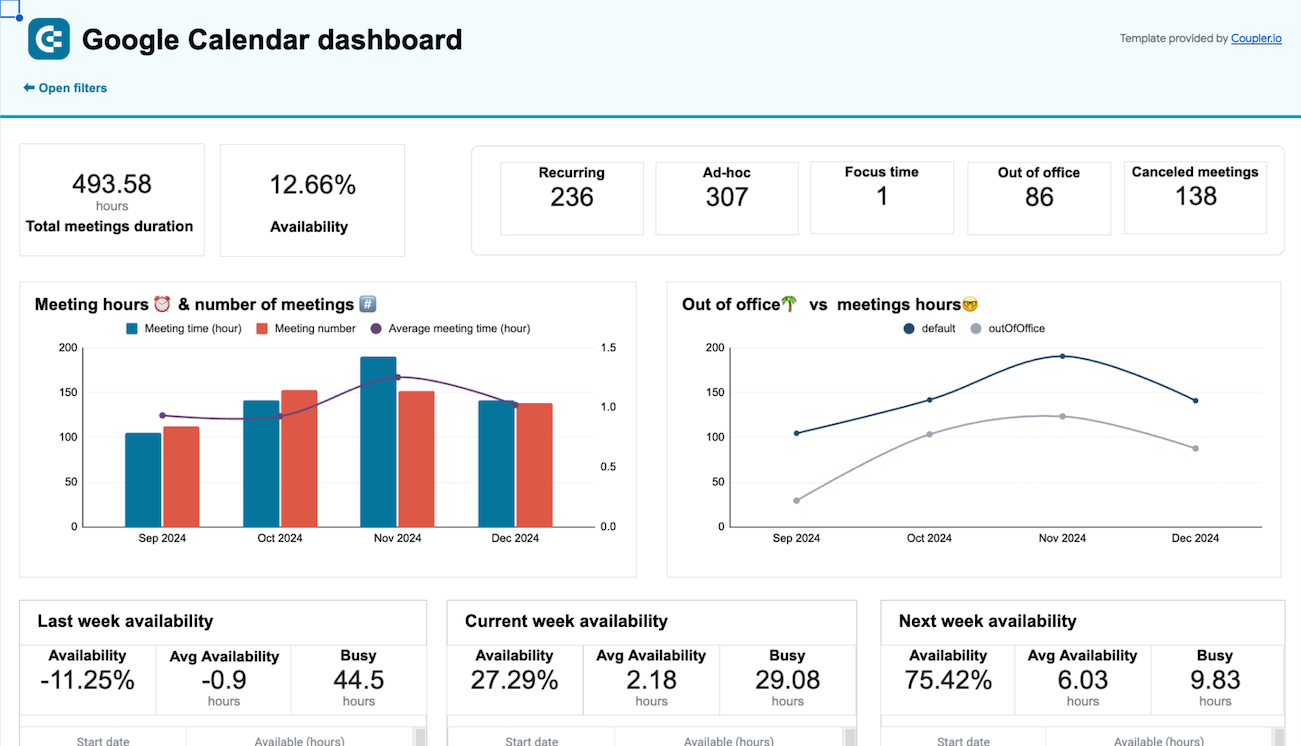
Monitor your availability percentages for past, current, and future weeks with average availability hours and busy time breakdowns. The dashboard provides three simple tables showing week-by-week availability patterns to help you reflect on past productivity and allocate time for future important tasks or meetings effectively.
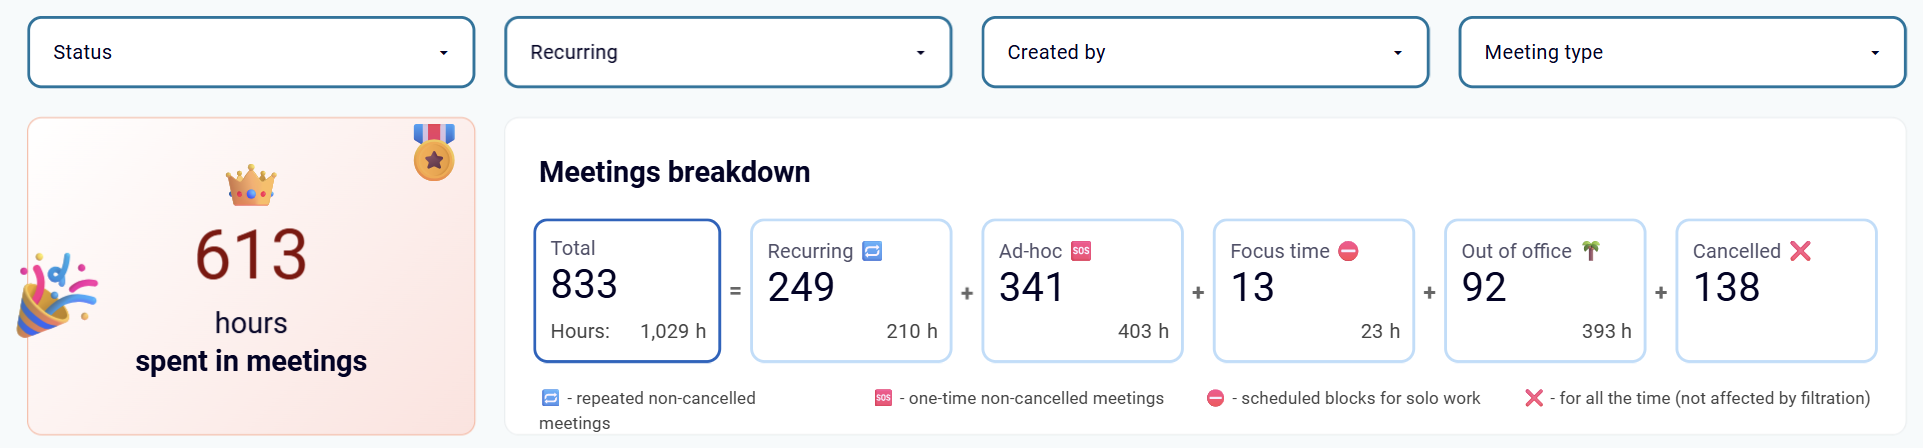
Analyze the exact breakdown of hours spent in meetings over 12 months, categorized by recurring versus ad-hoc appointments. The dashboard provides data-driven control to cut meeting overload and increase deep work time by revealing how planned versus spontaneous meetings impact your schedule and productivity cycles.
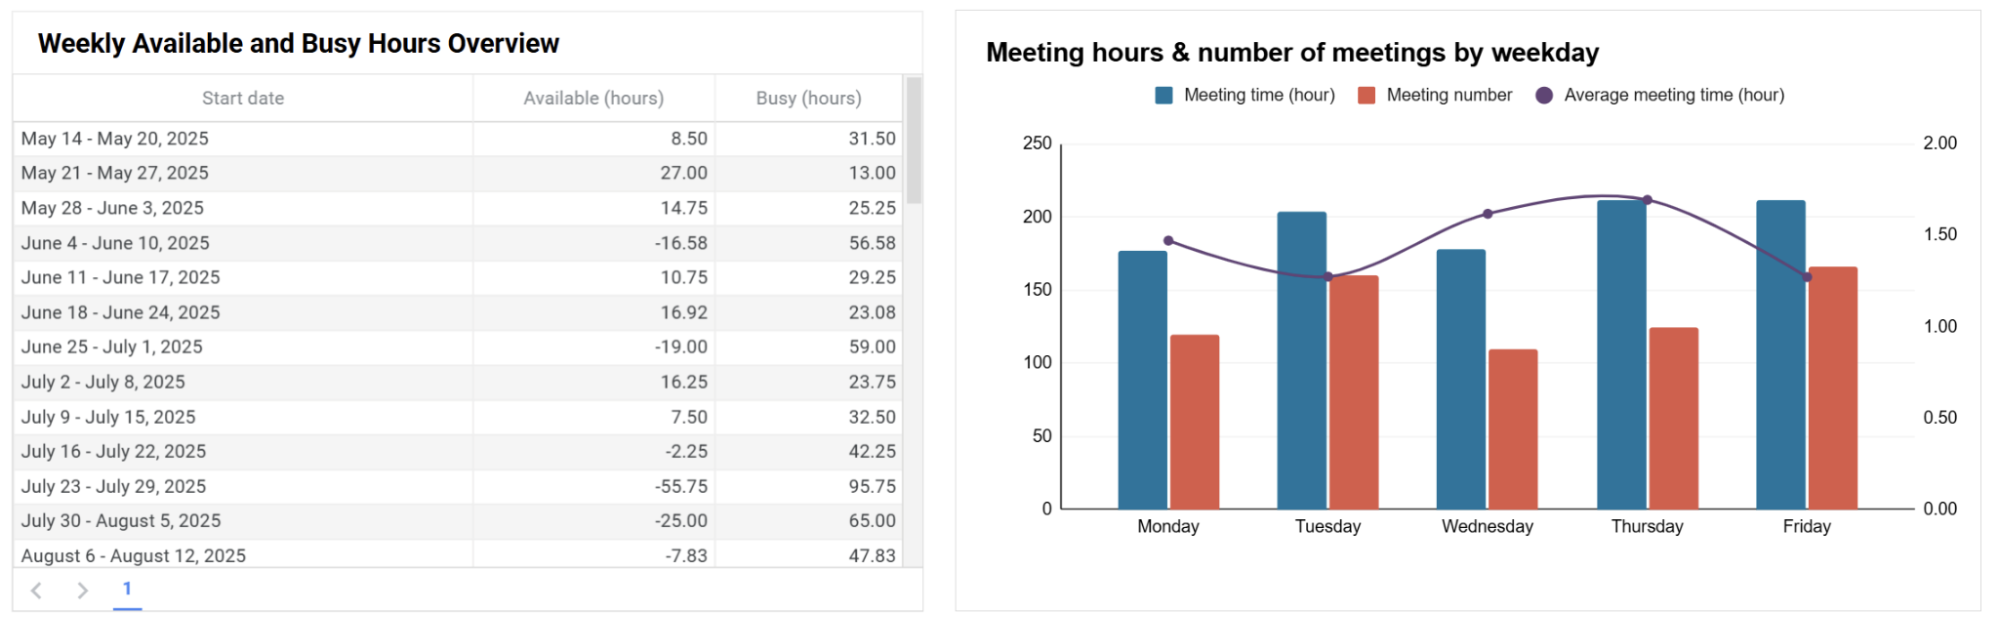
Identify specific months, weekdays, and calendar periods when your schedule becomes consistently overloaded versus naturally lighter timeframes. The dashboard reveals scheduling patterns that help you plan launches, quarterly reviews, and vacations by avoiding busy periods and maximizing productivity during available capacity windows.
How to create a Google Calendar dashboard?

Metrics you can track with Google Calendar dashboard templates
Monitor the cumulative hours spent in scheduled meetings across daily, weekly, and monthly periods to understand actual time investment in collaborative activities. This metric reveals when meeting loads become unsustainable and require intervention through calendar optimization strategies for better work-life balance.
Track your genuine free time as a percentage of total work hours with historical trending across past, current, and next weeks. This metric shows real scheduling availability versus perceived openness, enabling proactive time protection and realistic commitment assessment when new meeting requests arise.
Analyze the distribution between recurring scheduled meetings and ad-hoc calendar requests to understand how planned versus reactive scheduling impacts your time management effectiveness. This metric helps optimize the balance between consistent collaborative commitments and flexible response time for urgent priorities.
Measure your actual available work time in hours per day and week to assess genuine capacity for new commitments and focused work sessions. This metric provides concrete data for realistic scheduling decisions and helps prevent calendar overcommitment that leads to reduced productivity.
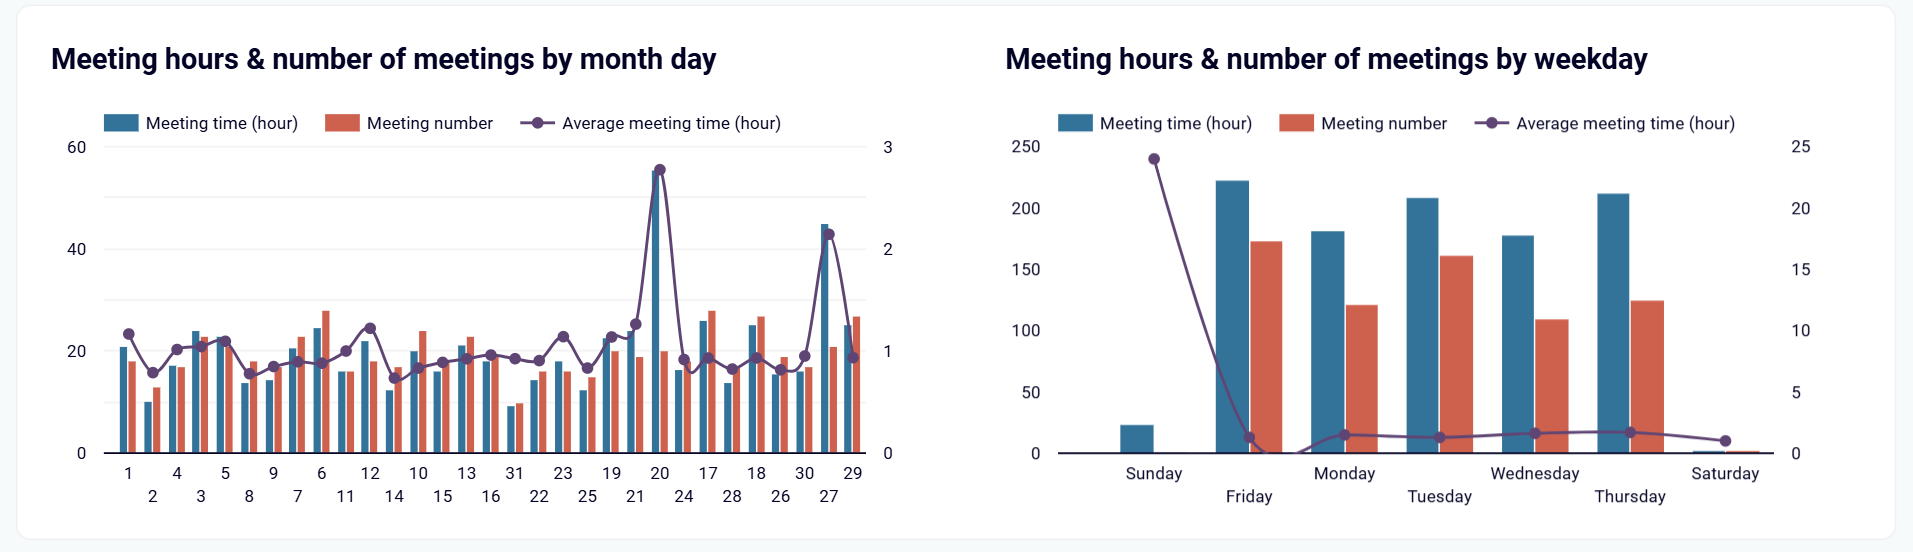
Track which weekdays consistently have the highest meeting density versus lighter collaborative periods through day-of-week analysis. This metric reveals natural scheduling patterns and helps identify optimal days for focus work, important meetings, or personal time allocation.
Monitor who generates the majority of your calendar commitments to understand scheduling influence sources and establish appropriate boundaries around meeting requests. This metric helps identify when external meeting demands exceed manageable levels and enables strategic pushback on unnecessary collaborative time.
Measure actual recovery periods, including vacation usage, break time, and sustainable work pattern maintenance compared to scheduled work commitments. This metric prevents burnout by highlighting periods of excessive calendar density without adequate recovery time for long-term productivity sustainability.