Cash Flow dashboard examples and reporting templates
Transform your financial data into actionable cash flow insights with automated reporting dashboards. Track cash positions, monitor flow trends, and make informed decisions about your business liquidity using real-time data from QuickBooks and Xero – all without manual data entry.
Cash Flow dashboard examples for every need


about your case. It doesn't cost you a penny 😉
What is a cash flow reporting dashboard?

Choose your Cash Flow dashboard template to kick off
What should be included in cash flow dashboard templates?
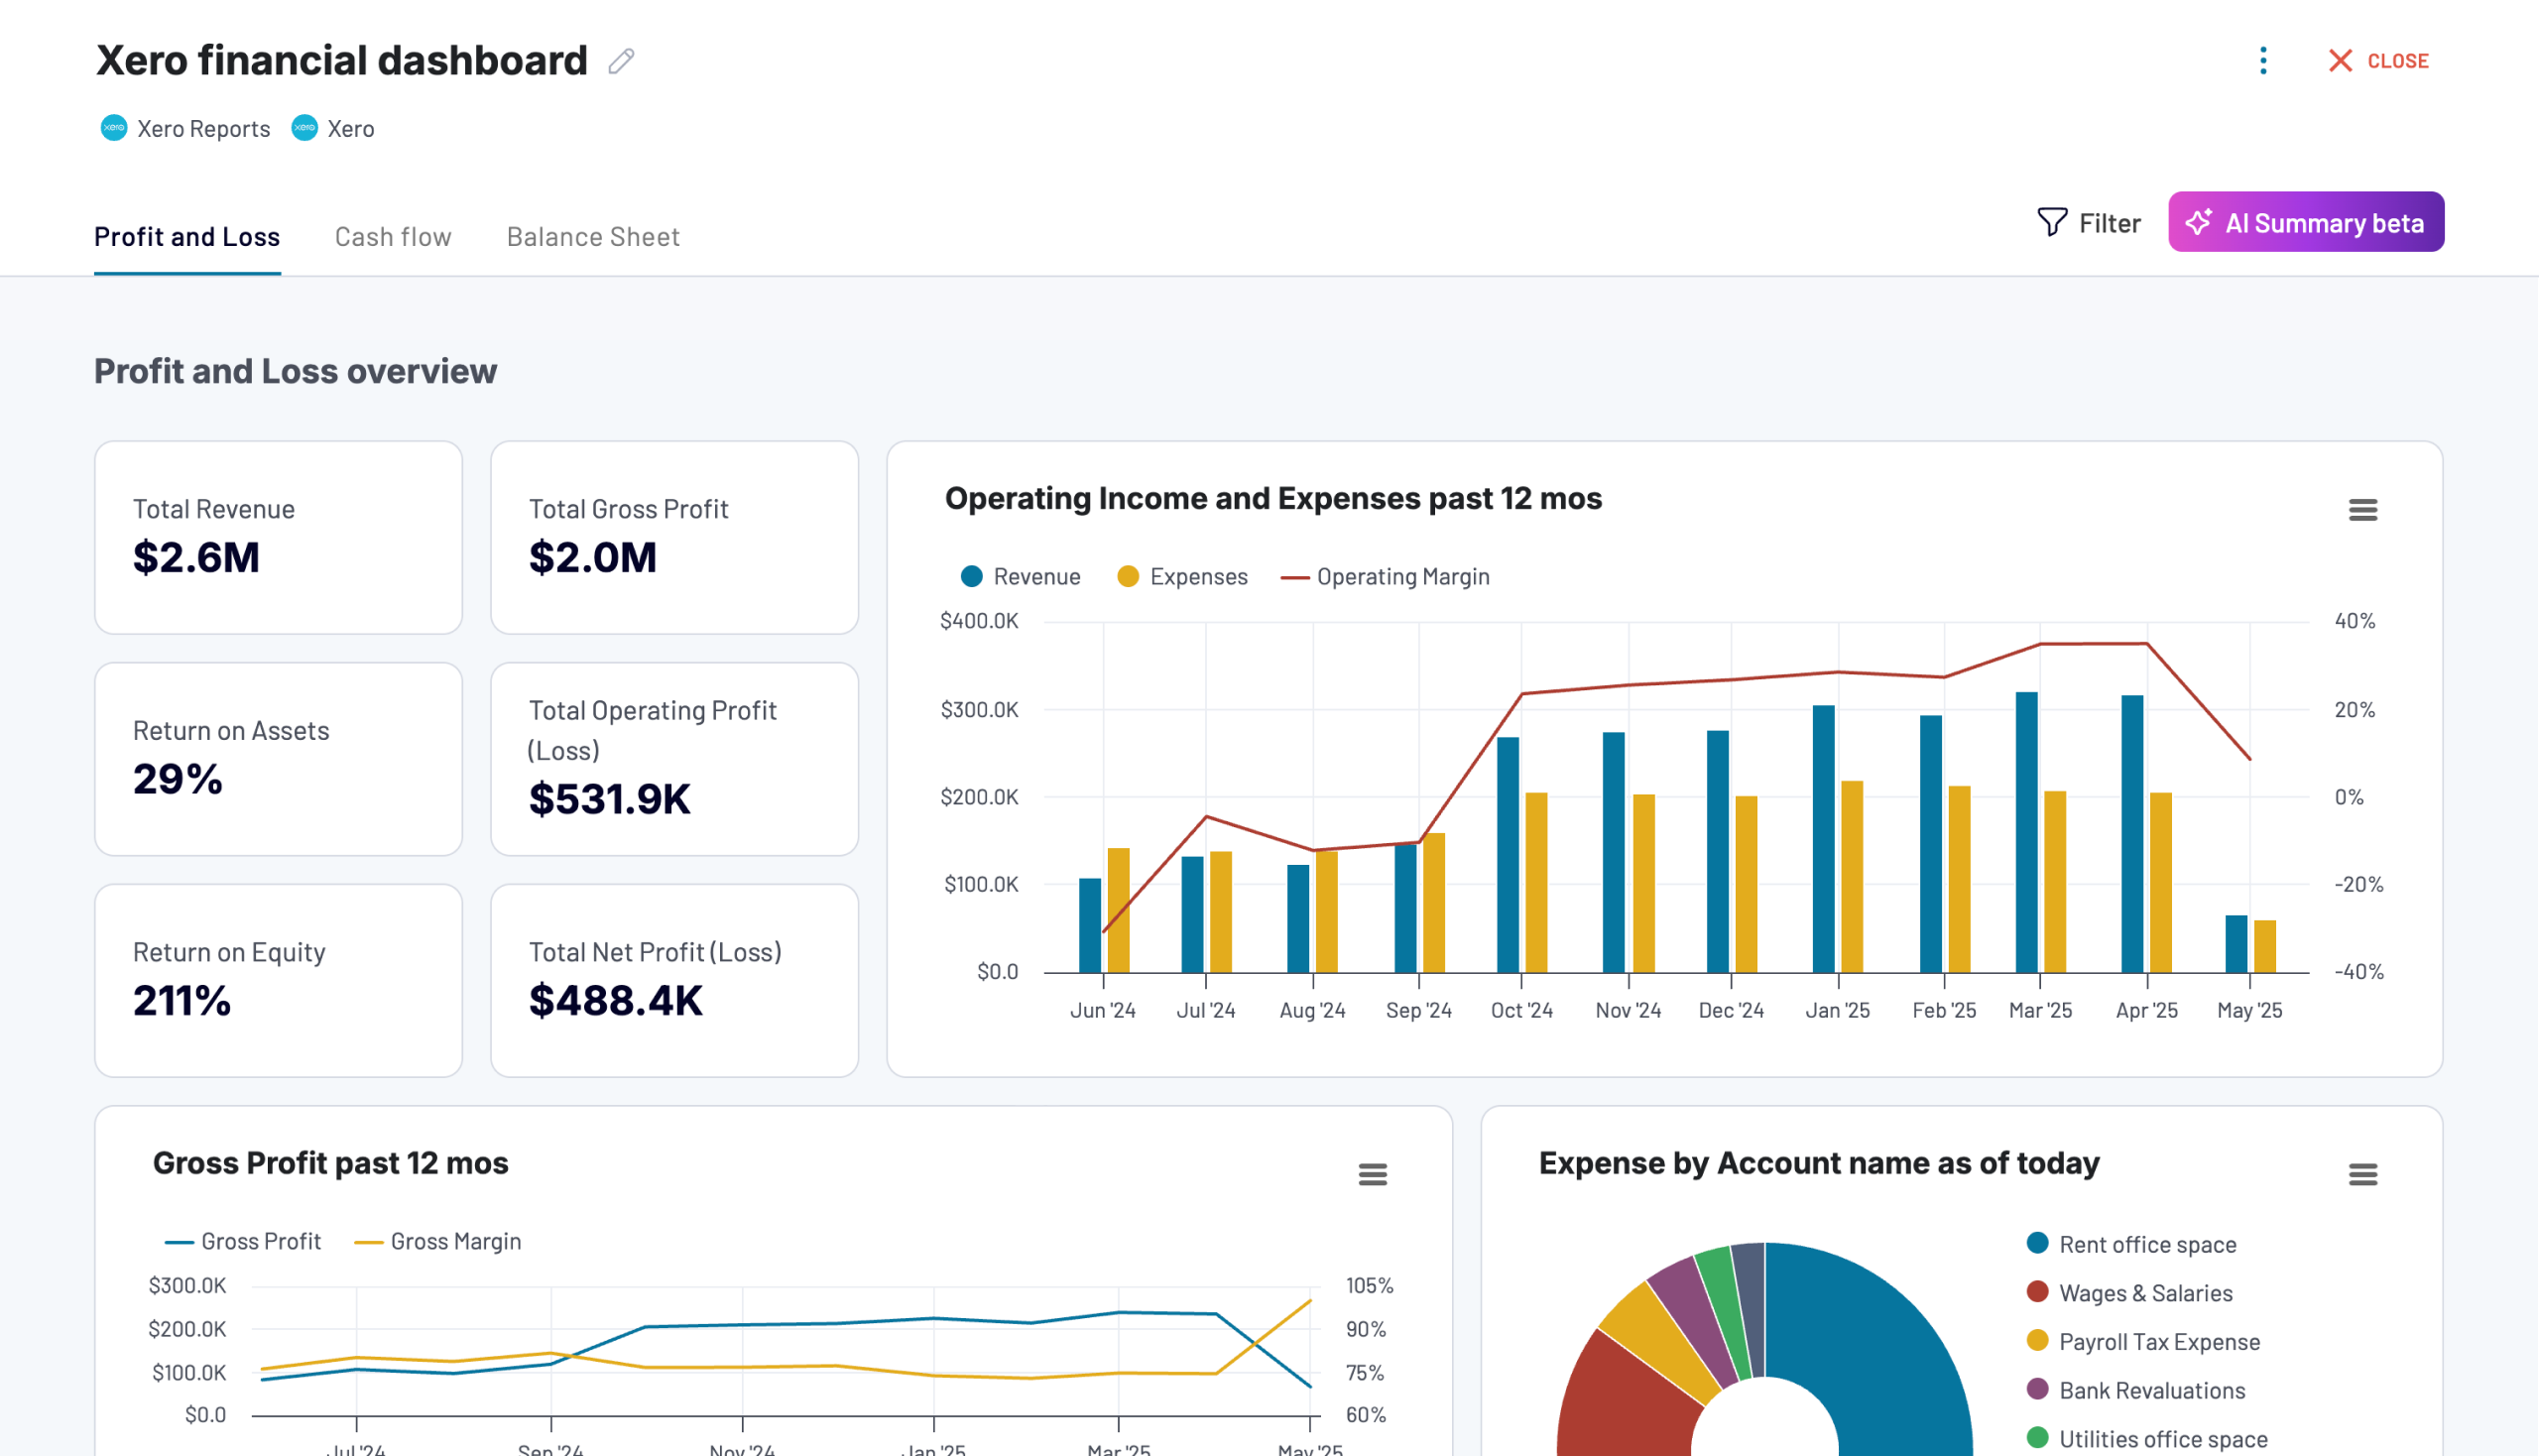
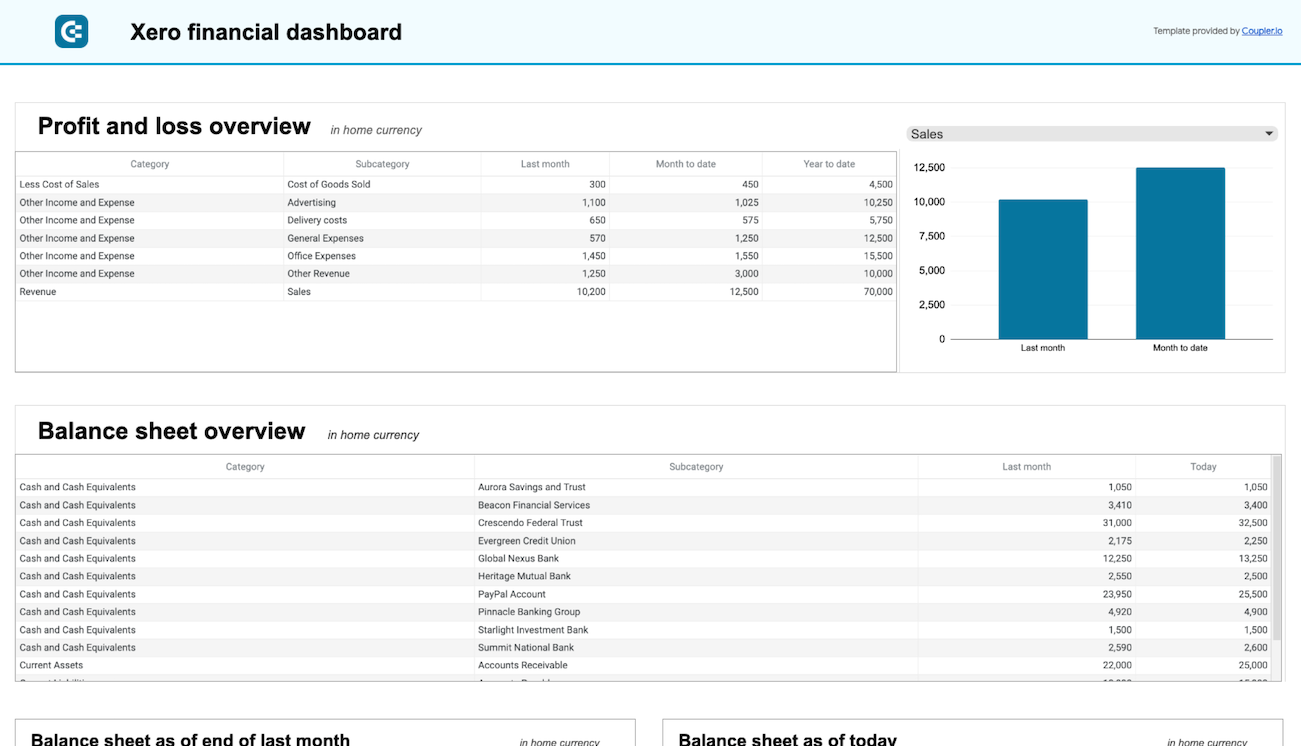
Your cash flow dashboard must start with a comprehensive period-based breakdown showing Opening Balance, Cash Received, and Cash Spent for each reporting timeframe. This structured view helps you understand exactly how much money entered and left your business during specific periods. The dashboard automatically calculates Closing Balances and Net Cash positions, giving you clear insights into the results of your cash movements. This systematic tracking across multiple time periods enables better understanding of your cash flow patterns and supports more effective liquidity management.
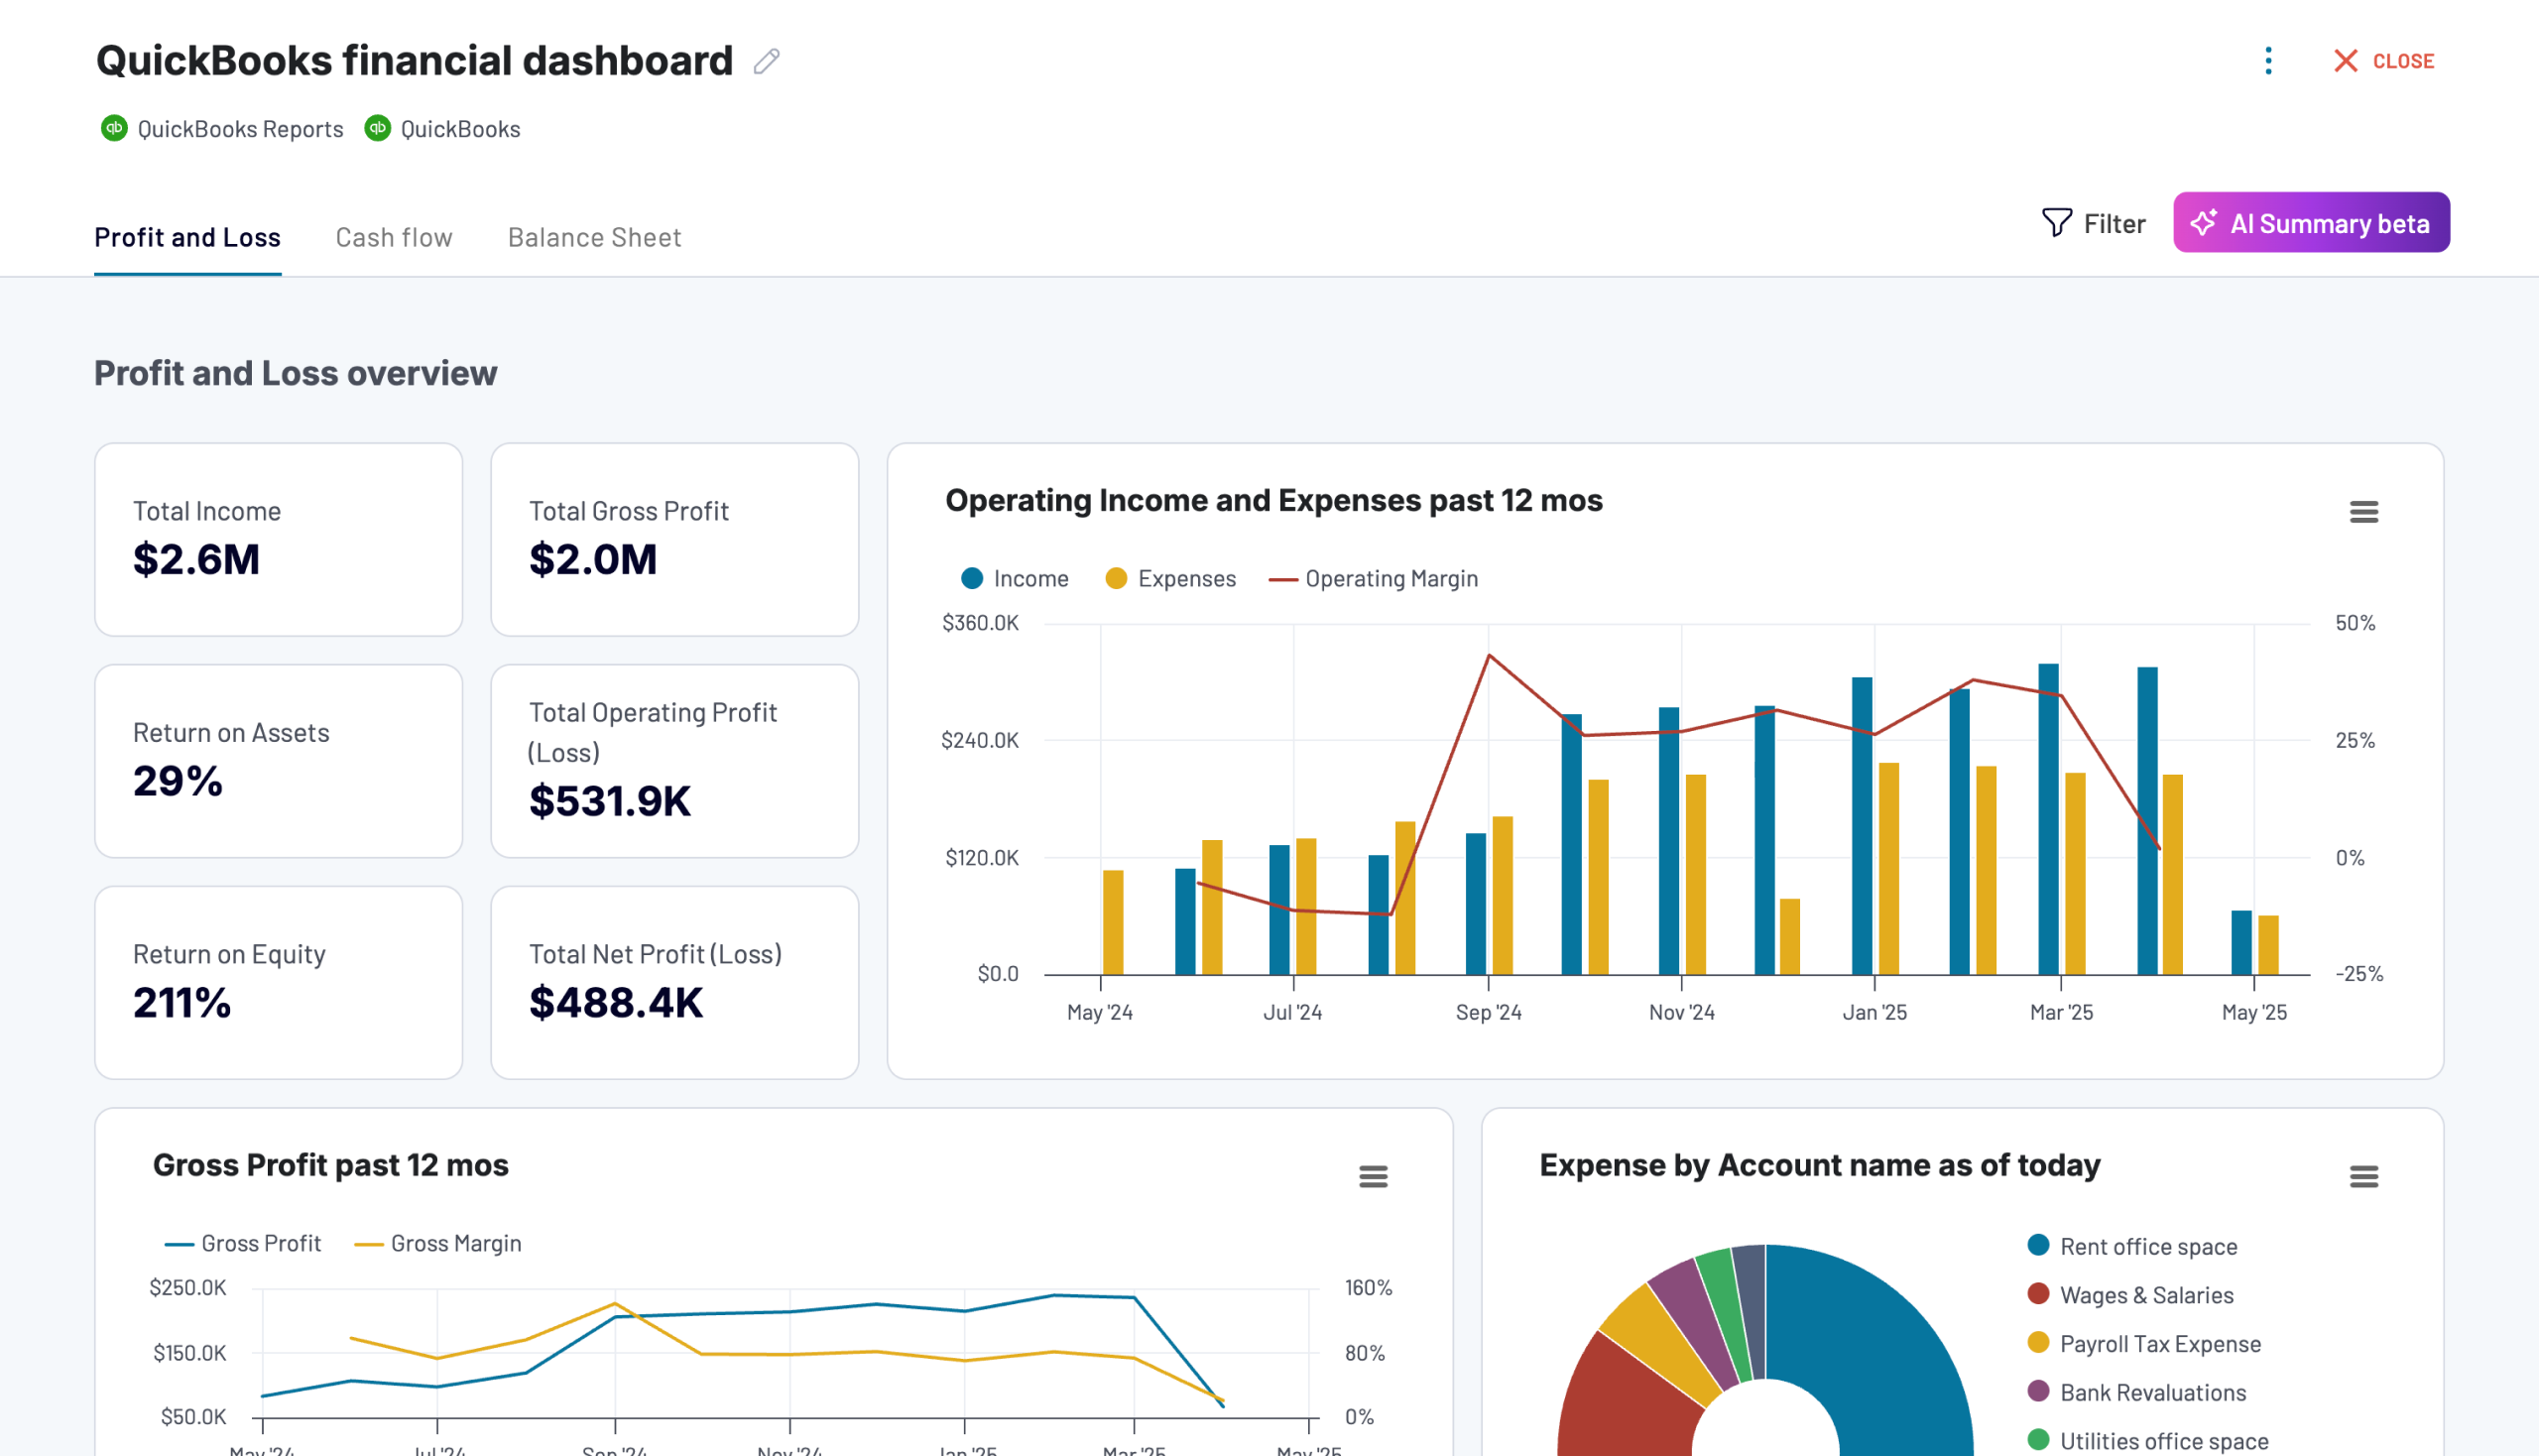
A robust cash flow dashboard should provide clear visualizations of your Cash EoP (End of Period) status and Net Cash Changes. These metrics are crucial for understanding how your cash position evolves over time. The dashboard should present this data through comparative views that highlight changes between different reporting periods. By monitoring these trends, you can quickly identify significant shifts in your cash position and respond proactively to maintain healthy liquidity levels. Tracking Net Cash Changes helps you understand the cumulative impact of your cash movements and supports better financial planning.
Why do you need cash flow reporting templates?
Managing cash flow effectively is crucial for business sustainability, yet many organizations struggle with real-time visibility into their cash position. A cash flow reporting dashboard solves this challenge by automating the collection and visualization of cash-related data from your accounting software. This automated approach eliminates manual data compilation, reduces reporting errors, and provides continuous visibility into your liquidity position.
With Coupler.io's automated data refresh capabilities, your cash flow dashboard stays current, ensuring you always have the latest information for making critical financial decisions. This real-time insight enables you to identify and address potential cash flow issues before they impact your operations. It also helps optimize working capital management.
How to choose a perfect cash flow dashboard for your needs?
More Cash Flow Dashboards
Request custom dashboard
From building custom dashboards to setting up data analytics from scratch, we're here to help you succeed. Contact us to discuss your case and possible solutions
Contact us