Shopify Data Connector
Connect Shopify, your ad accounts, and 400+ other tools in a few clicks and send it to Sheets, dashboards, warehouses, or AI tools automatically.


How to set up your Shopify integration
Stop Running Your Store on Messy Spreadsheets

Connect
Blend
Report and analyze
Use Coupler.io dashboards templates
Coupler.io offers a range of ready-to-use interactive dashboard templates designed to streamline your reporting and analytics. Explore our template gallery and connect your Shopify to start using the plug-and-play dashboard right away.
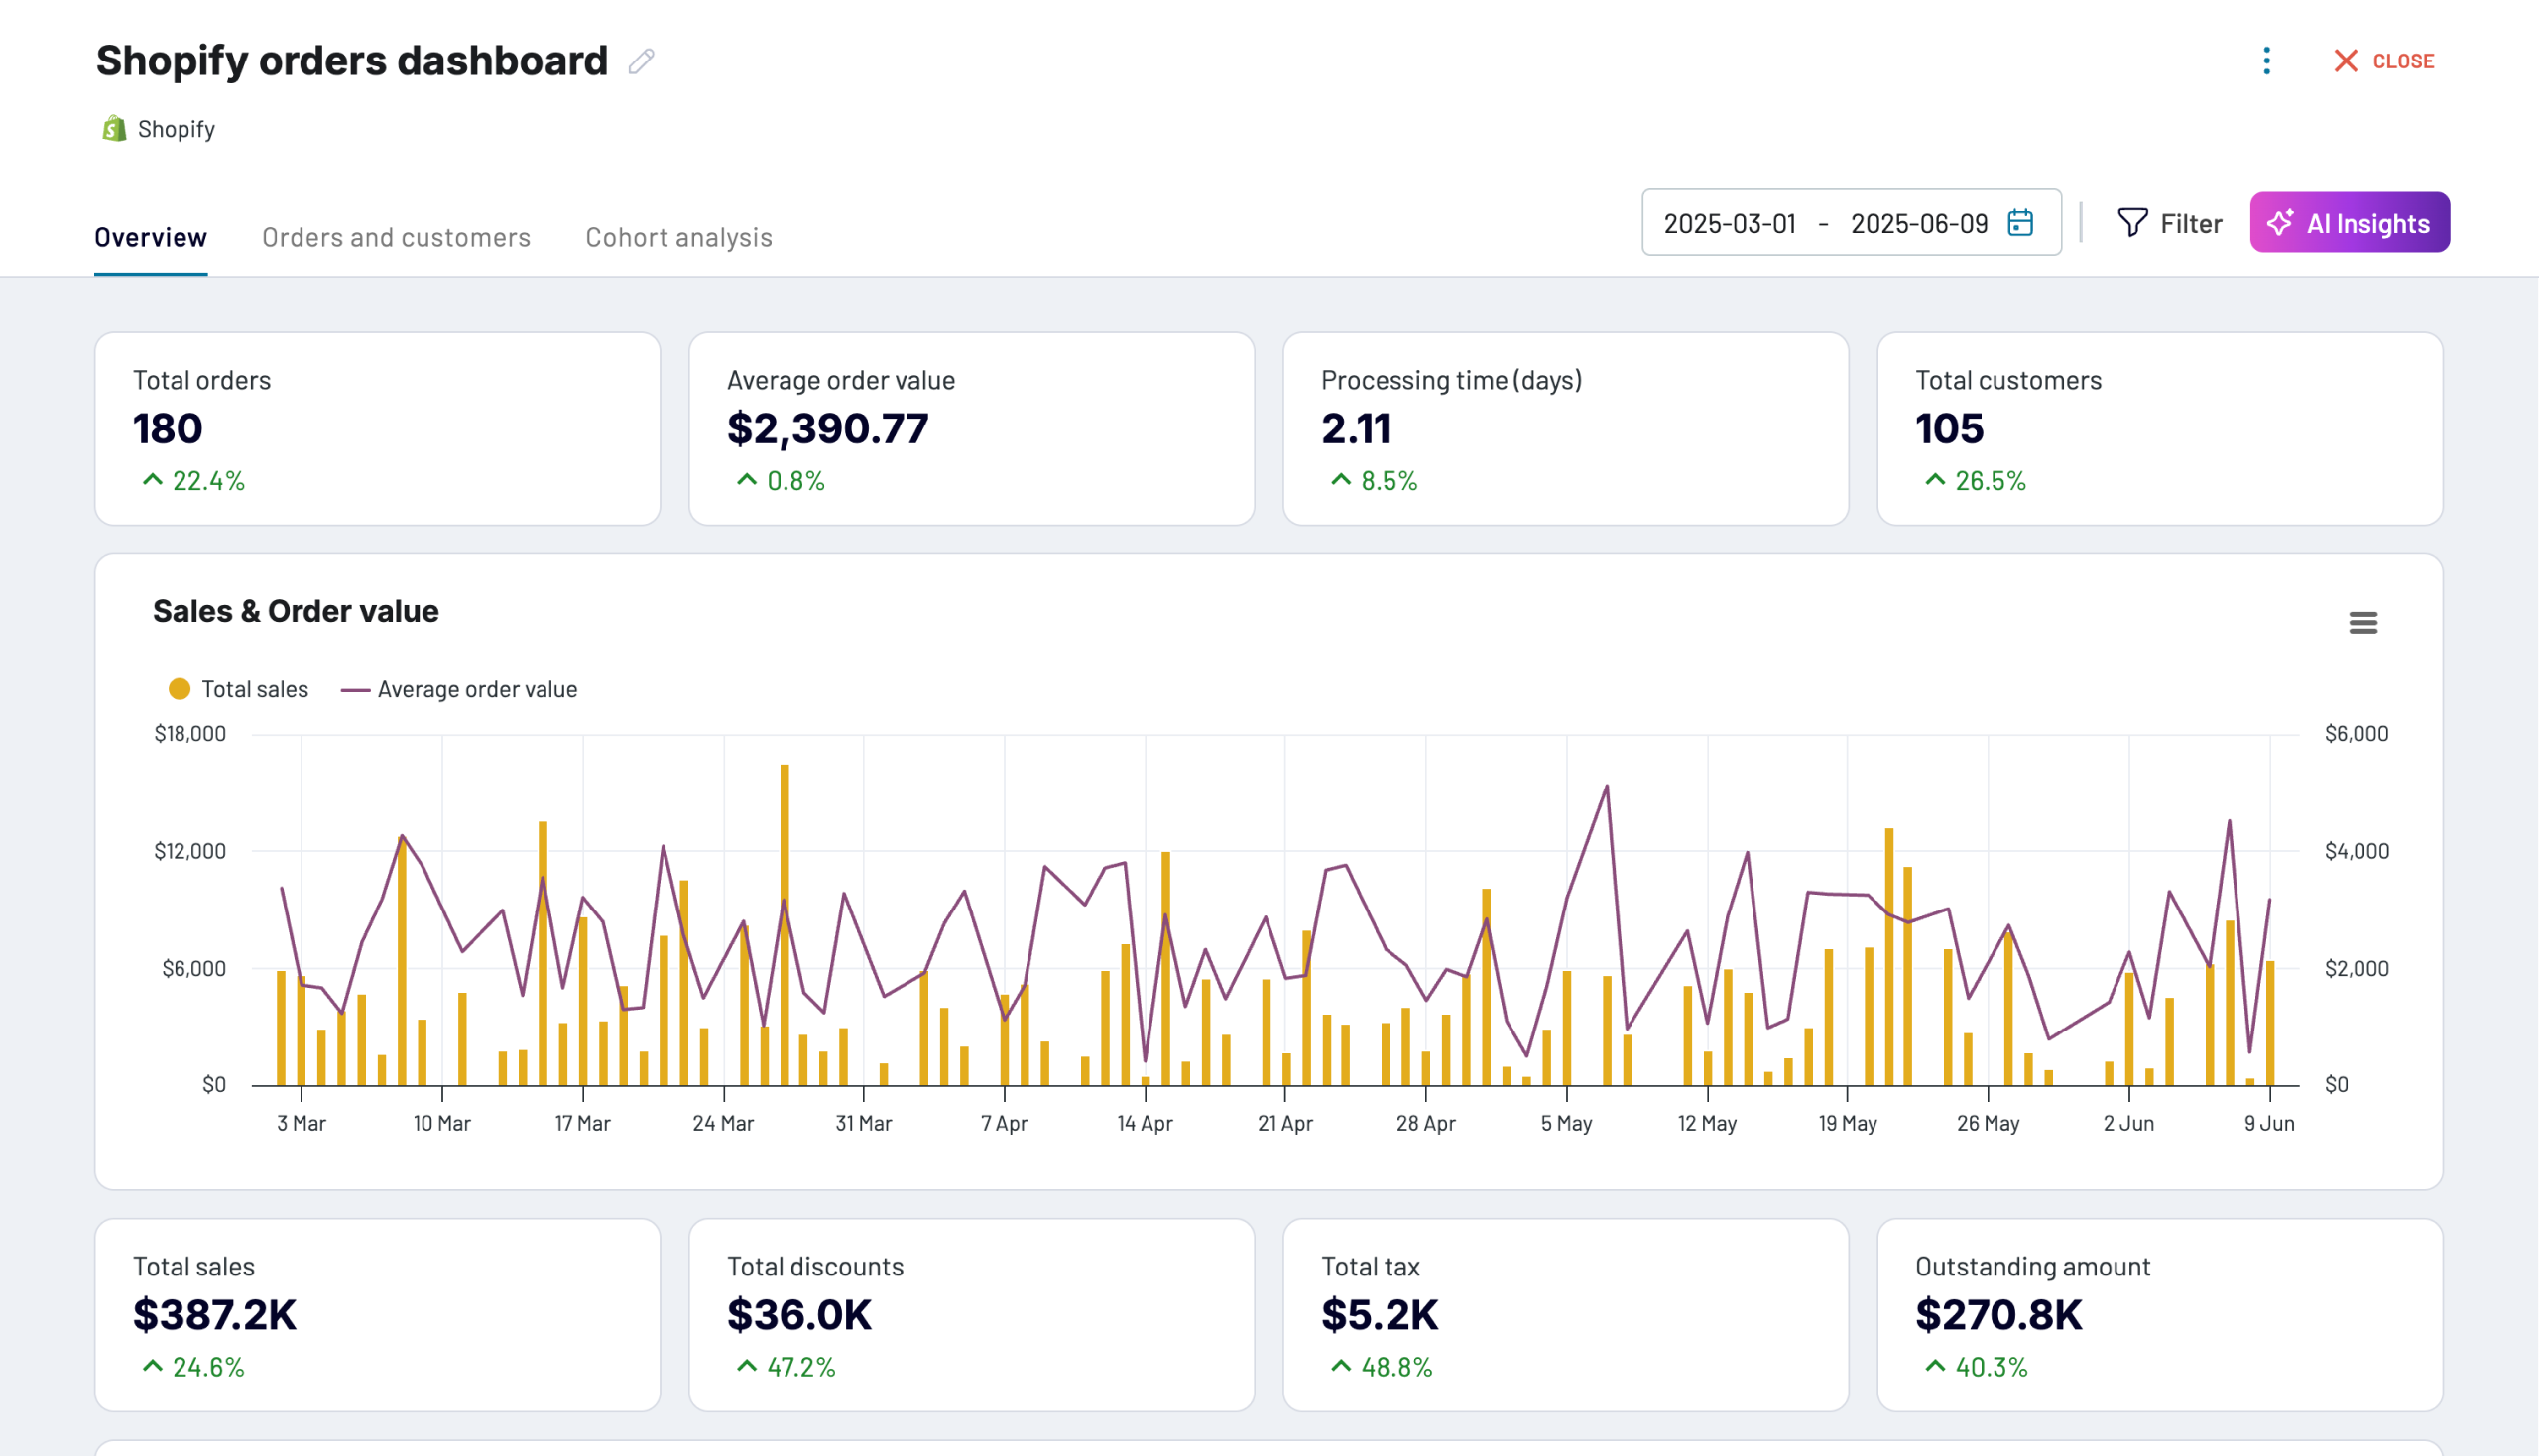
Monitor your e-commerce order flow with comprehensive insights into sales patterns, customer behavior, and fulfillment metrics.

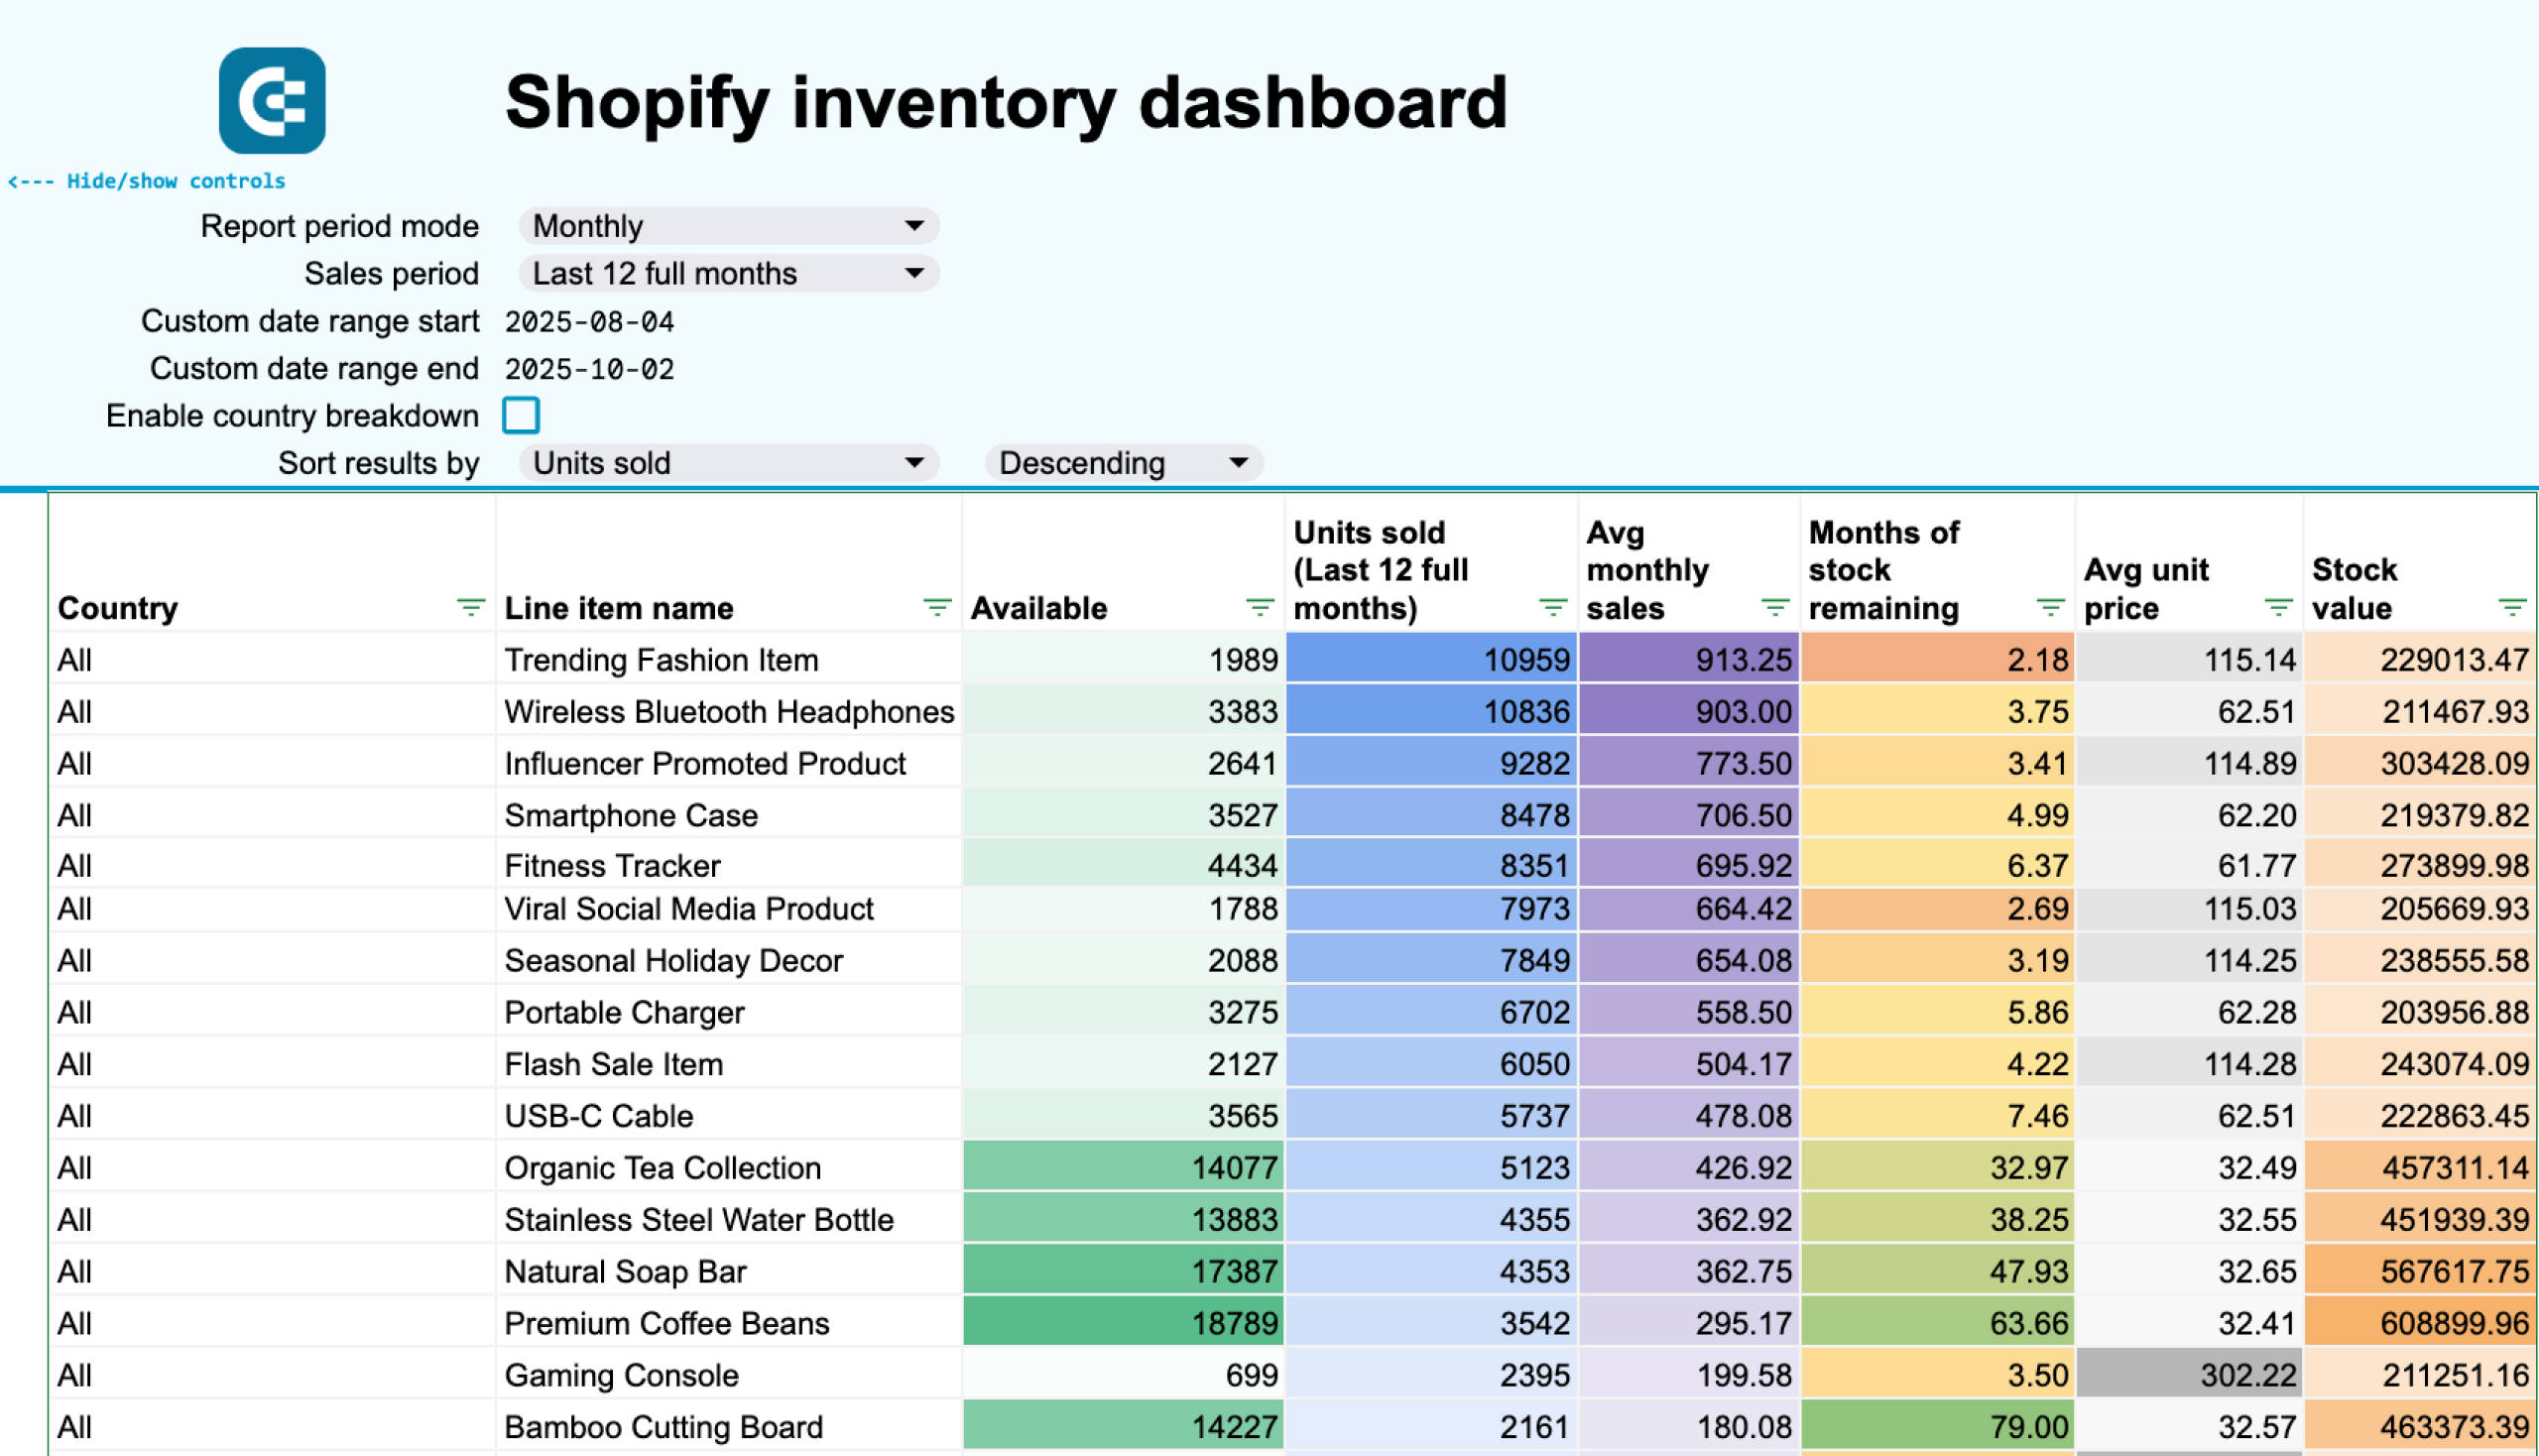
Prevent stockouts and optimize reorder timing with predictive inventory analytics for your Shopify store. Track stock levels, calculate stockout probabilities, get automated reorder recommendations, and analyze sales patterns by location to maintain optimal inventory across all products.

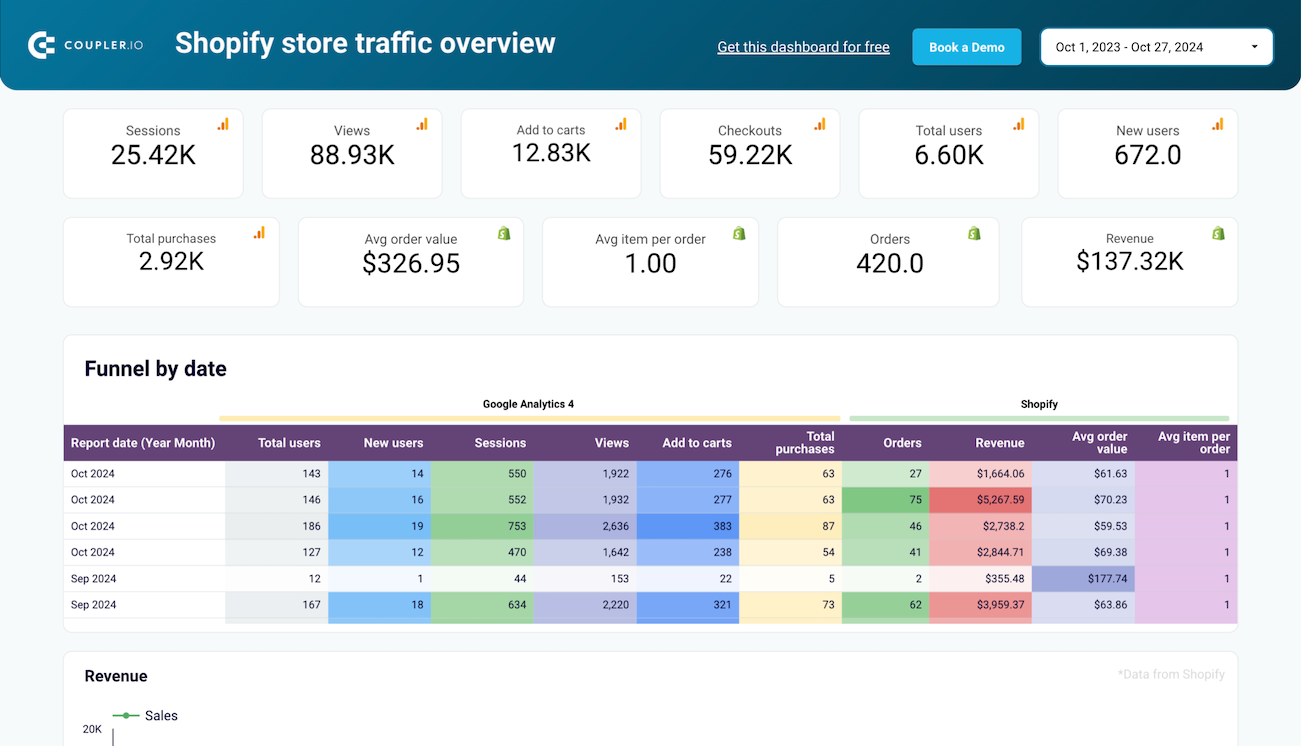
Get an overview of the traffic coming to your Shopify store based on information from Google Analytics 4.


about your case. It doesn't cost you a penny 😉
Data set templates gallery
Measure your Shopify store's ability to retain customers by tracking returning customer rates over time. Analyze the balance between new and returning customers across daily, weekly, and monthly views to evaluate loyalty program effectiveness and identify opportunities to improve customer lifetime value.
Forecast inventory stockouts over the coming months by analyzing available quantity, sales pace, and stock duration in months.
Predict potential stockouts by analyzing current inventory levels against weekly sales velocity. Use this data to proactively manage stock replenishment, prevent lost sales due to out-of-stock items, and maintain optimal inventory levels across your product catalog.
Predict potential stockouts by analyzing current inventory levels against daily sales velocity. Use this data to proactively manage stock replenishment, prevent lost sales due to out-of-stock items, and maintain optimal inventory levels across your product catalog.
Evaluate the performance of individual product variants in your Shopify store to understand which sizes, colors, or styles resonate most with customers. Analyze sales trends across multiple timeframes to optimize inventory levels, pricing strategies, and product offerings for each variant.
Analyze top-performing sales sources in Shopify to understand which channels drive the most revenue and customer acquisition. Track performance across daily, weekly, and monthly views to optimize your marketing budget allocation and focus on the most effective traffic sources.
Identify your highest-value customers in Shopify by analyzing purchasing behavior and spending patterns. Use this data to build targeted loyalty programs, personalize marketing campaigns, and strengthen relationships with your most profitable customer segments.
Monitor Shopify orders grouped by fulfillment status to evaluate operational efficiency and delivery timelines. Analyze daily, weekly, and monthly patterns to optimize warehouse operations, reduce processing delays, and enhance the customer delivery experience.
Analyze Shopify orders grouped by financial status to monitor payment processing and revenue collection. Track weekly and monthly trends to identify potential issues with pending or authorized payments and optimize cash flow management.
Understand your sales distribution across different billing locations to identify high-performing geographic markets. Analyze daily, weekly, and monthly trends by country to optimize regional marketing strategies and expand into promising markets.
Track Shopify’s total customer count and average order value over time using aggregated views and detailed order-level insights.
Identify your best-selling products in Shopify by analyzing product performance across daily, weekly, and monthly trends. Track sales metrics to understand which items drive the most revenue and optimize your inventory and marketing strategies accordingly.
Understand the revenue split between new and returning customers in your Shopify store to evaluate customer acquisition effectiveness and retention performance. Compare sales trends across daily, weekly, and monthly views to track how each customer segment contributes to your overall sales over time.
Get the full information about each line item of every order in your Shopify shop
Get crucial data about your Shopify shop's orders with line items with just one data connection
Monitor shipping, customer, and other details for each order in your Shopify shop to quickly assess the current state
Access Shopify sales data grouped by order and date to monitor trends and evaluate revenue performance.
Examine the performance of Shopify line items alongside COGS and gain a deeper understanding of profitability, taxes, and other critical metrics.
Combine Shopify sales data with Google Analytics 4 behavioral insights to understand the complete customer journey from site visit to purchase. Track monthly metrics to identify long-term trends and optimize user experience and conversion strategies.
Combine Shopify sales data with Google Analytics 4 behavioral insights to understand the complete customer journey from site visit to purchase. Track weekly metrics to identify mid-range trends and optimize user experience and conversion strategies.
Combine Shopify sales data with Google Analytics 4 behavioral insights to understand the complete customer journey from site visit to purchase. Track daily metrics to connect website engagement with actual sales outcomes and optimize both user experience and conversion strategies.
about your case. It doesn't cost you a penny.
Why Shopify users love Coupler.io?
Calculate true ROAS
Track profitability
Don't just track LTV—act on it
Auto-refresh your reports
Move beyond basic revenue
Inventory at a glance
Get Insights and Take Action

Integrate Shopify with these destinations


What data you can export from Shopify?
-
Orders
-
Products
-
Inventory
-
Customers
-
Products with variants
-
Orders with line items
-
Orders with activities
-
Order fulfillments with line items
-
Orders with shipping lines
-
Orders refunds transactions
Connect 400+ sources in minutes.
No code required.


We help teams turn data into impact

#1 trading journal Tradezella retained 2.5x more customers with the use of data


ClaritySeed saved over 40 hours a month on marketing reporting with Coupler.io


Bulungula Incubator, cut reporting time by 70% with Coupler.io


SellThru cut client onboarding by 5–7x, boosted tracking accuracy to 95%+, and saved 20+ hours a month on reporting.
