Setup data integration within seconds
 Google Ads
 Power BI
Connect Google Ads to Power BI with Coupler.io to simplify reporting
Get and prepare data effortlessly
With Coupler.io, you can automatically export Google Ads to Power BI, even if you have no experience in coding. Transform your PPC data in multiple ways, make your reports self-update on a chosen schedule, and add data from numerous accounts or apps.
Automate reporting tasks
Take only a few simple steps to connect Google Ads to Power BI. Leave manual efforts behind, create reports on data from various advertising channels, and turn imported records into easily understandable dashboards by using our free templates.
Stand out as a data-driven expert
Spend less time on reporting thanks to Coupler.io's advanced analytics capabilities. Show your professionalism to clients and stakeholders by quickly delivering impactful reports while putting more effort into tasks of strategic importance.
Export data from Google Ads to alternative destinations
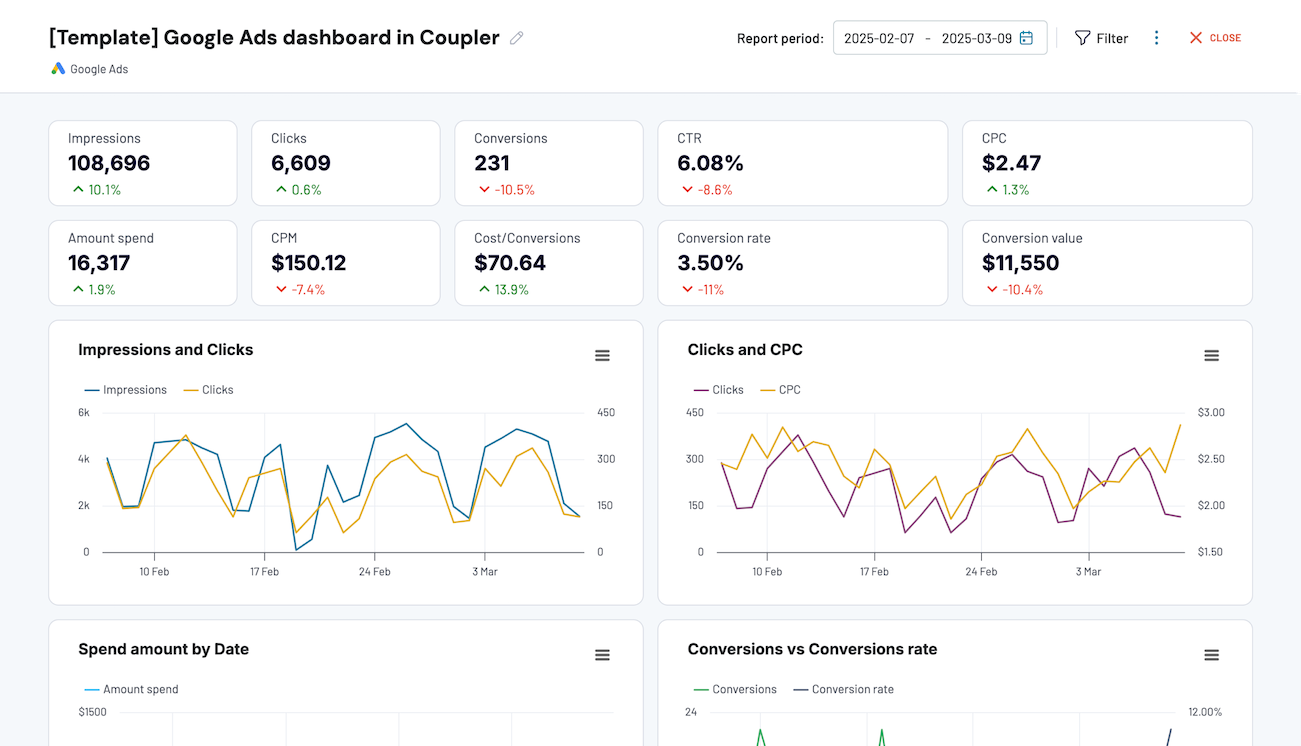
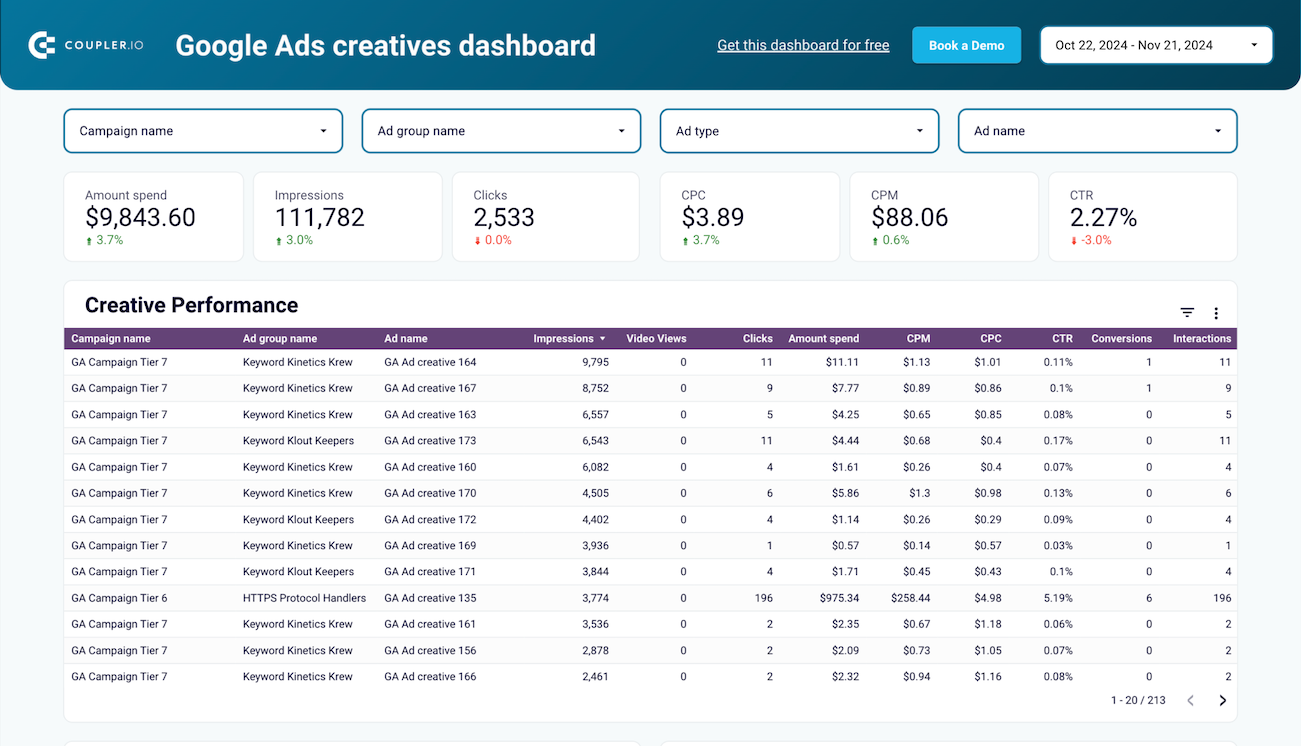
Quick start with PPC dashboard templates
Export Google Ads to Power BI automatically with just a few clicks.
Connect similar PPC apps and get data in minutes
What to export from Google Ads to Power BI
How do you export Google Ads to Power BI?
Pricing plans
- Monthly
- Annual (save 25%)
Keep your data safe
Coupler.io safeguards your shared information and data transfers from breaches, leaks, and unauthorized disclosures.
How to export Google Ads to Power BI (detailed guide)
Step 1: Collect data
To begin with, authorize your Google Ads account. Next, specify the Ad accounts from where you'd like to load data. Then, select the Report type, which is the particular data type you'll export.
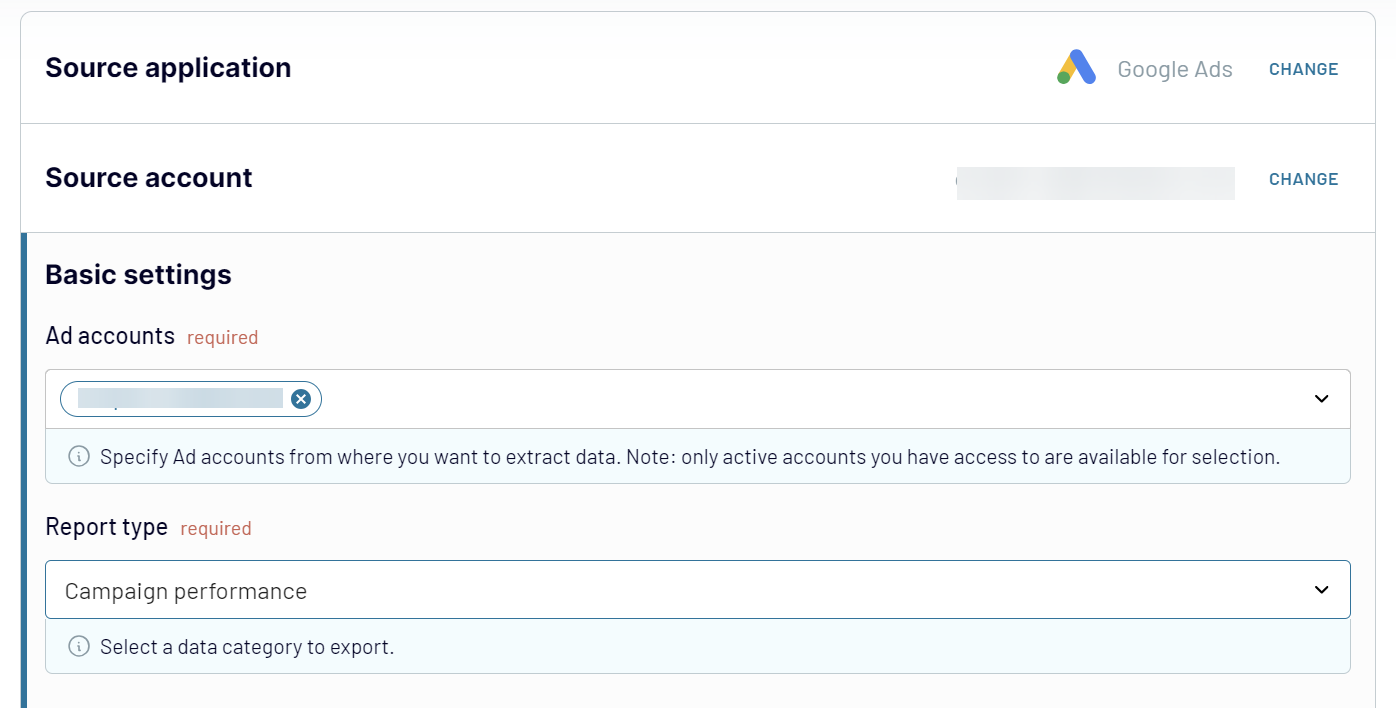
After adjusting the source settings, click Finish and proceed, and then press Transformations to go to the next step.
Step 2: Organize and transform
Have a look at your data before transferring it from Google Ads to Power BI. If you'd like to make some changes, there are several data transformations to choose from:
- Edit, rearrange, hide, or add columns.
- Filter and sort data in the preferred order.
- Create new columns with custom formulas.
- Combine data from different accounts or apps.
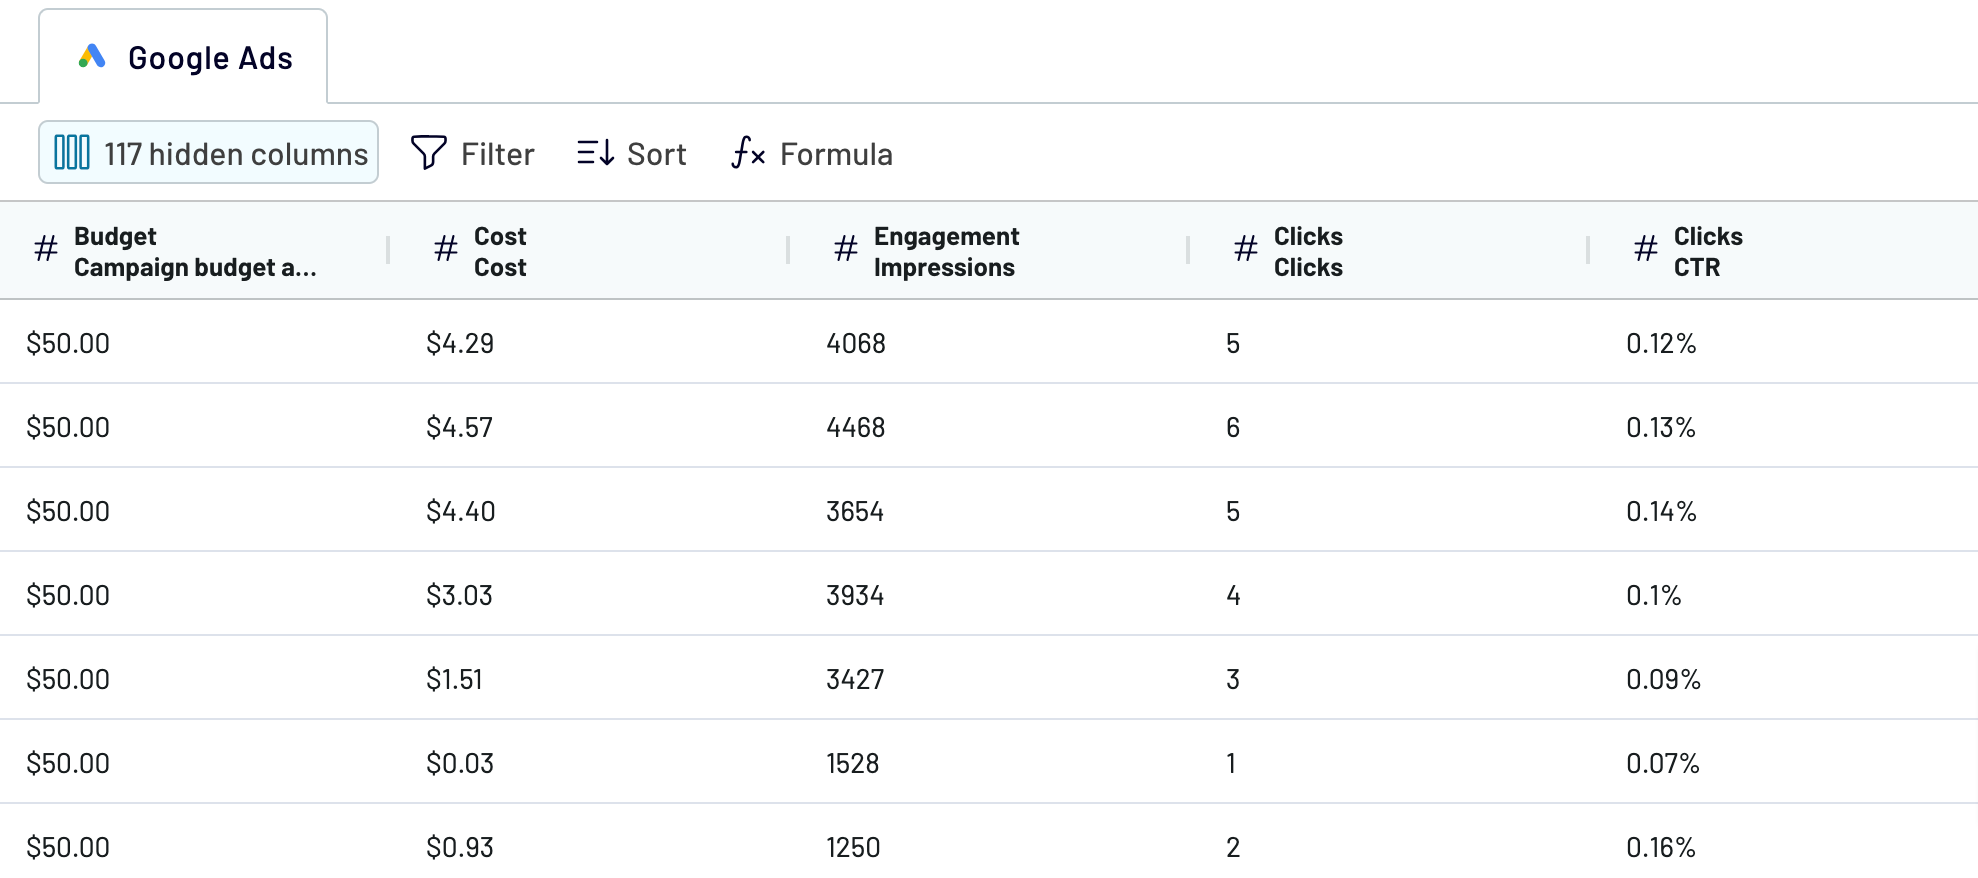
Once you've checked the accuracy of the data, proceed by clicking Destinations.
Step 3: Load and automate
To export Google Ads to Power BI, follow the in-app instructions to generate the integration URL and paste it into the Power BI desktop app.
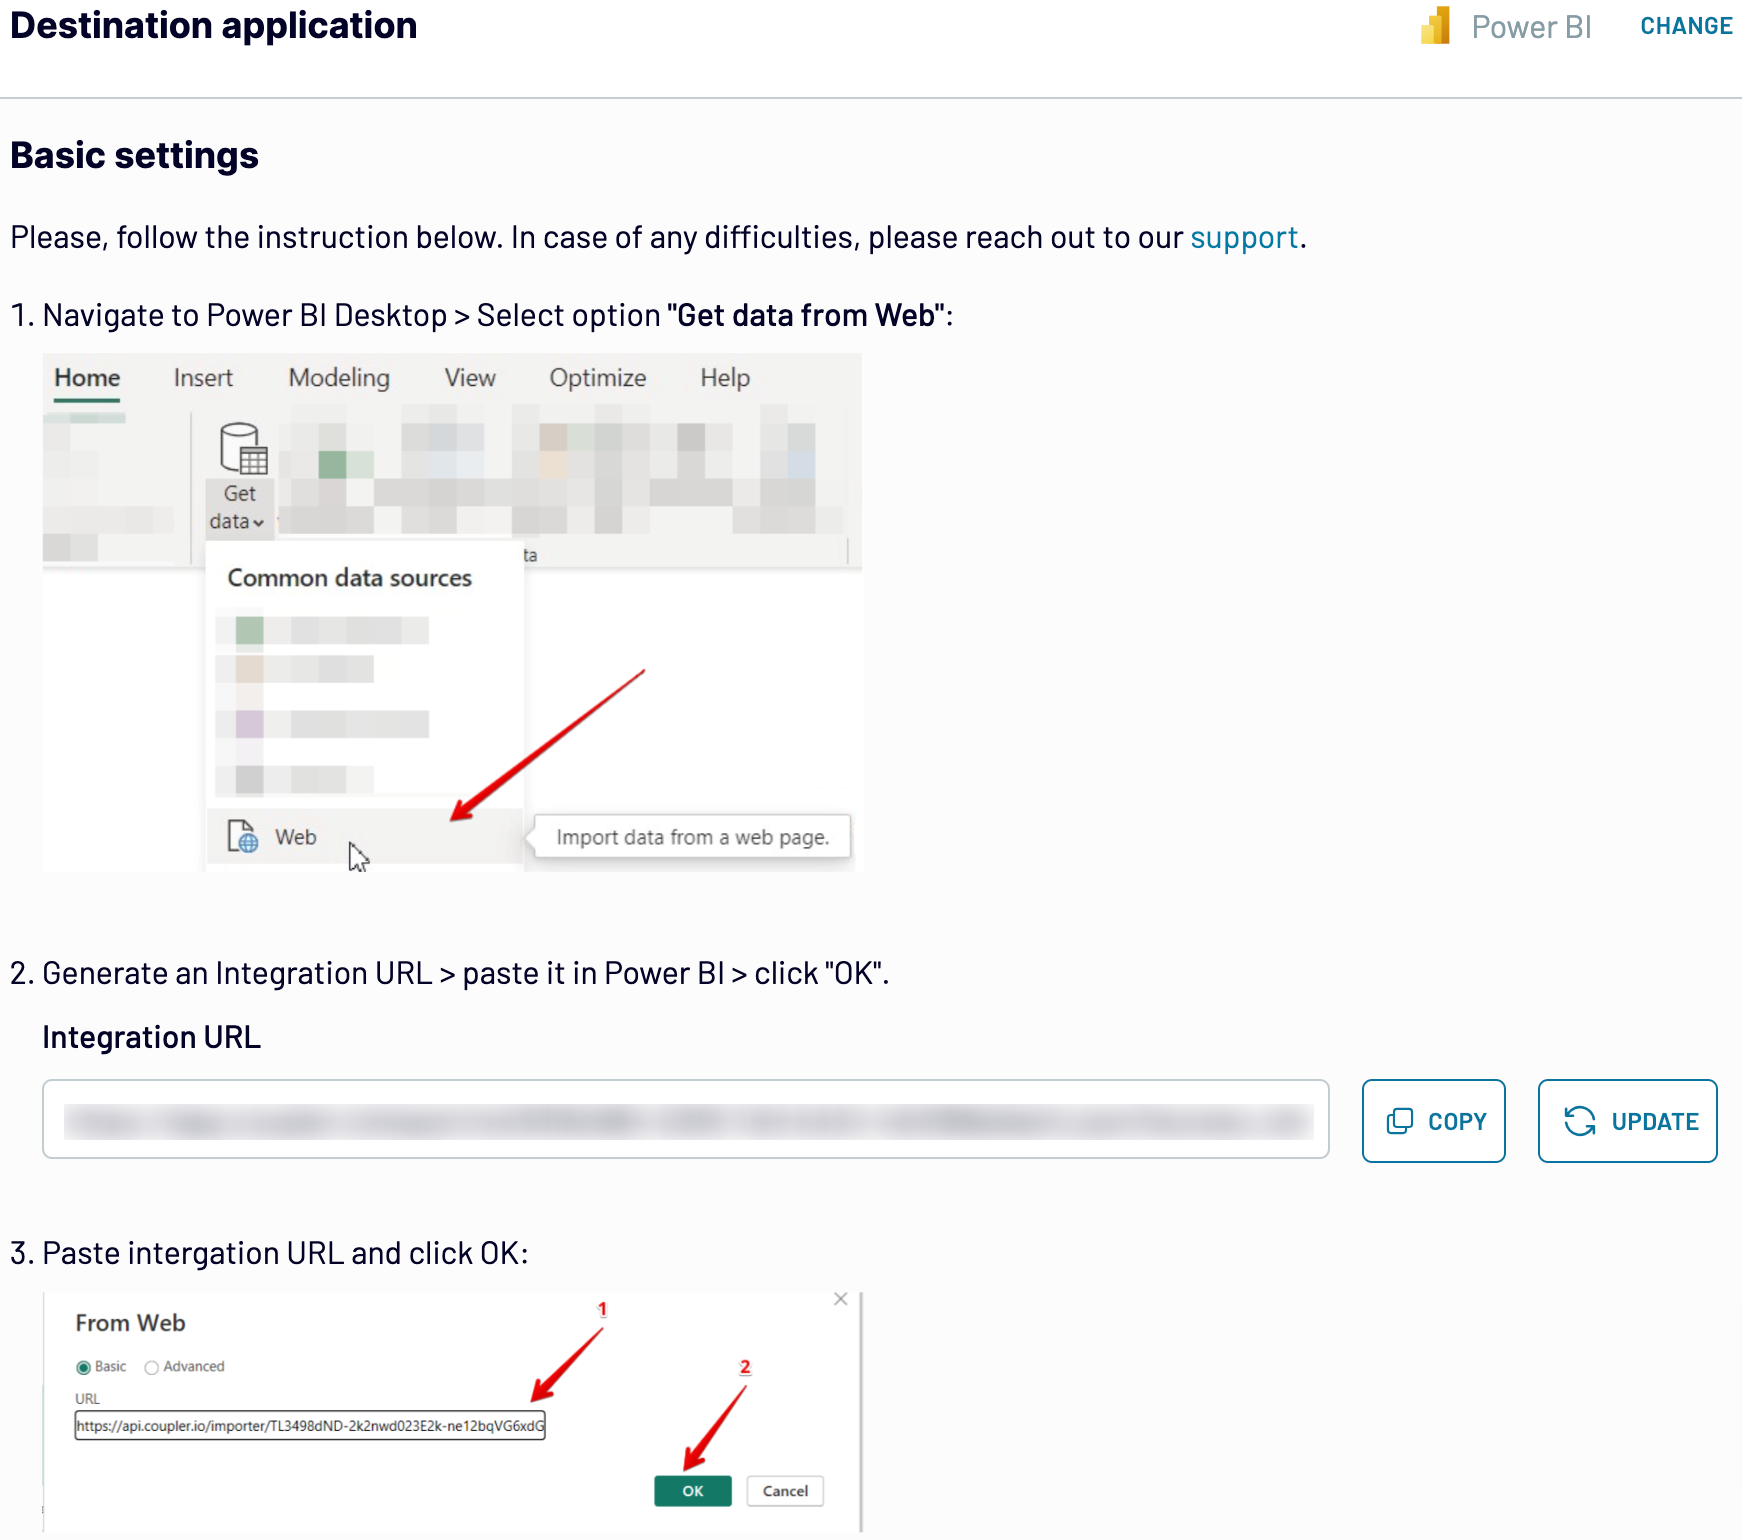
Go back to Coupler.io and click Set a schedule to enable Automatic data refresh. Specify the preferred interval for automated updates in the respective drop-down field. Then, press the Save and run importer button.
Connect Google Ads to Power BI and automate data exports on schedule

You can be confident that your report is regularly updated and accurately reflects constant changes in the source data.
Replace or append the data you export from Google Ads to Power BI
Additionally, you can blend data from different source applications, such as combining Google Ads records with figures from other advertising channels. Once you've configured the necessary sources and progressed to the Transformations step, you can do the following:
- Append: Merge data elements from one source into another, with identical column names between datasets.
- Join: Combine datasets side-by-side, with at least one identical column name in each dataset.
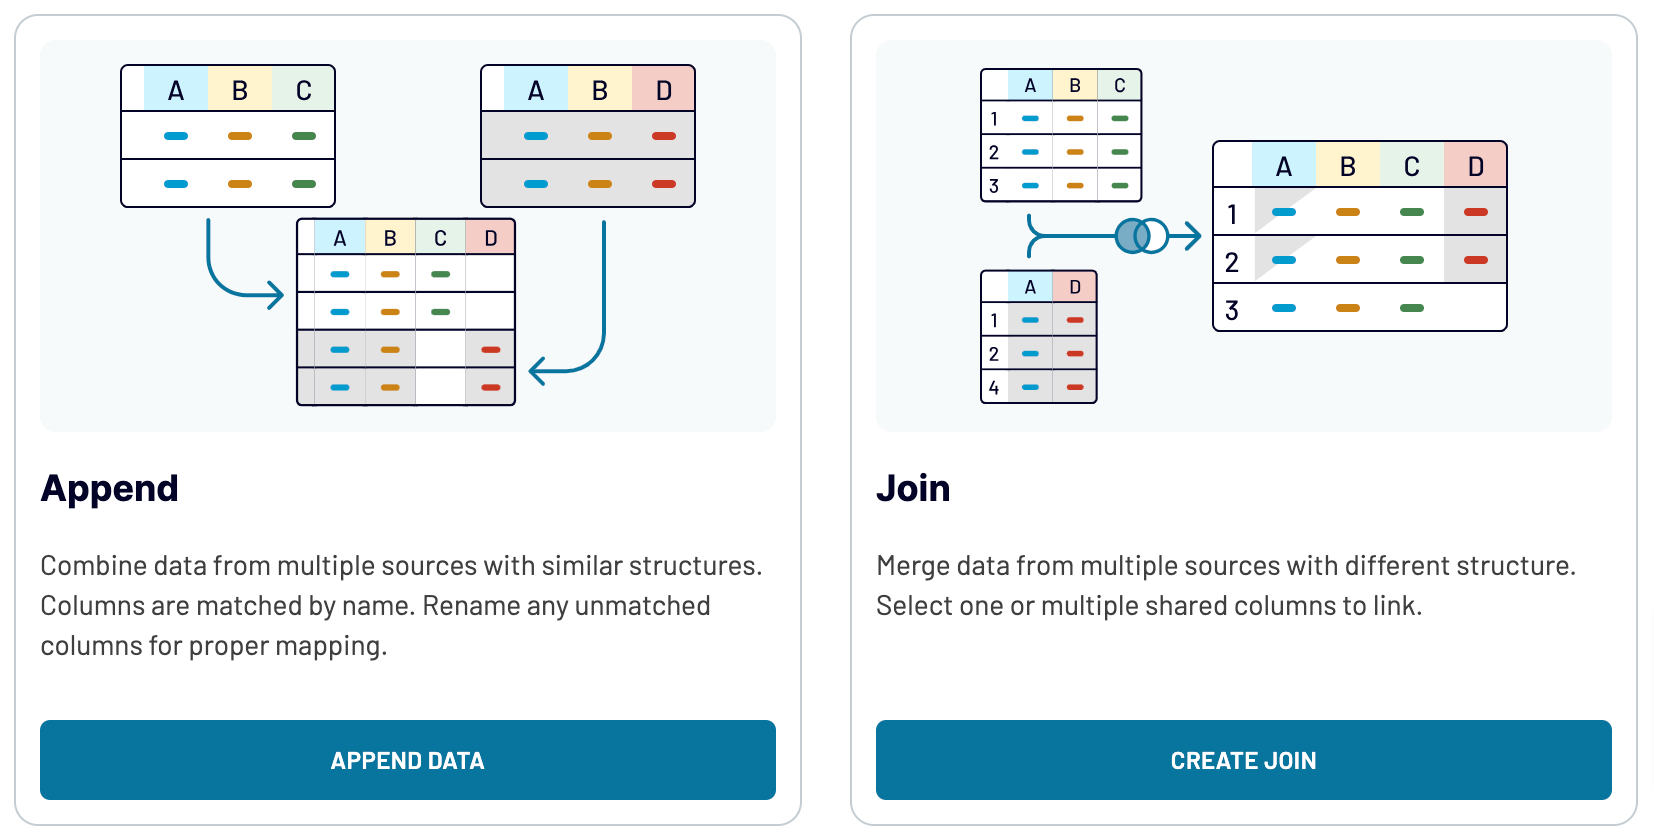
By doing so, you can extract data from various advertising channels to get a broader perspective on your ad performance.
What key metrics can you export from Google Ads to Power BI?
Description: Impressions refer to the number of times your ad is displayed on a user's screen, regardless of whether it's clicked or not.
How to calculate: Count the total number of times your ad appears on a user's screen during a specified period.
Clicks
Description: Clicks represent the number of times users click on your ad.
How to calculate: Count the total number of clicks your ad receives during a specified period.
CTR (click-through rate)
Description: CTR is the ratio of clicks to impressions, expressed as a percentage. It measures the effectiveness of your ad in encouraging users to click.
How to calculate: Divide the number of clicks by the number of impressions, then multiply by 100.
Campaign budget amount
Description: The campaign budget amount is the total budget set for a specific advertising campaign.
How to calculate: Determine the total amount allocated for the campaign over its duration.
Cost
Description: Cost refers to the total expenditure incurred for running the ad campaign, including the amount spent on clicks and impressions.
How to calculate: Sum up the total cost accrued during the campaign, typically based on the cost-per-click or cost-per-impression model.
Conversions
Description: Conversions represent the desired actions taken by users after clicking on your ad, such as making a purchase, signing up for a newsletter, or filling out a form.
How to calculate: Count the total number of completed actions that are defined as conversions for your campaign.
Import data from Google Ads to Power BI or another destination
- Spreadsheet apps: Google Sheets and Microsoft Excel.
- Data warehouses: BigQuery, PostgreSQL, and Redshift.
- Other business intelligence (BI) tools: Tableau, Looker Studio, and Qlik Sense.
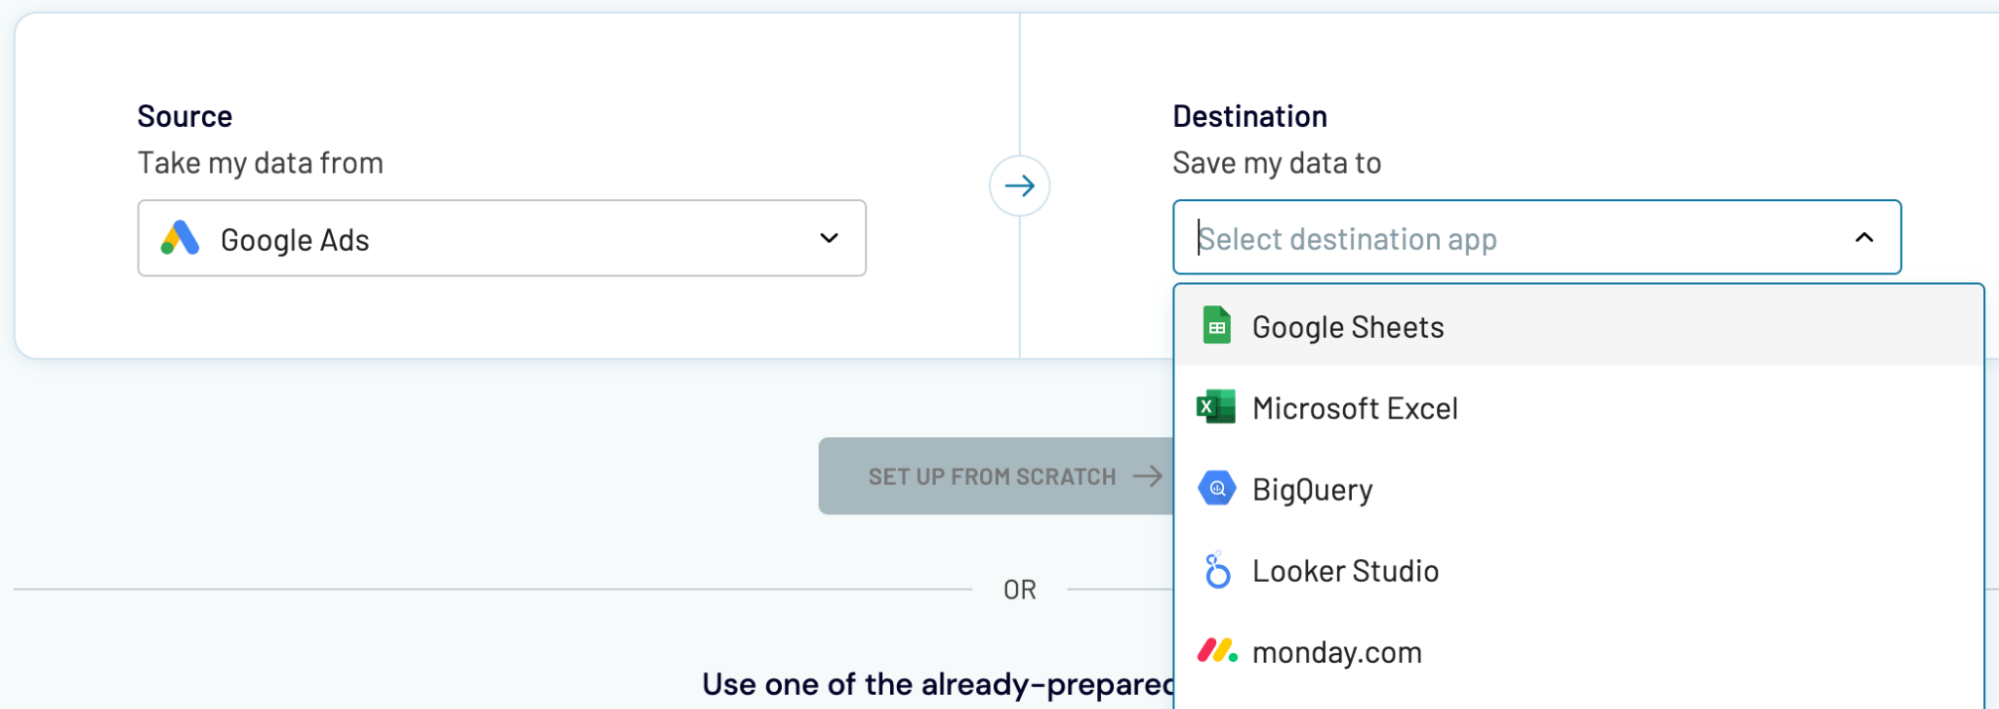
Importing Google Ads data into these apps is quick and uncomplicated, just as we explained earlier for Power BI.


