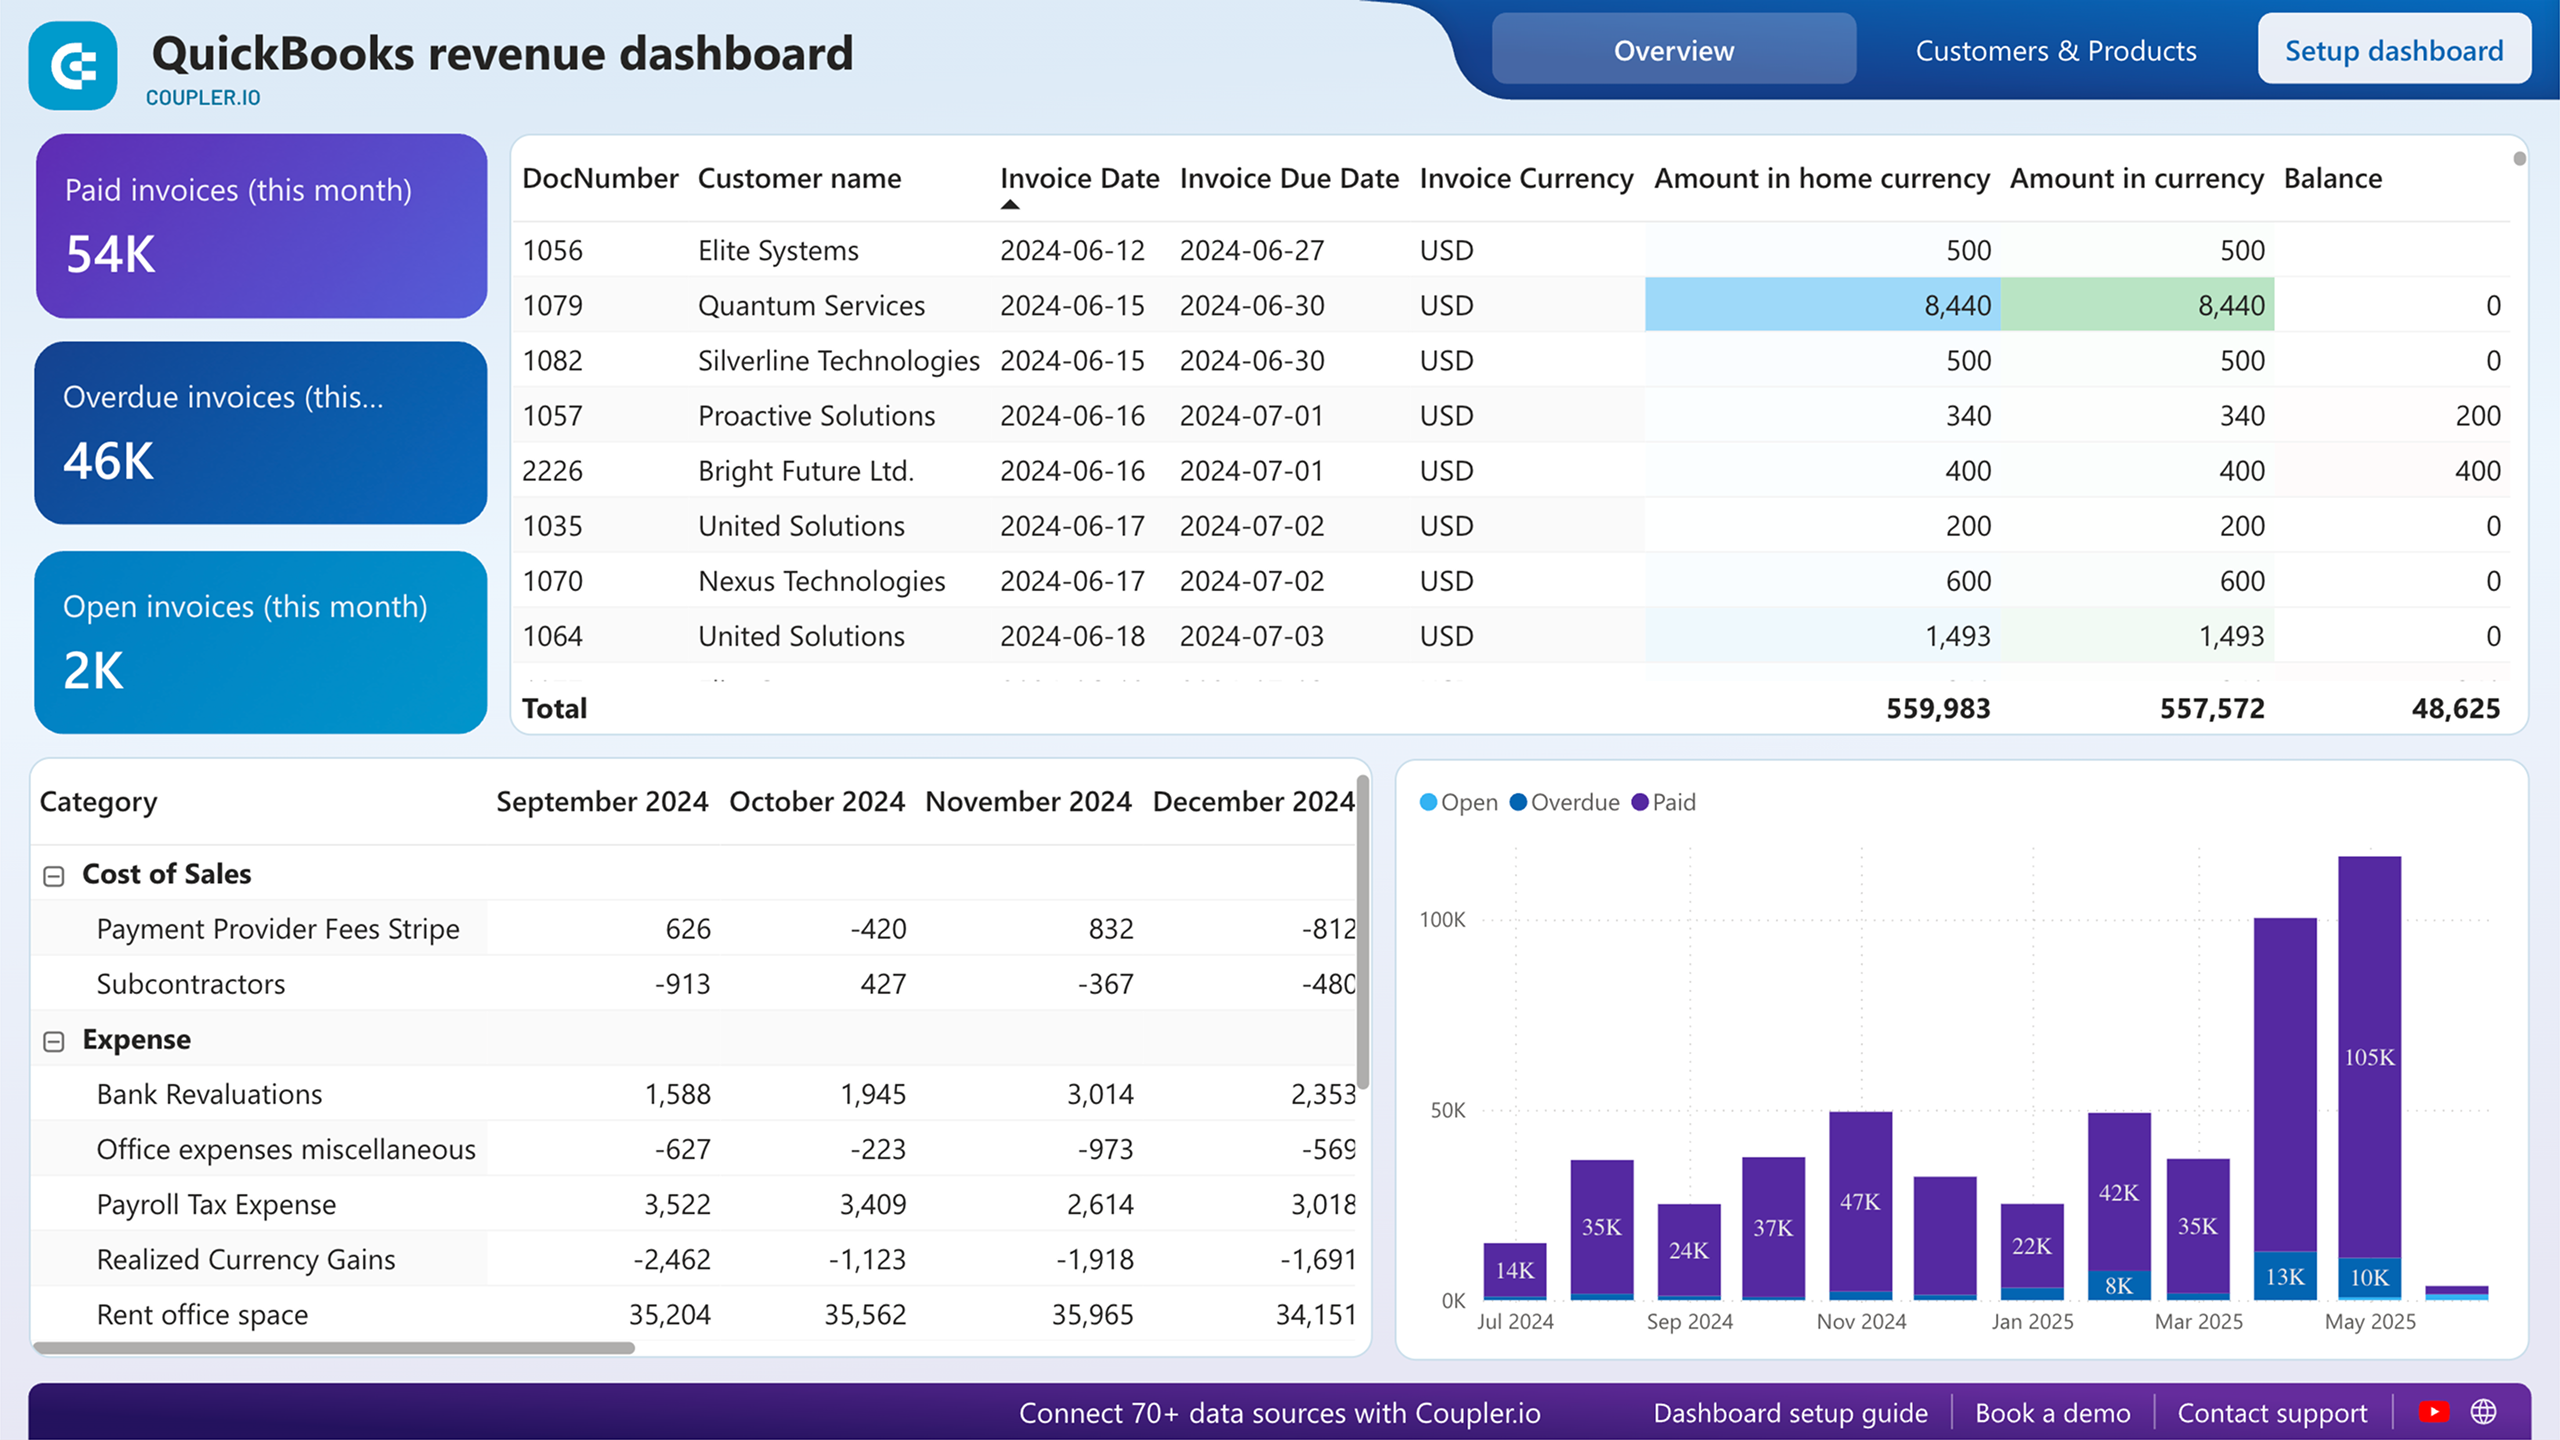
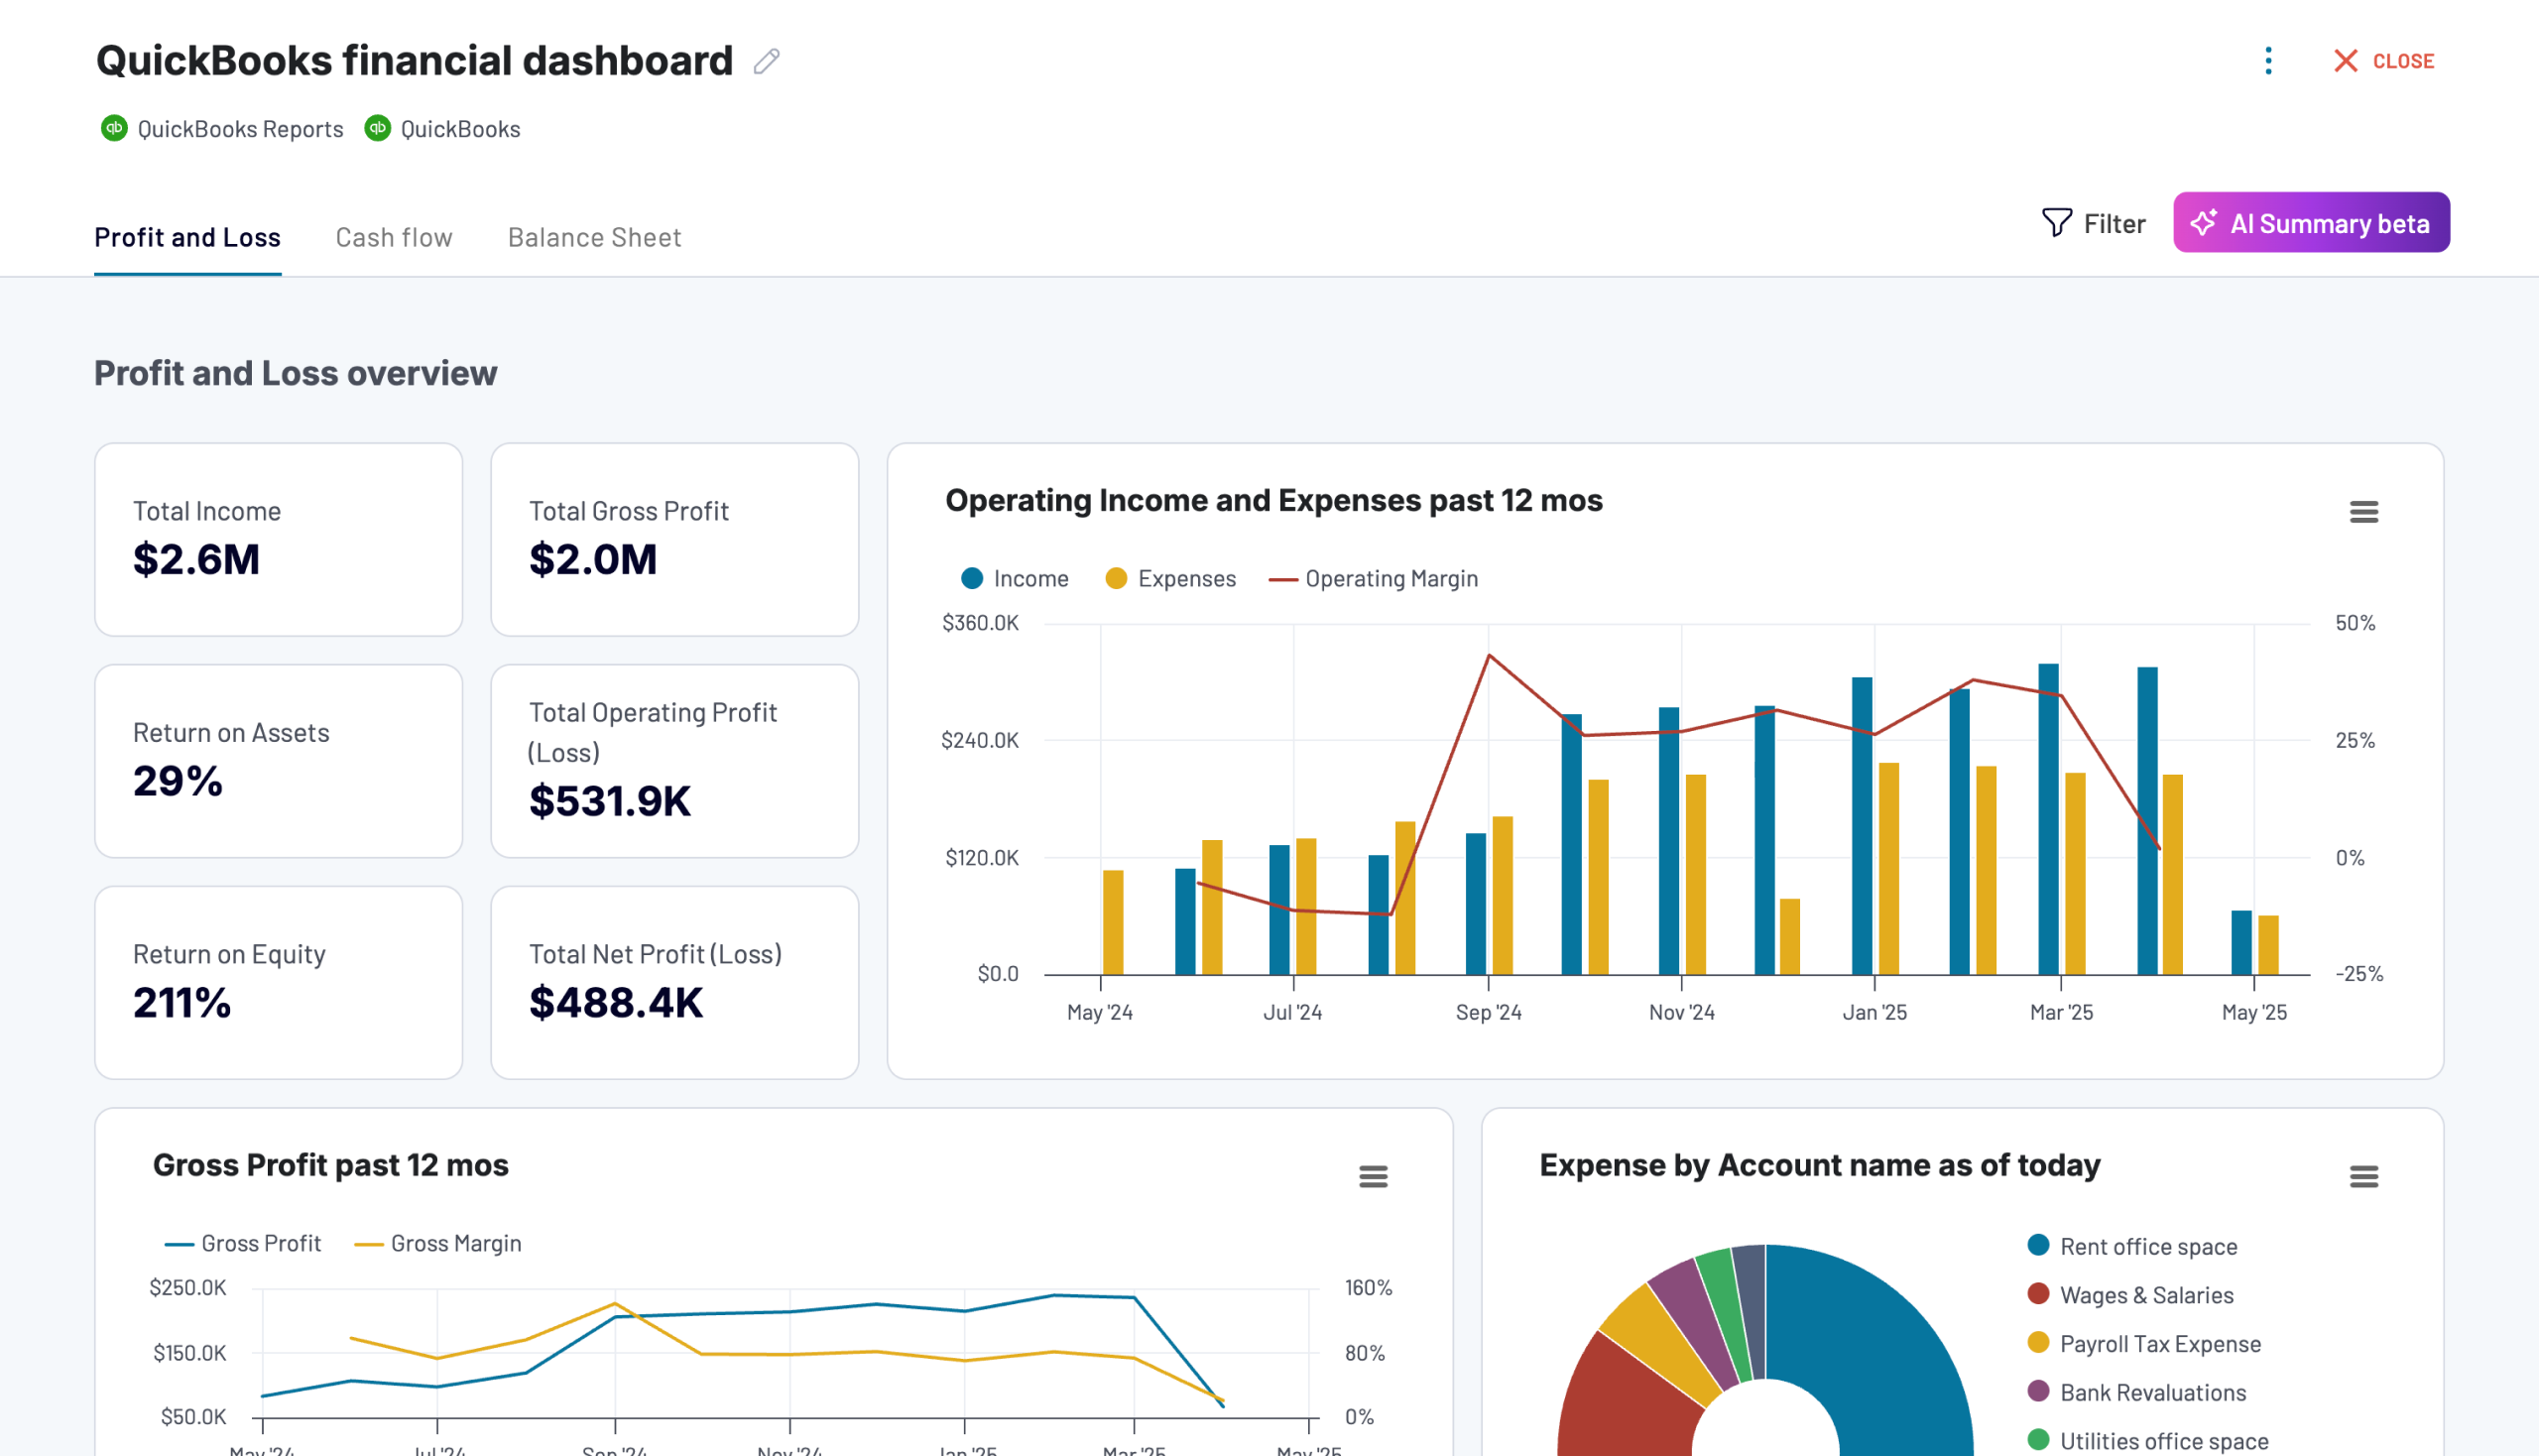
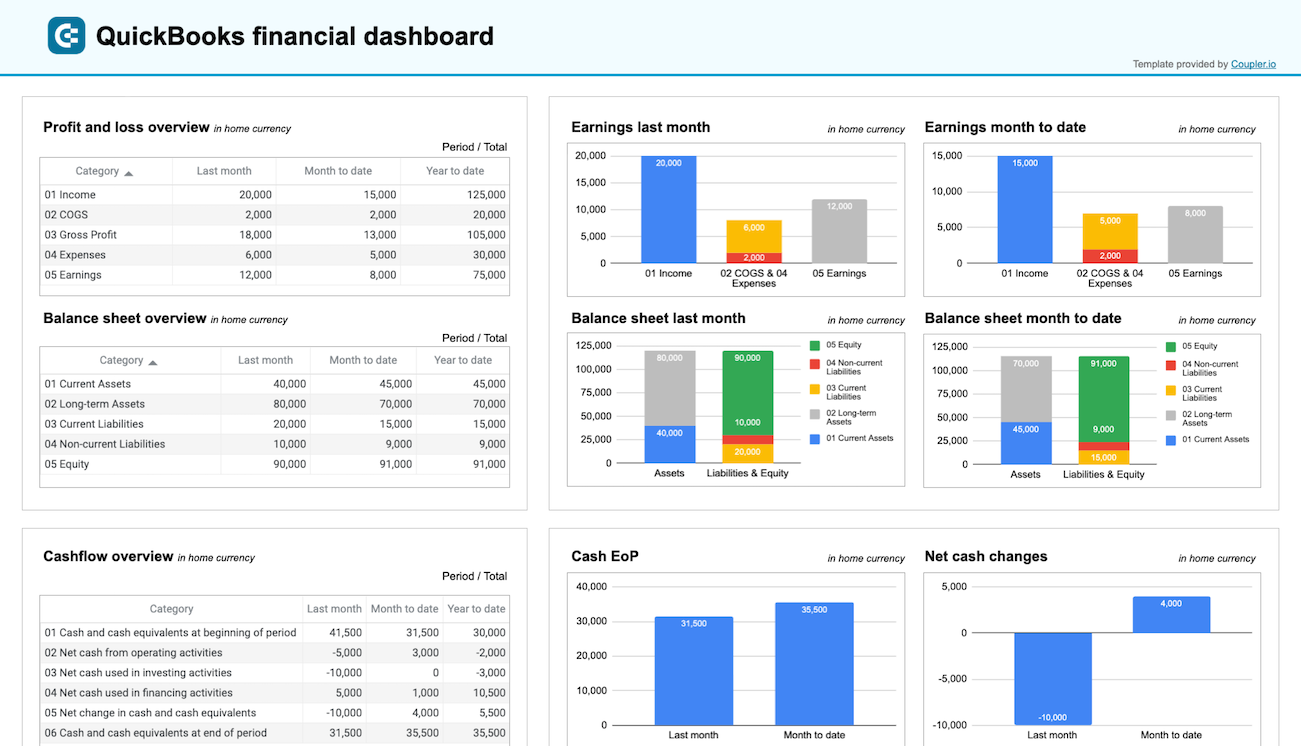
Connect QuickBooks to Power BI with Coupler.io to simplify reporting
Get and prepare data effortlessly
Export QuickBooks to Power BI without any coding skills at hand. Transform your data in multiple ways, customize a schedule for auto-updates, and combine records from numerous sources in a single web application.
Automate reporting tasks
Coupler.io lets you easily automate data imports from QuickBooks to Power BI. Minimize the manual effort you spend on reporting and have your data visualized with our free templates of dynamic interactive dashboards.
Stand out as a data-driven expert
Prove your expertise to clients and stakeholders by delivering near real-time, illuminating reports. Thanks to Coupler.io's analytics, you can free up your schedule from manual data imports and perform strategic tasks instead.
Export data from QuickBooks to alternative destinations
Quick start with Finance dashboard templates
about your case. It doesn't cost you a penny 😉
Automate data exports from QuickBooks to Power BI with just a few clicks.
Connect similar Finance & Accounting apps and get data in minutes
What to export from QuickBooks to Power BI
How do you connect QuickBooks to Power BI?
Pricing plans
- Monthly
- Annual (save 25%)
Keep your data safe
Coupler.io safeguards your shared information and data transfers from breaches, leaks, and unauthorized disclosures.
How to connect QuickBooks to Power BI (detailed guide)
Step 1: Collect data
First, connect your QuickBooks account. Next, select the Data entity – the specific data type you will export.
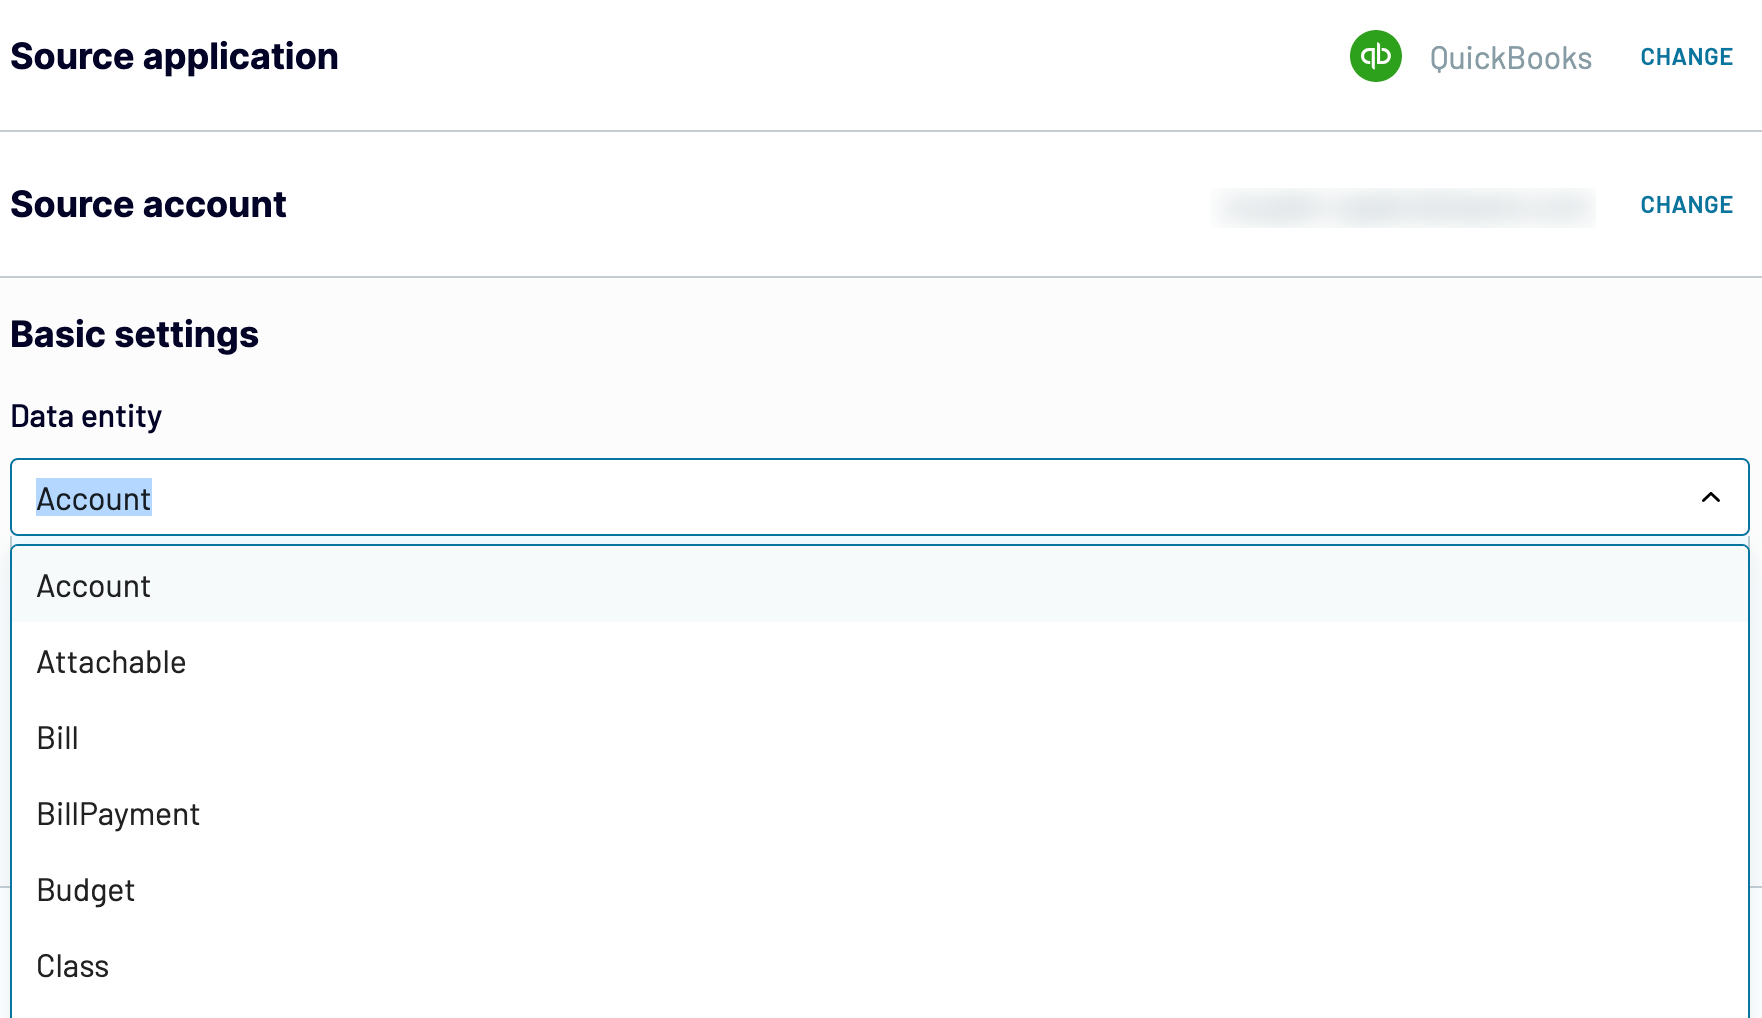
As soon as you make your choice, click Finish and proceed. After that, press Transformations to proceed to the next step.
Step 2: Organize and transform
Before you import QuickBooks to Power BI, preview your data to ensure it's accurate. If you want to, transform your data in the following ways:
- Edit, rearrange, hide, or add columns.
- Apply various filters and sort your data.
- Create new columns with custom formulas.
- Combine data from multiple accounts or apps.
This way, you'll align the data with your reporting requirements.
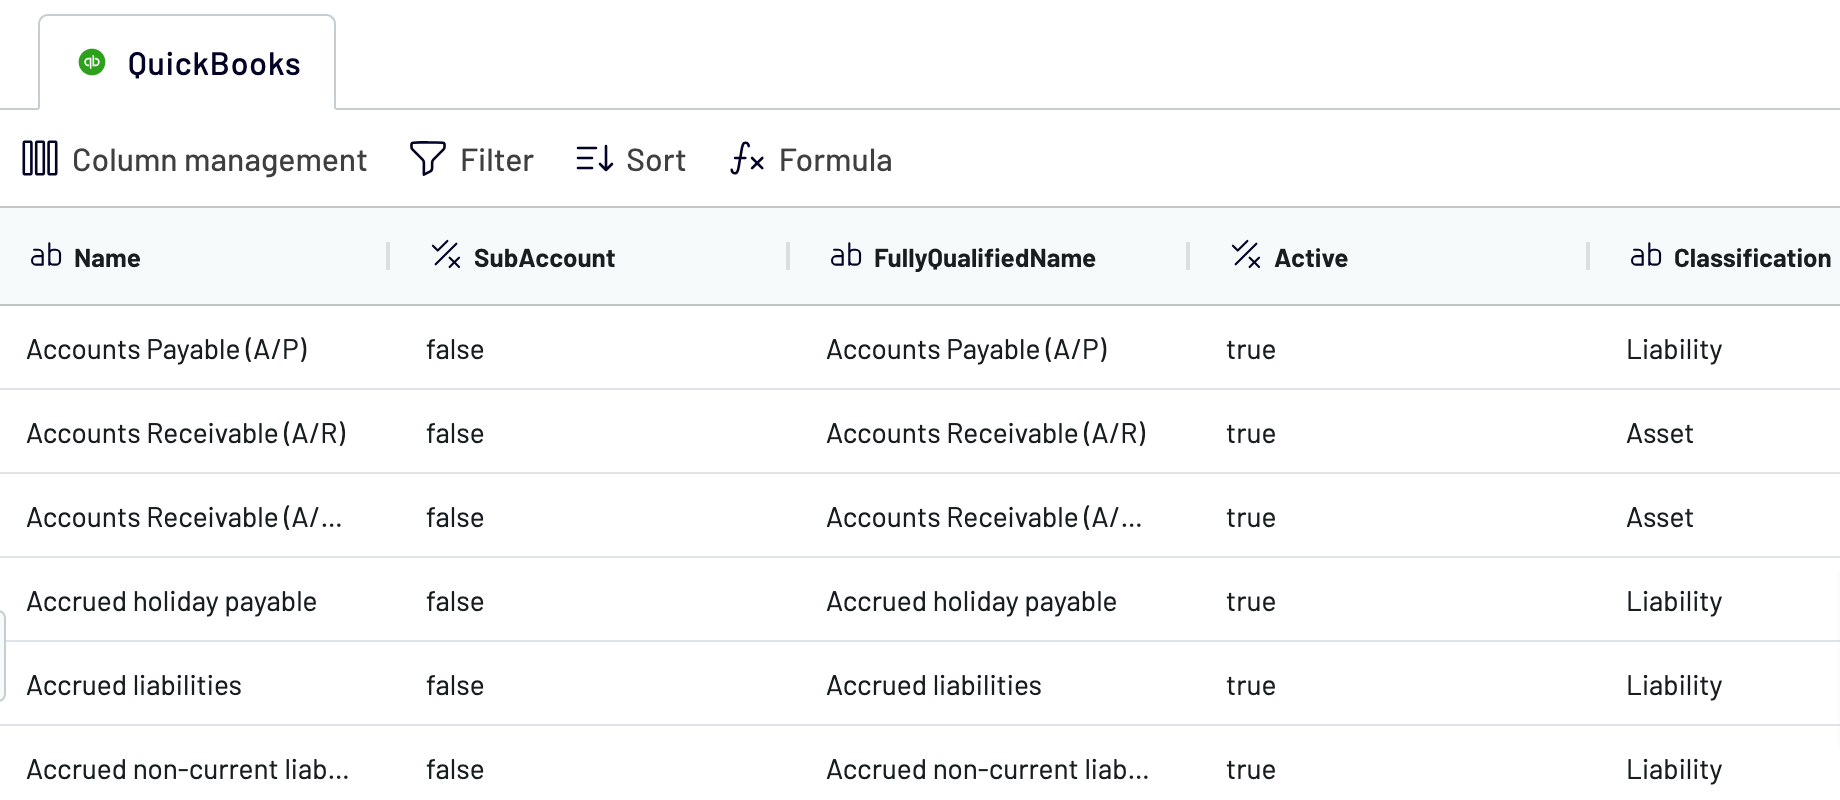
Once you've finished, click Destinations.
Step 3: Load and automate
To finalize data import from QuickBooks to Power BI, follow the in-app instructions to generate the integration URL and paste it into the Power BI desktop application.
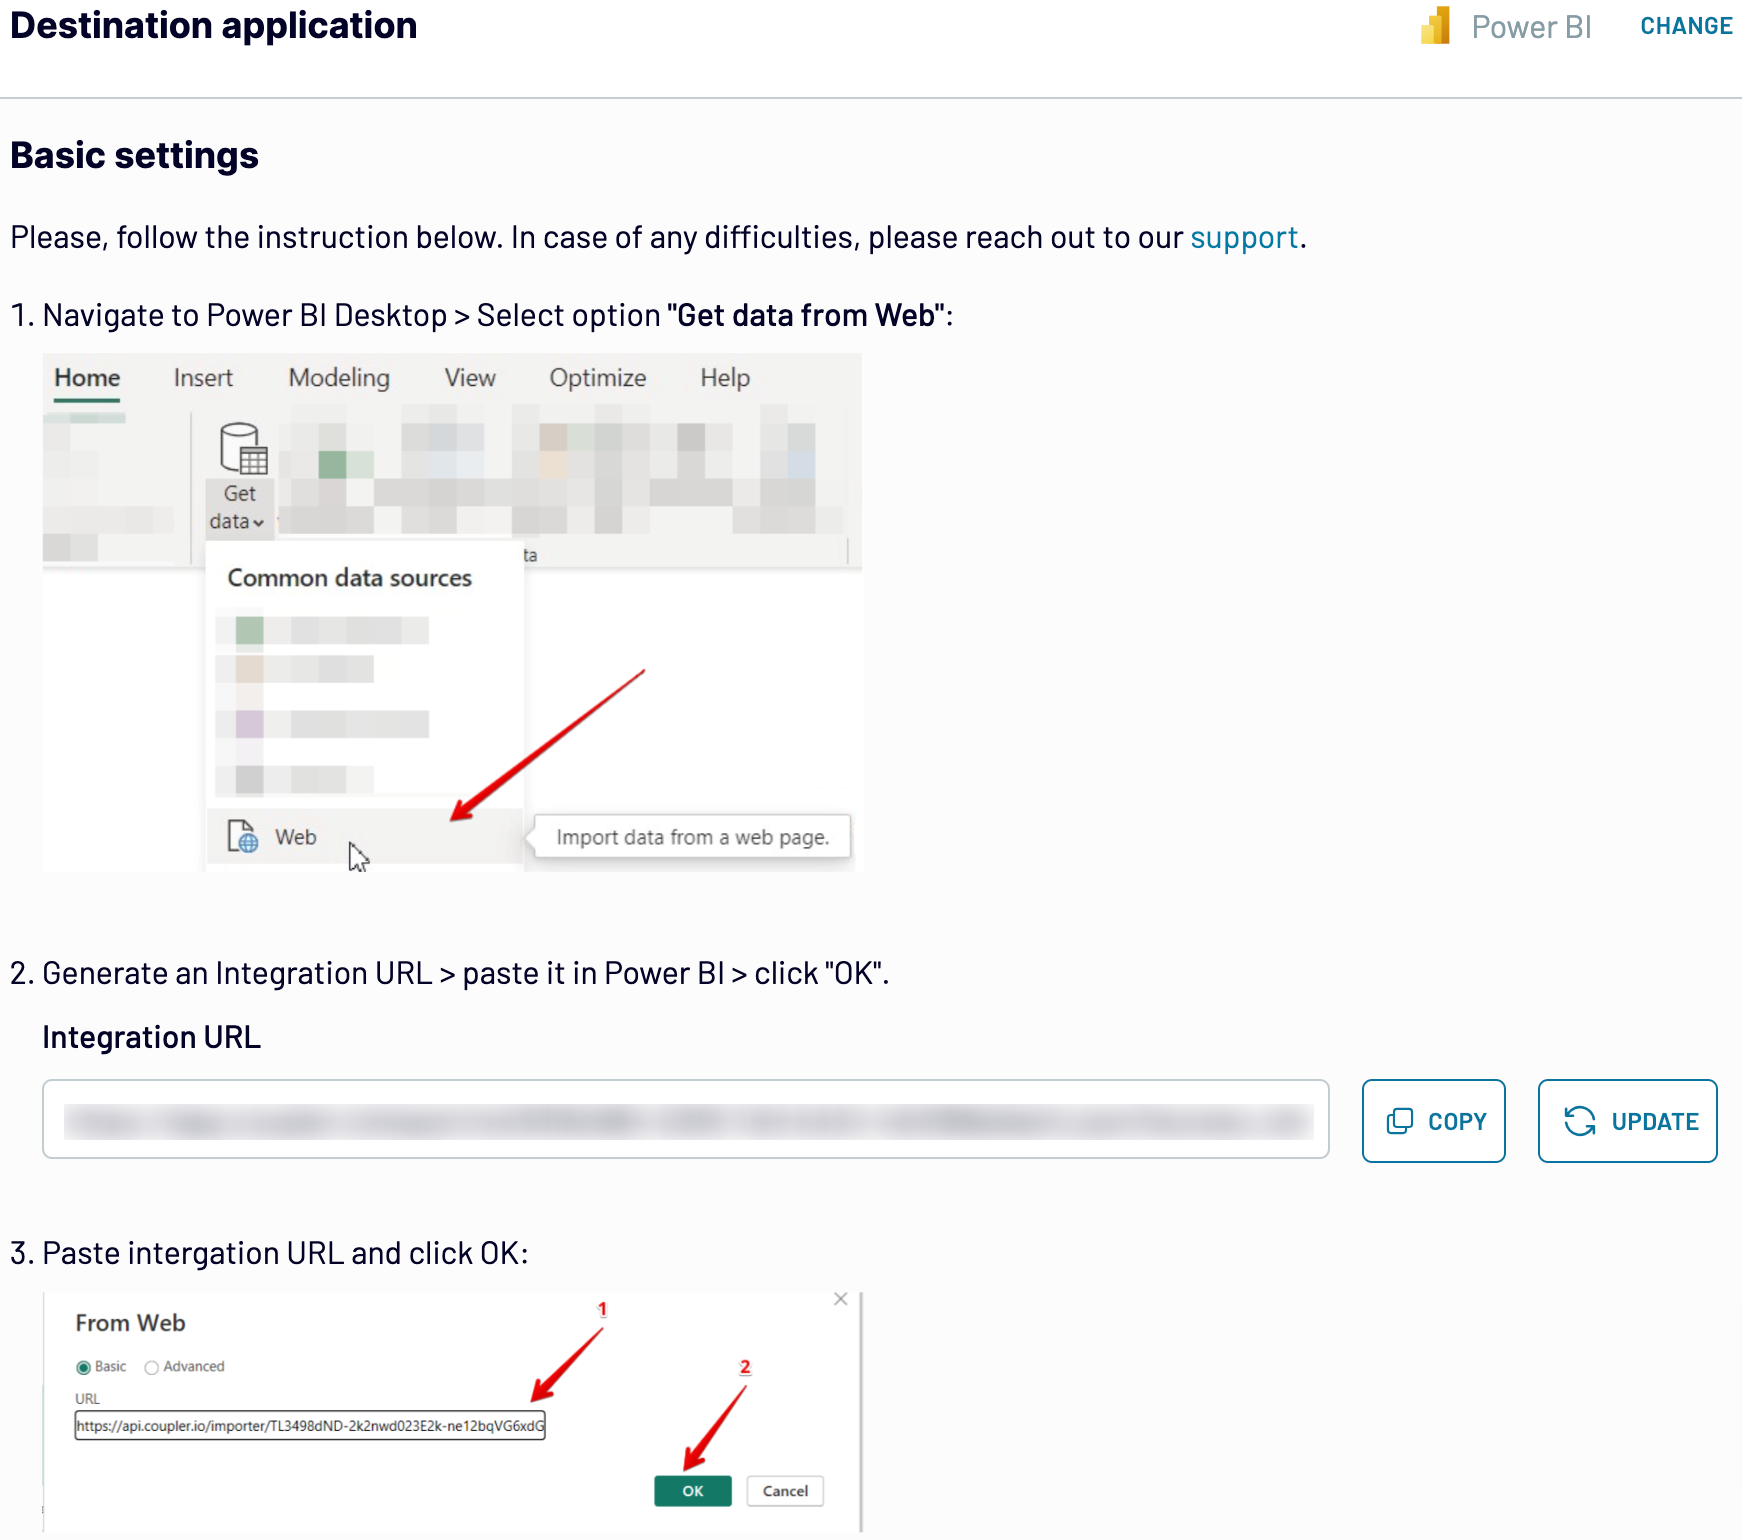
Click Setup a schedule to activate the Automatic data refresh feature and specify the preferred interval. To finish this, click Save and run importer.
Export QuickBooks to Power BI and automate it on schedule

By scheduling auto-refreshes, you ensure your report is constantly aligned with the most recent updates to the source.
What key metrics can you export from QuickBooks to Power BI?
Description: Total income is the total revenue generated from sales, services, or other sources over a particular period.
How to calculate: add up all revenue streams, including sales, services, and other income sources.
Total cost of goods sold (COGS)
Description: Total COGS is the total cost incurred in producing or acquiring the goods sold during a certain period.
How to calculate: sum up the costs of raw materials, labor, and manufacturing expenses associated with goods sold.
Total cost of sales (COS)
Description: Total COS is the total expenses involved in making sales, including direct and indirect costs.
How to calculate: combine the costs of goods sold and any extra expenses related to sales activities.
Gross profit
Description: Gross profit is the difference between total revenue and the total cost of goods sold.
How to calculate: subtract the total cost of goods sold from total income.
Total expenses
Description: Total expenses are all costs incurred in running the business, such as operating or financial expenses.
How to calculate: sum up all expenses during a given period.
Net earnings
Description: Net earnings are the company's total earnings after subtracting all expenses from total income.
How to calculate: subtract total expenses from total income.
Average revenue by customer
Description: Average revenue by customer is the average revenue generated per customer within a particular period.
How to calculate: divide total income by the number of unique customers.
Average price by product
Description: Average price by product is the average selling price of each product or service the company has to offer.
How to calculate: divide the total revenue generated by a certain product by the quantity sold.
Export QuickBooks to Power BI or another destination
- Perform simple and quick reporting in spreadsheet applications: Microsoft Excel and Google Sheets.
- Store, query, and analyze QuickBooks records in data warehousing software: BigQuery, PostgreSQL, and Redshift.
- Visualize your data with alternative business intelligence (BI) tools: Looker Studio, Tableau, and Qlik Sense.
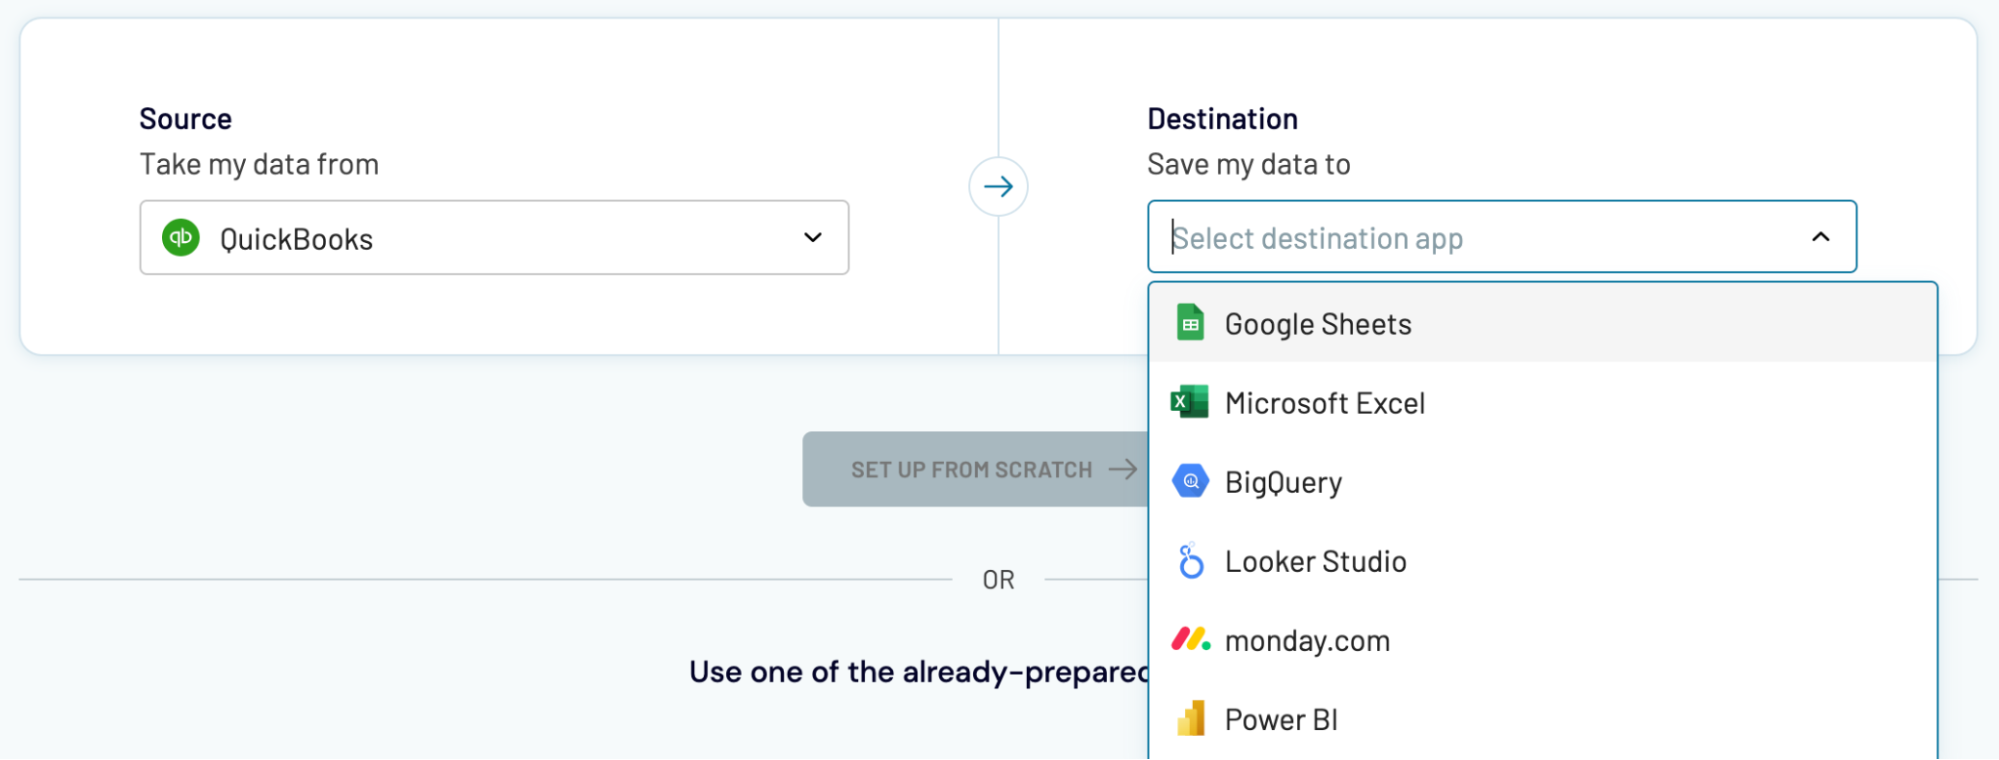
There's little to no difference between importing QuickBooks data into Power BI, as demonstrated earlier and loading it into alternative destinations.


