TikTok Ads Connector
Integrate TikTok Ads with spreadsheets, data warehouses, or BI tools to build up a reliable reporting system for efficient decision-making. Get an all-in-one solution to gather, transform, understand and automate your TikTok Ads data without any hassle.


Analyze your TikTok Ads data easier
Collect data on a scheduled basis and blend it with information exported from other applications.

Manage and create new columns, apply filters, and perform other data transformations before loading it into the destination.

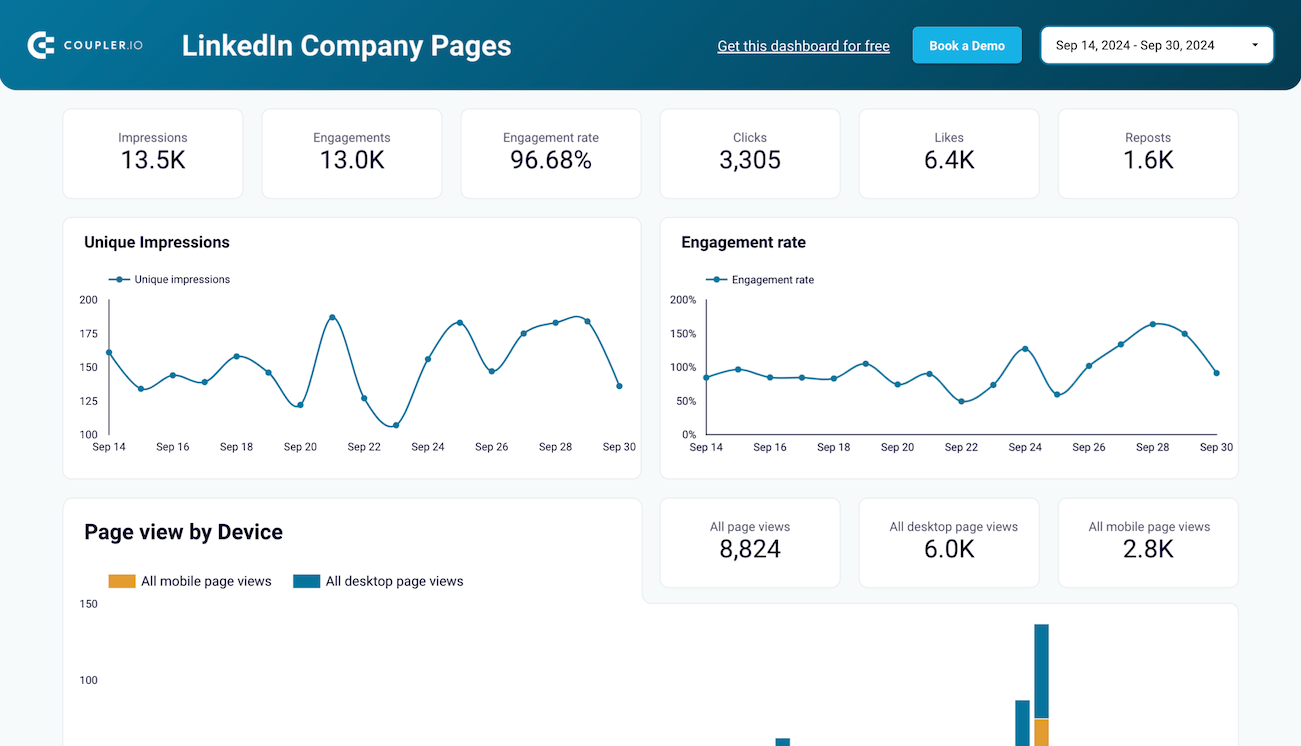
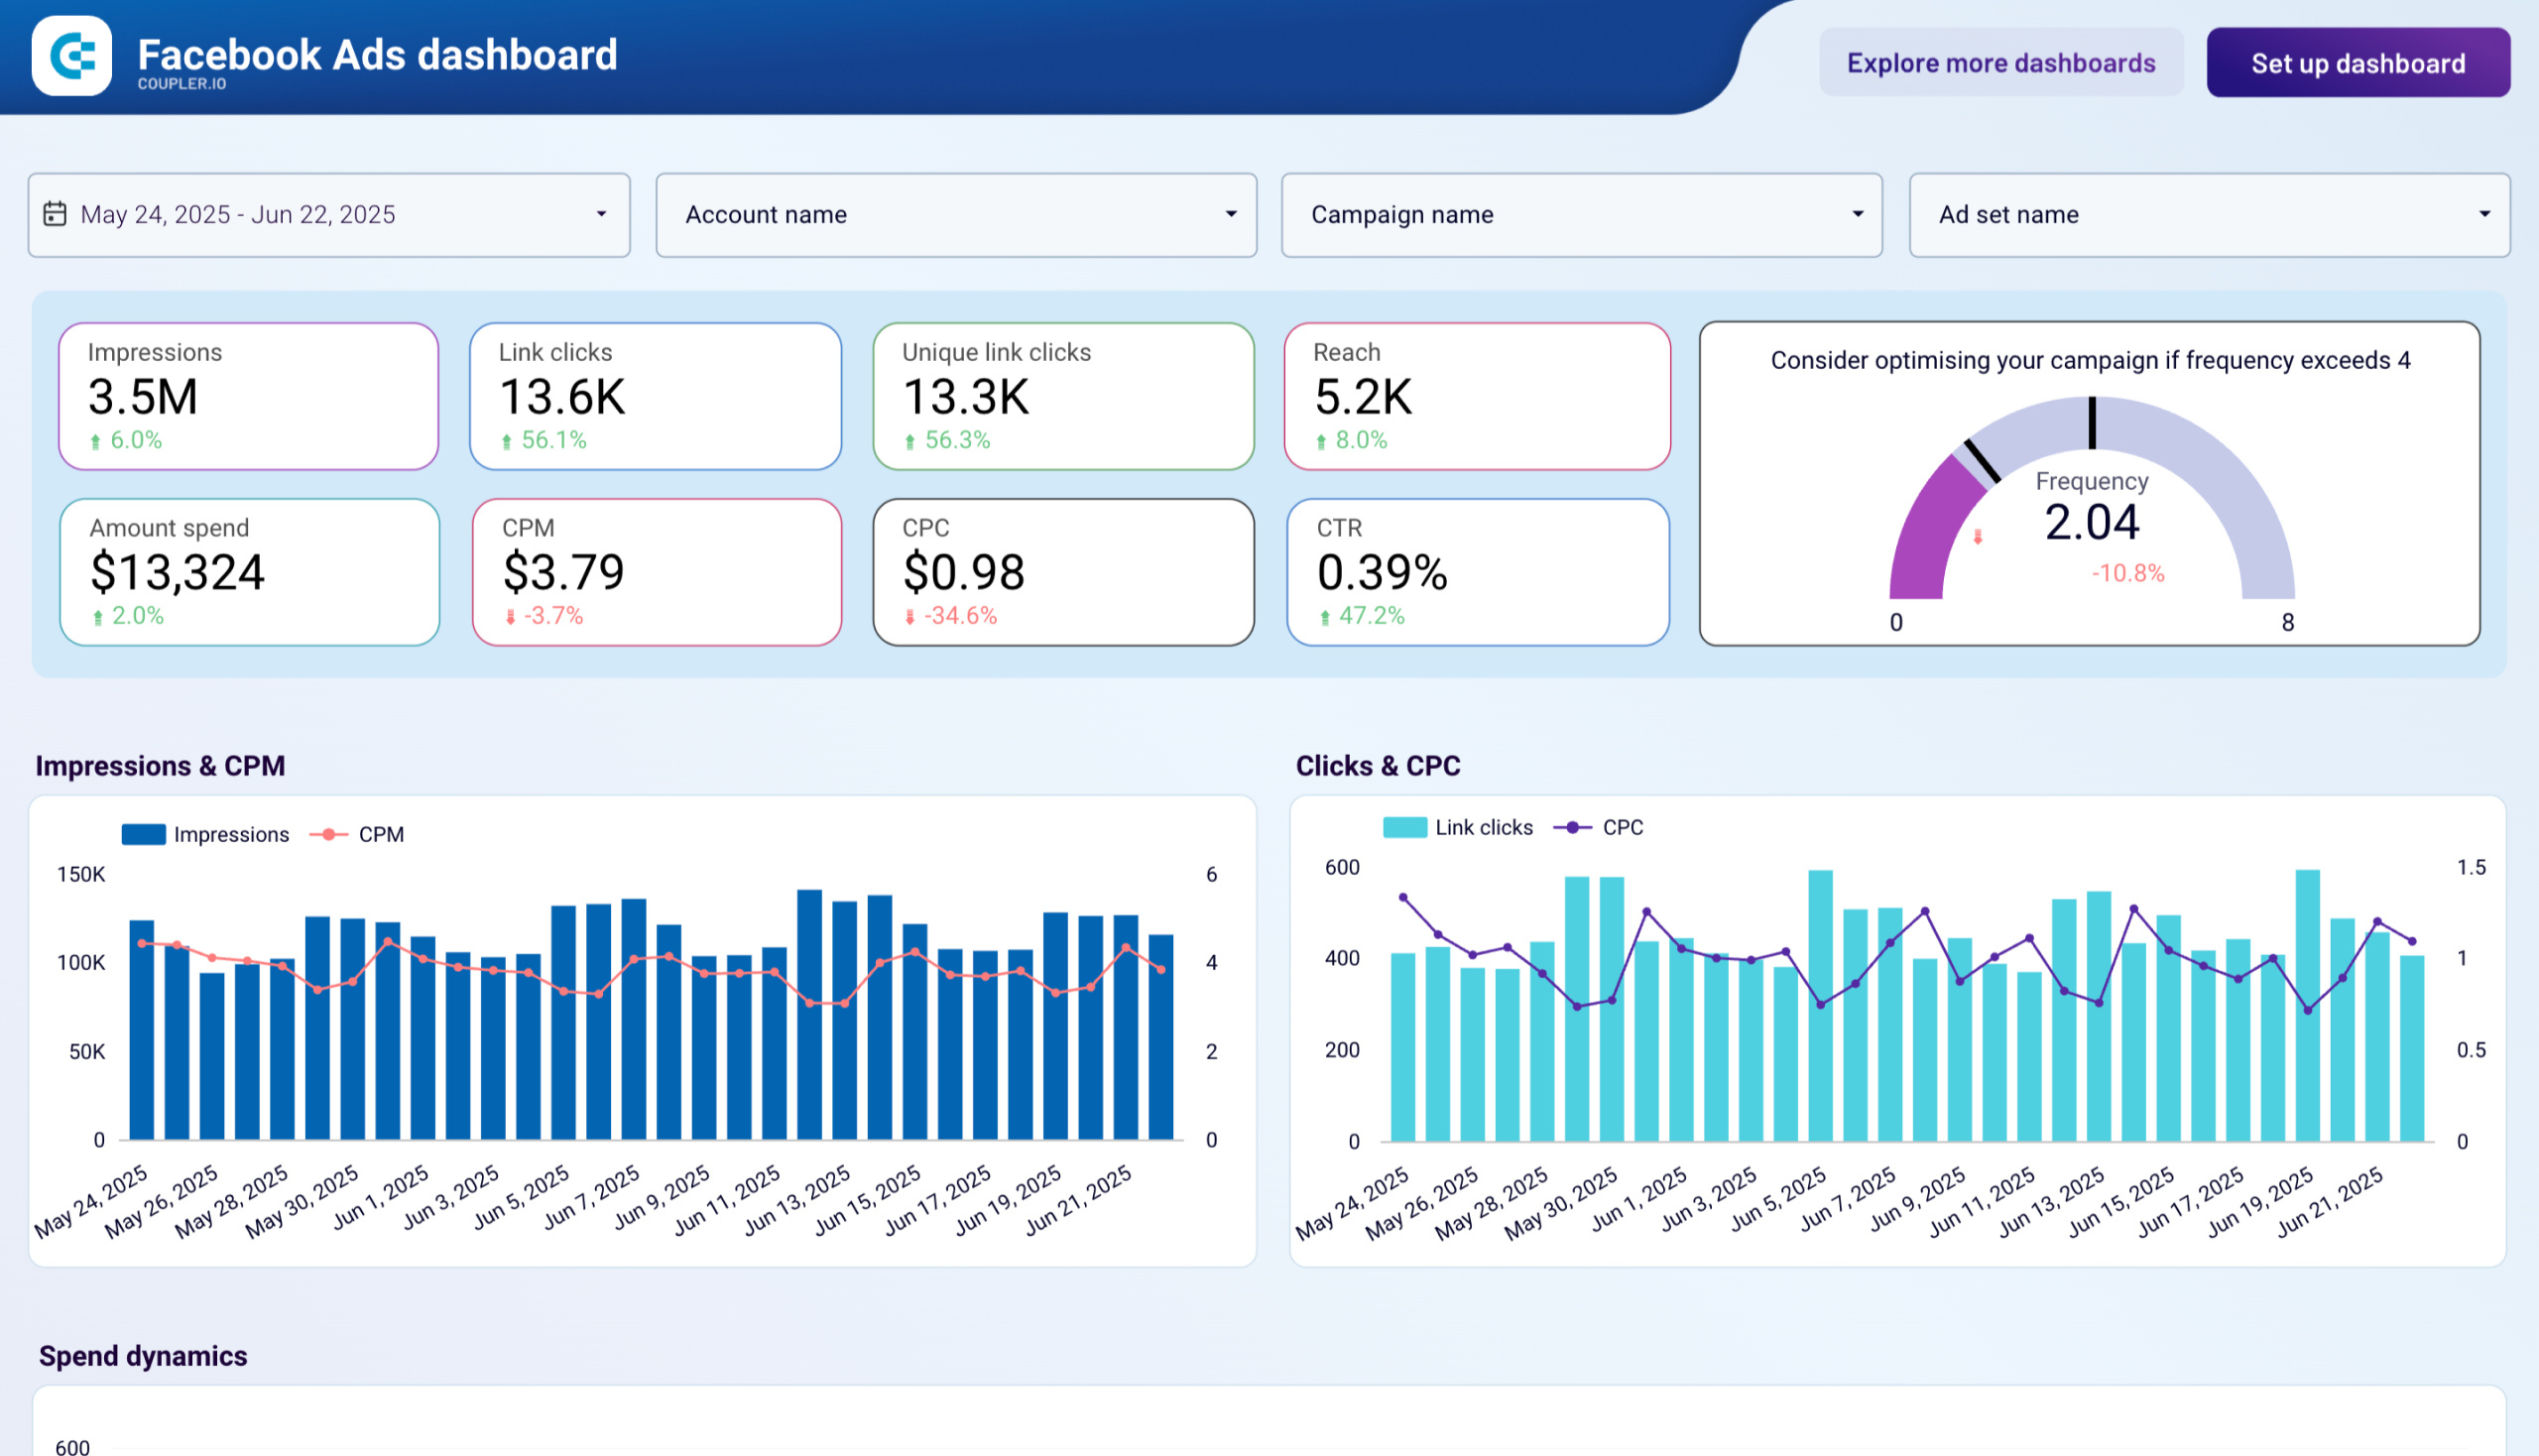
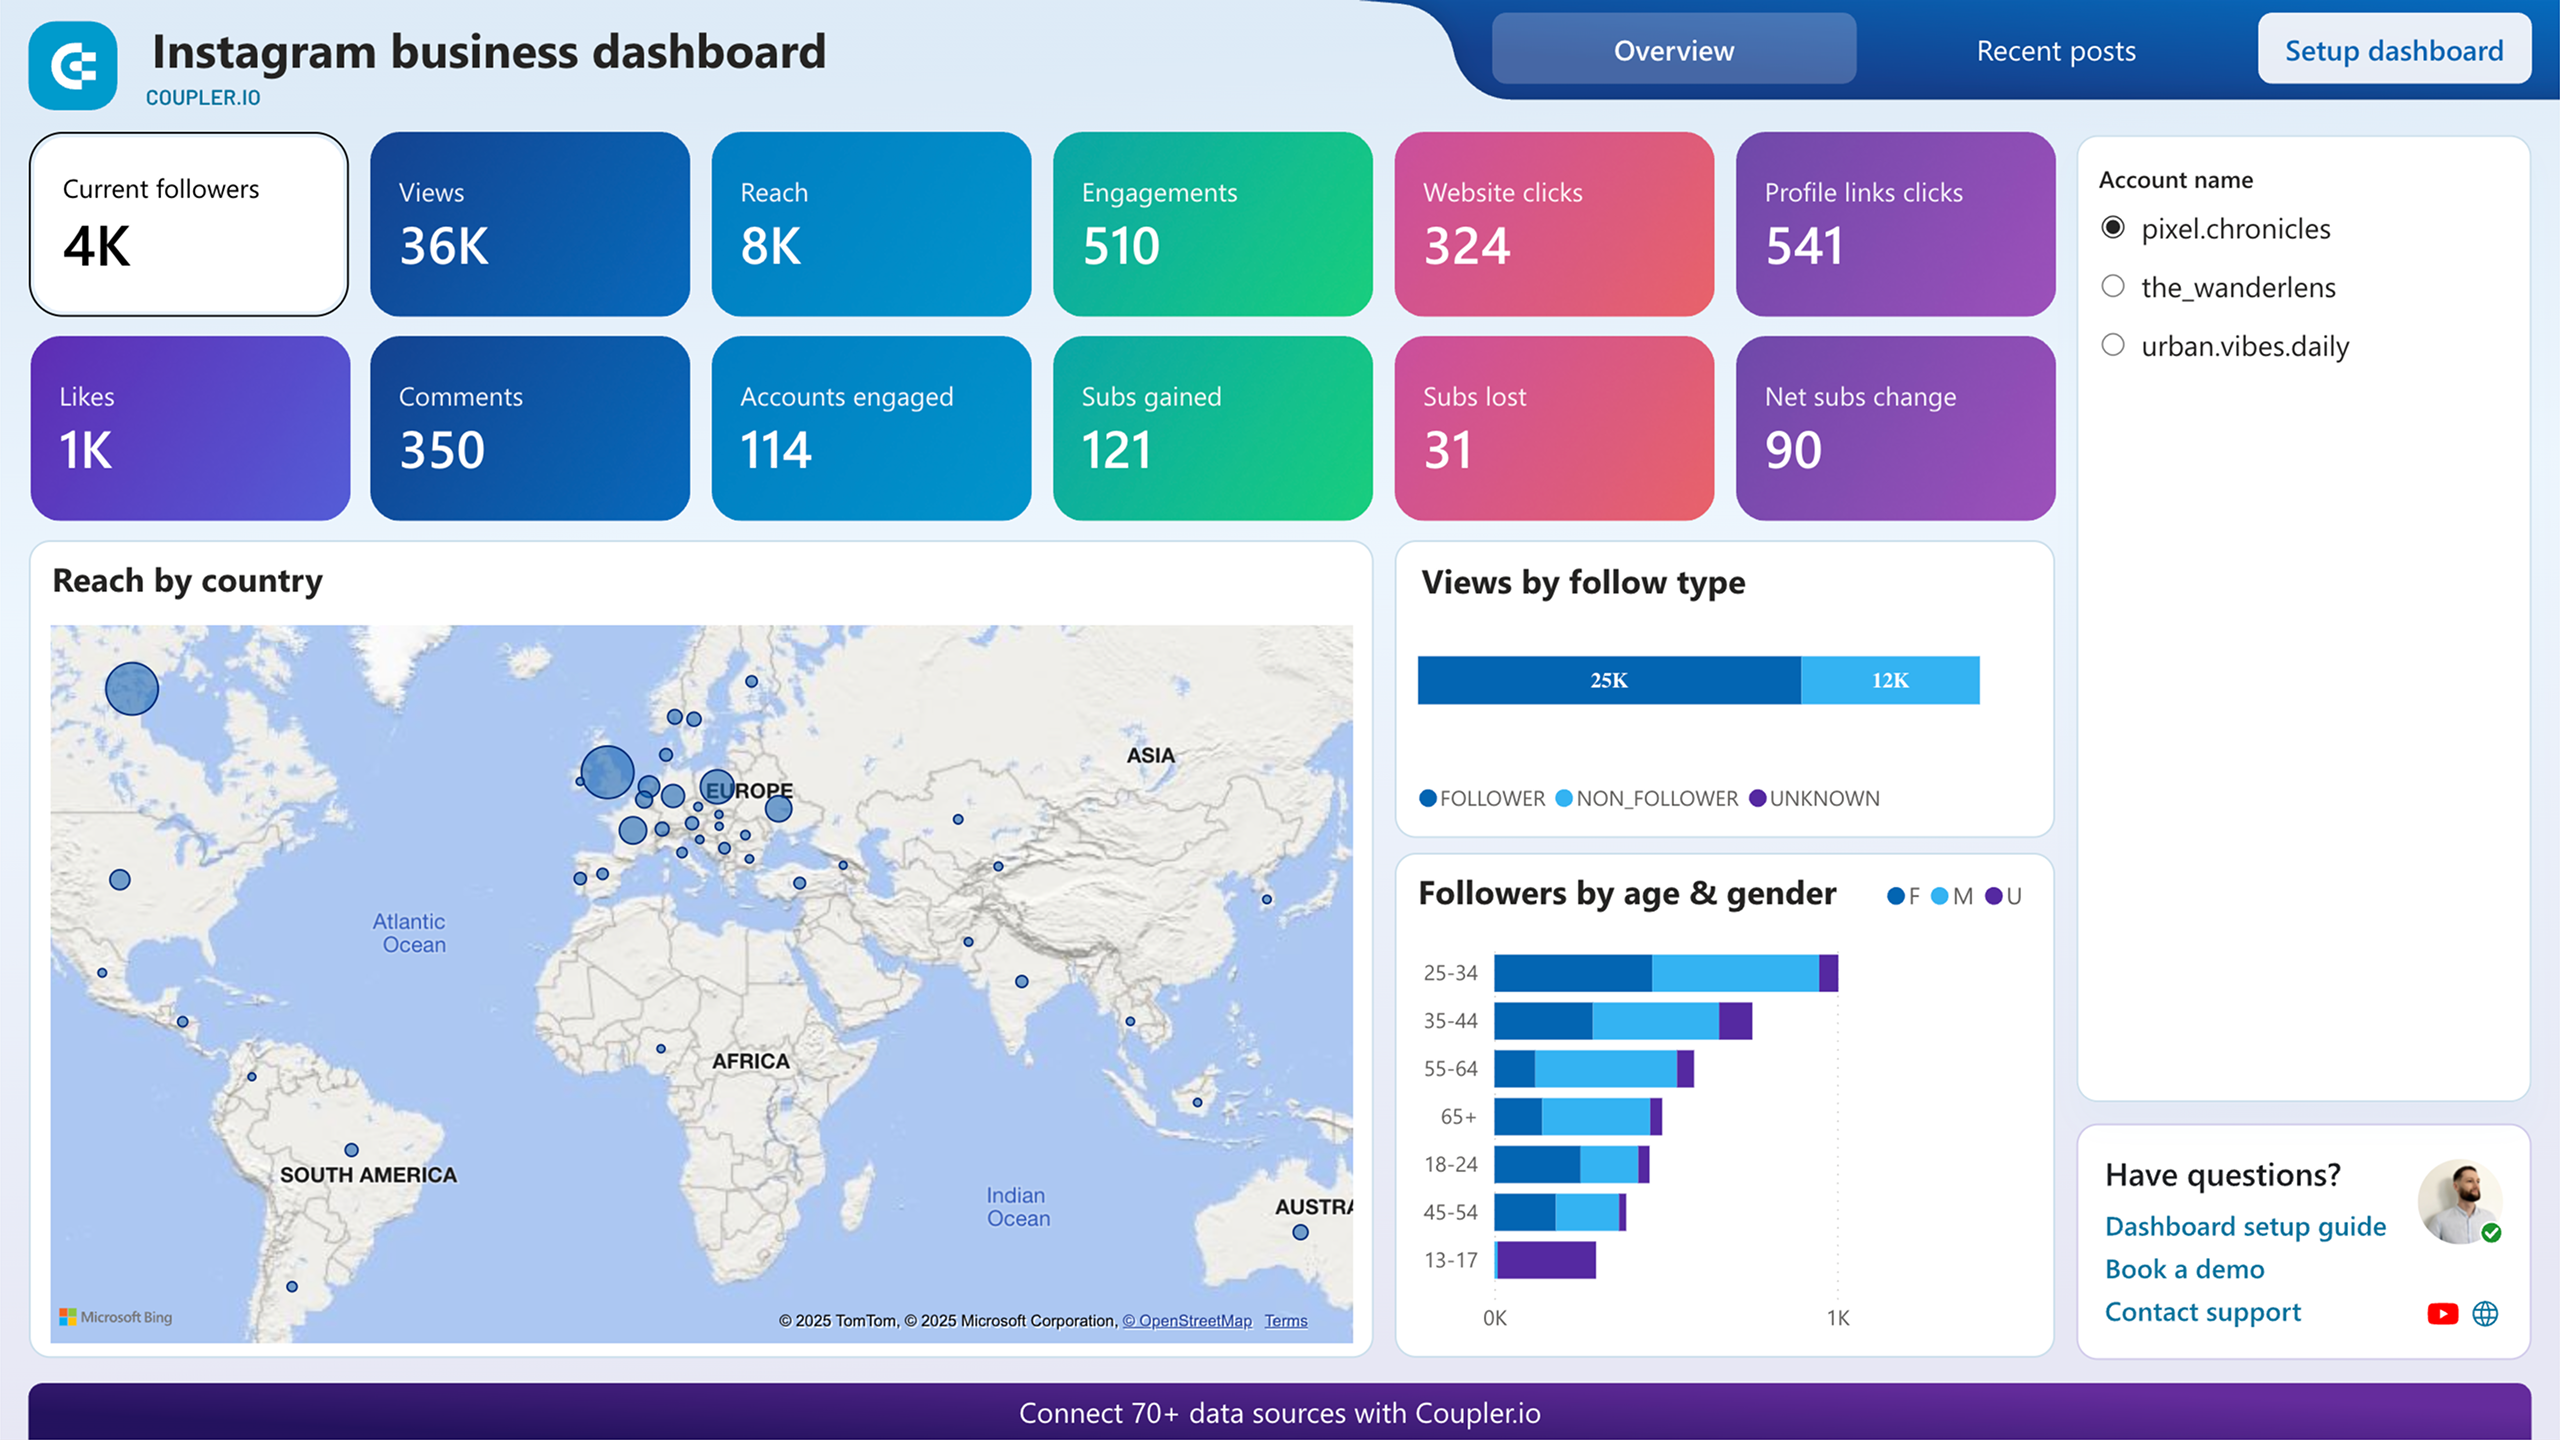
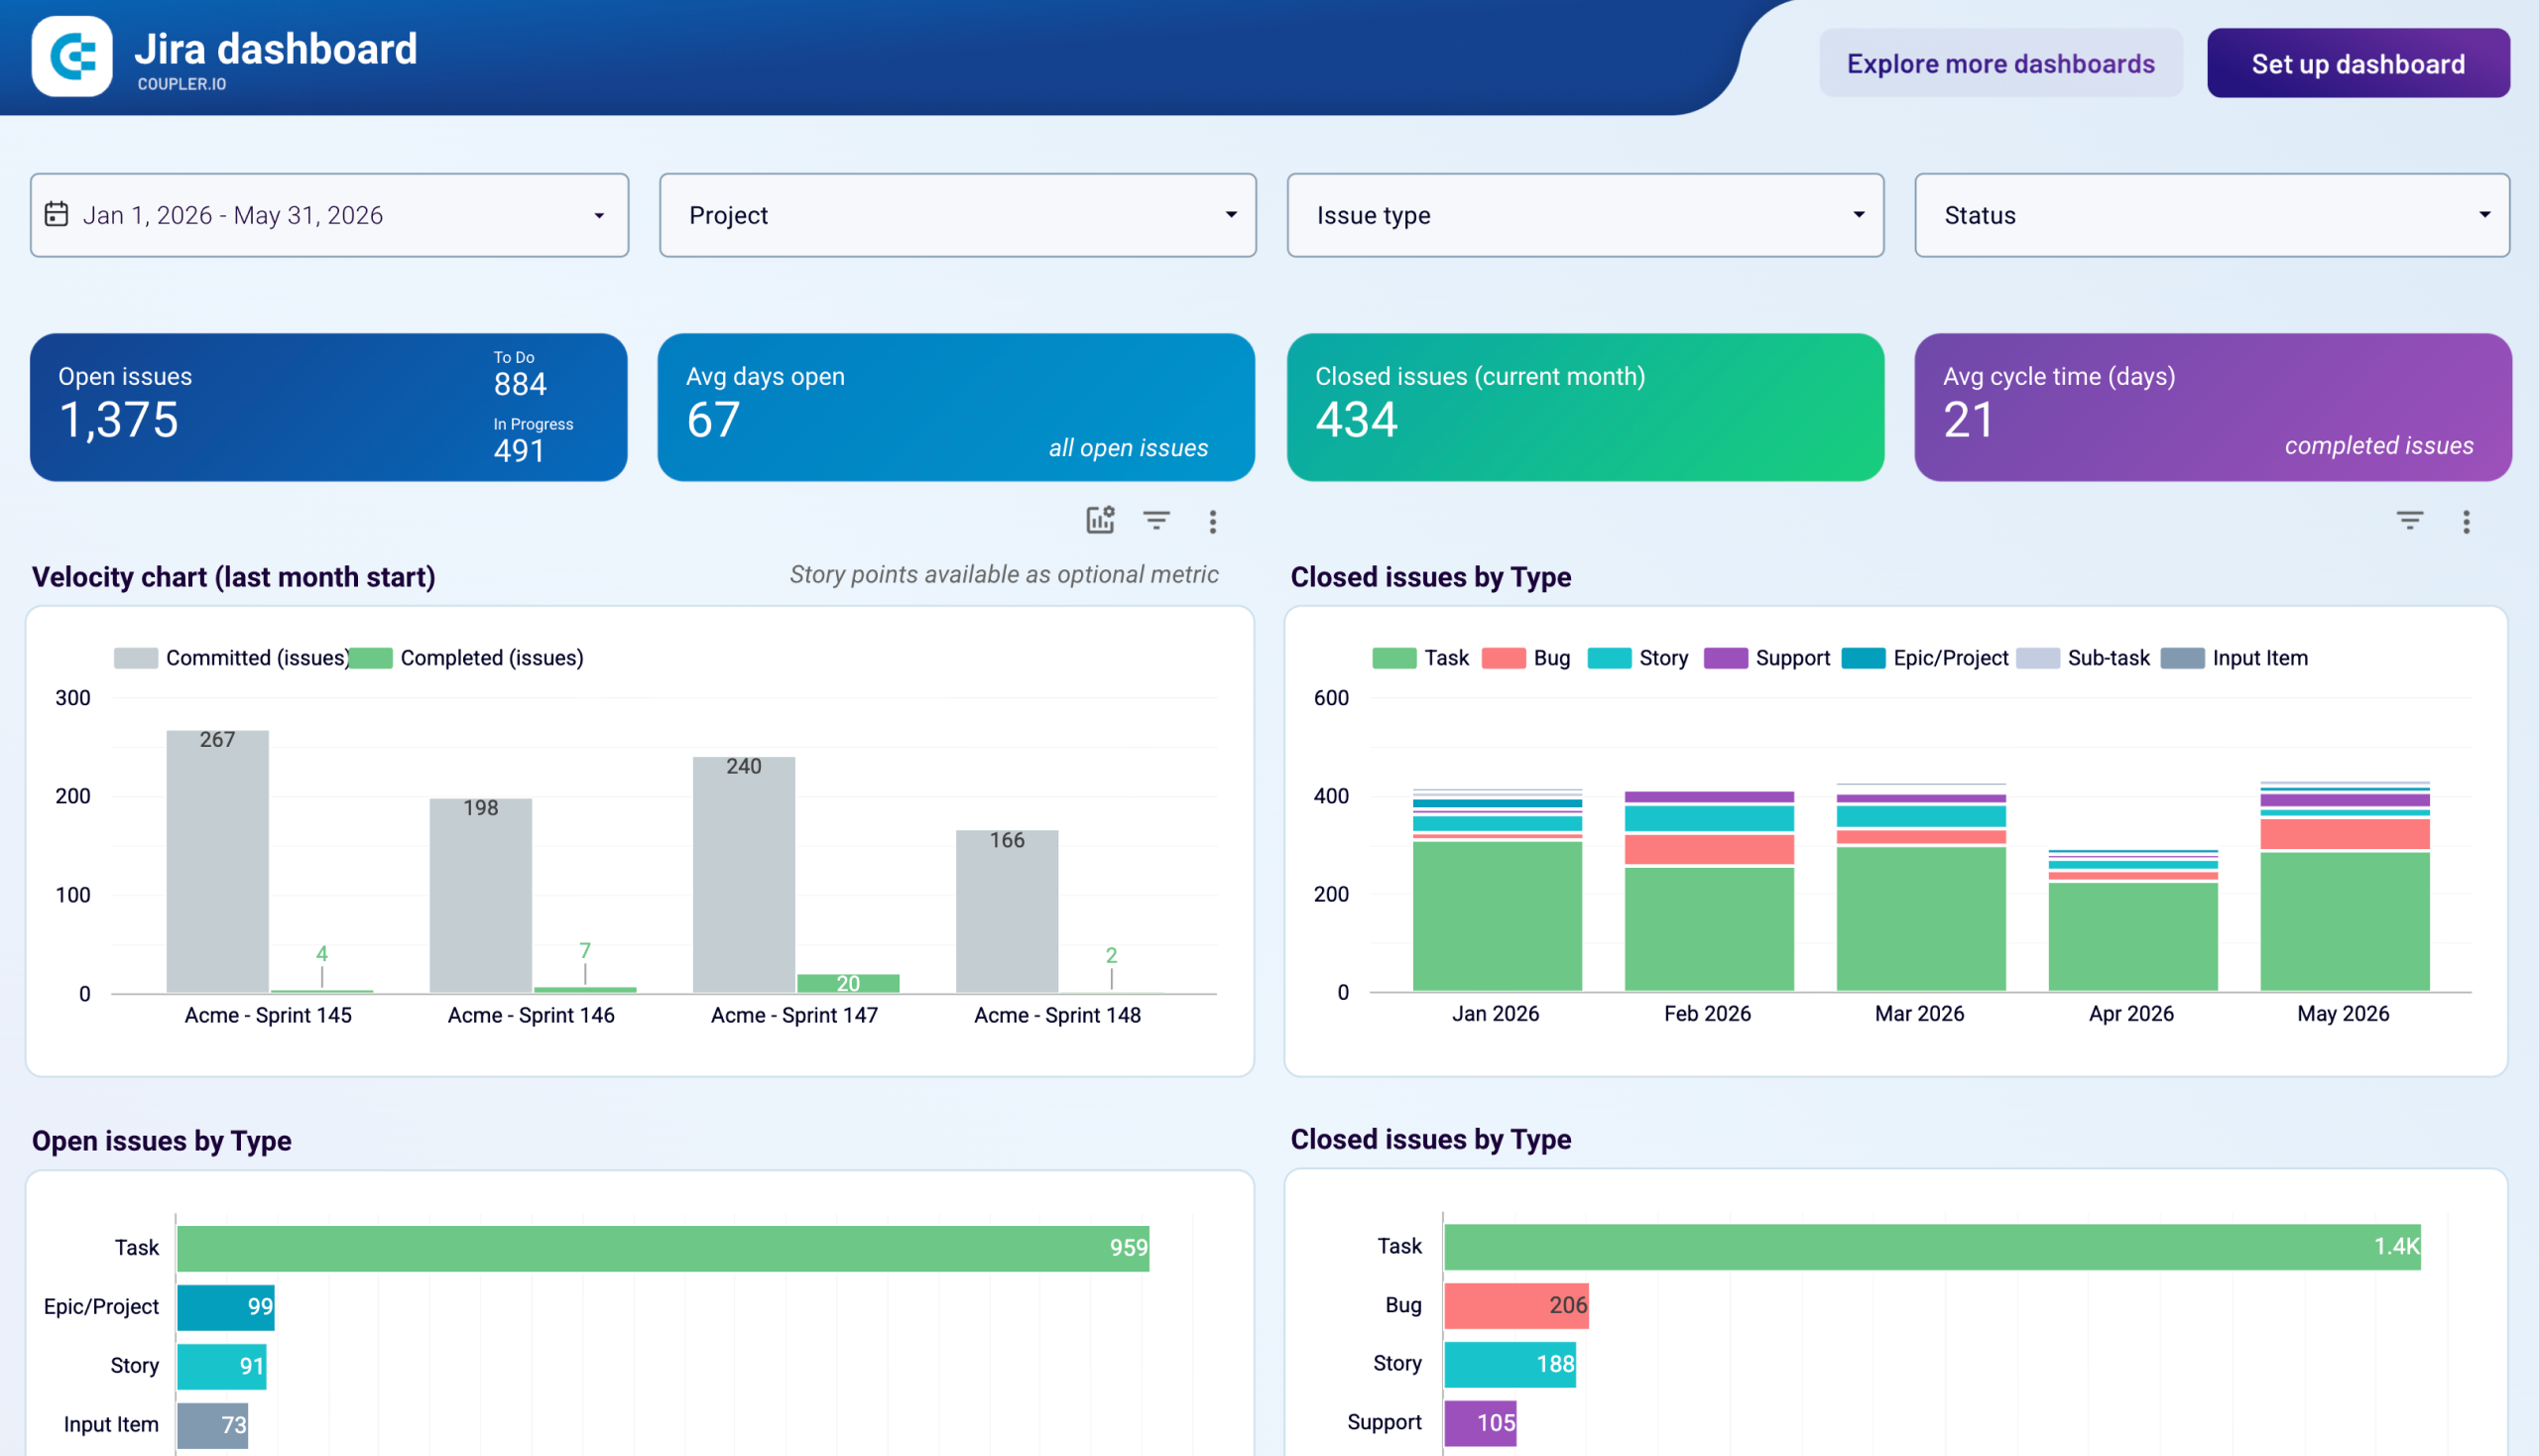
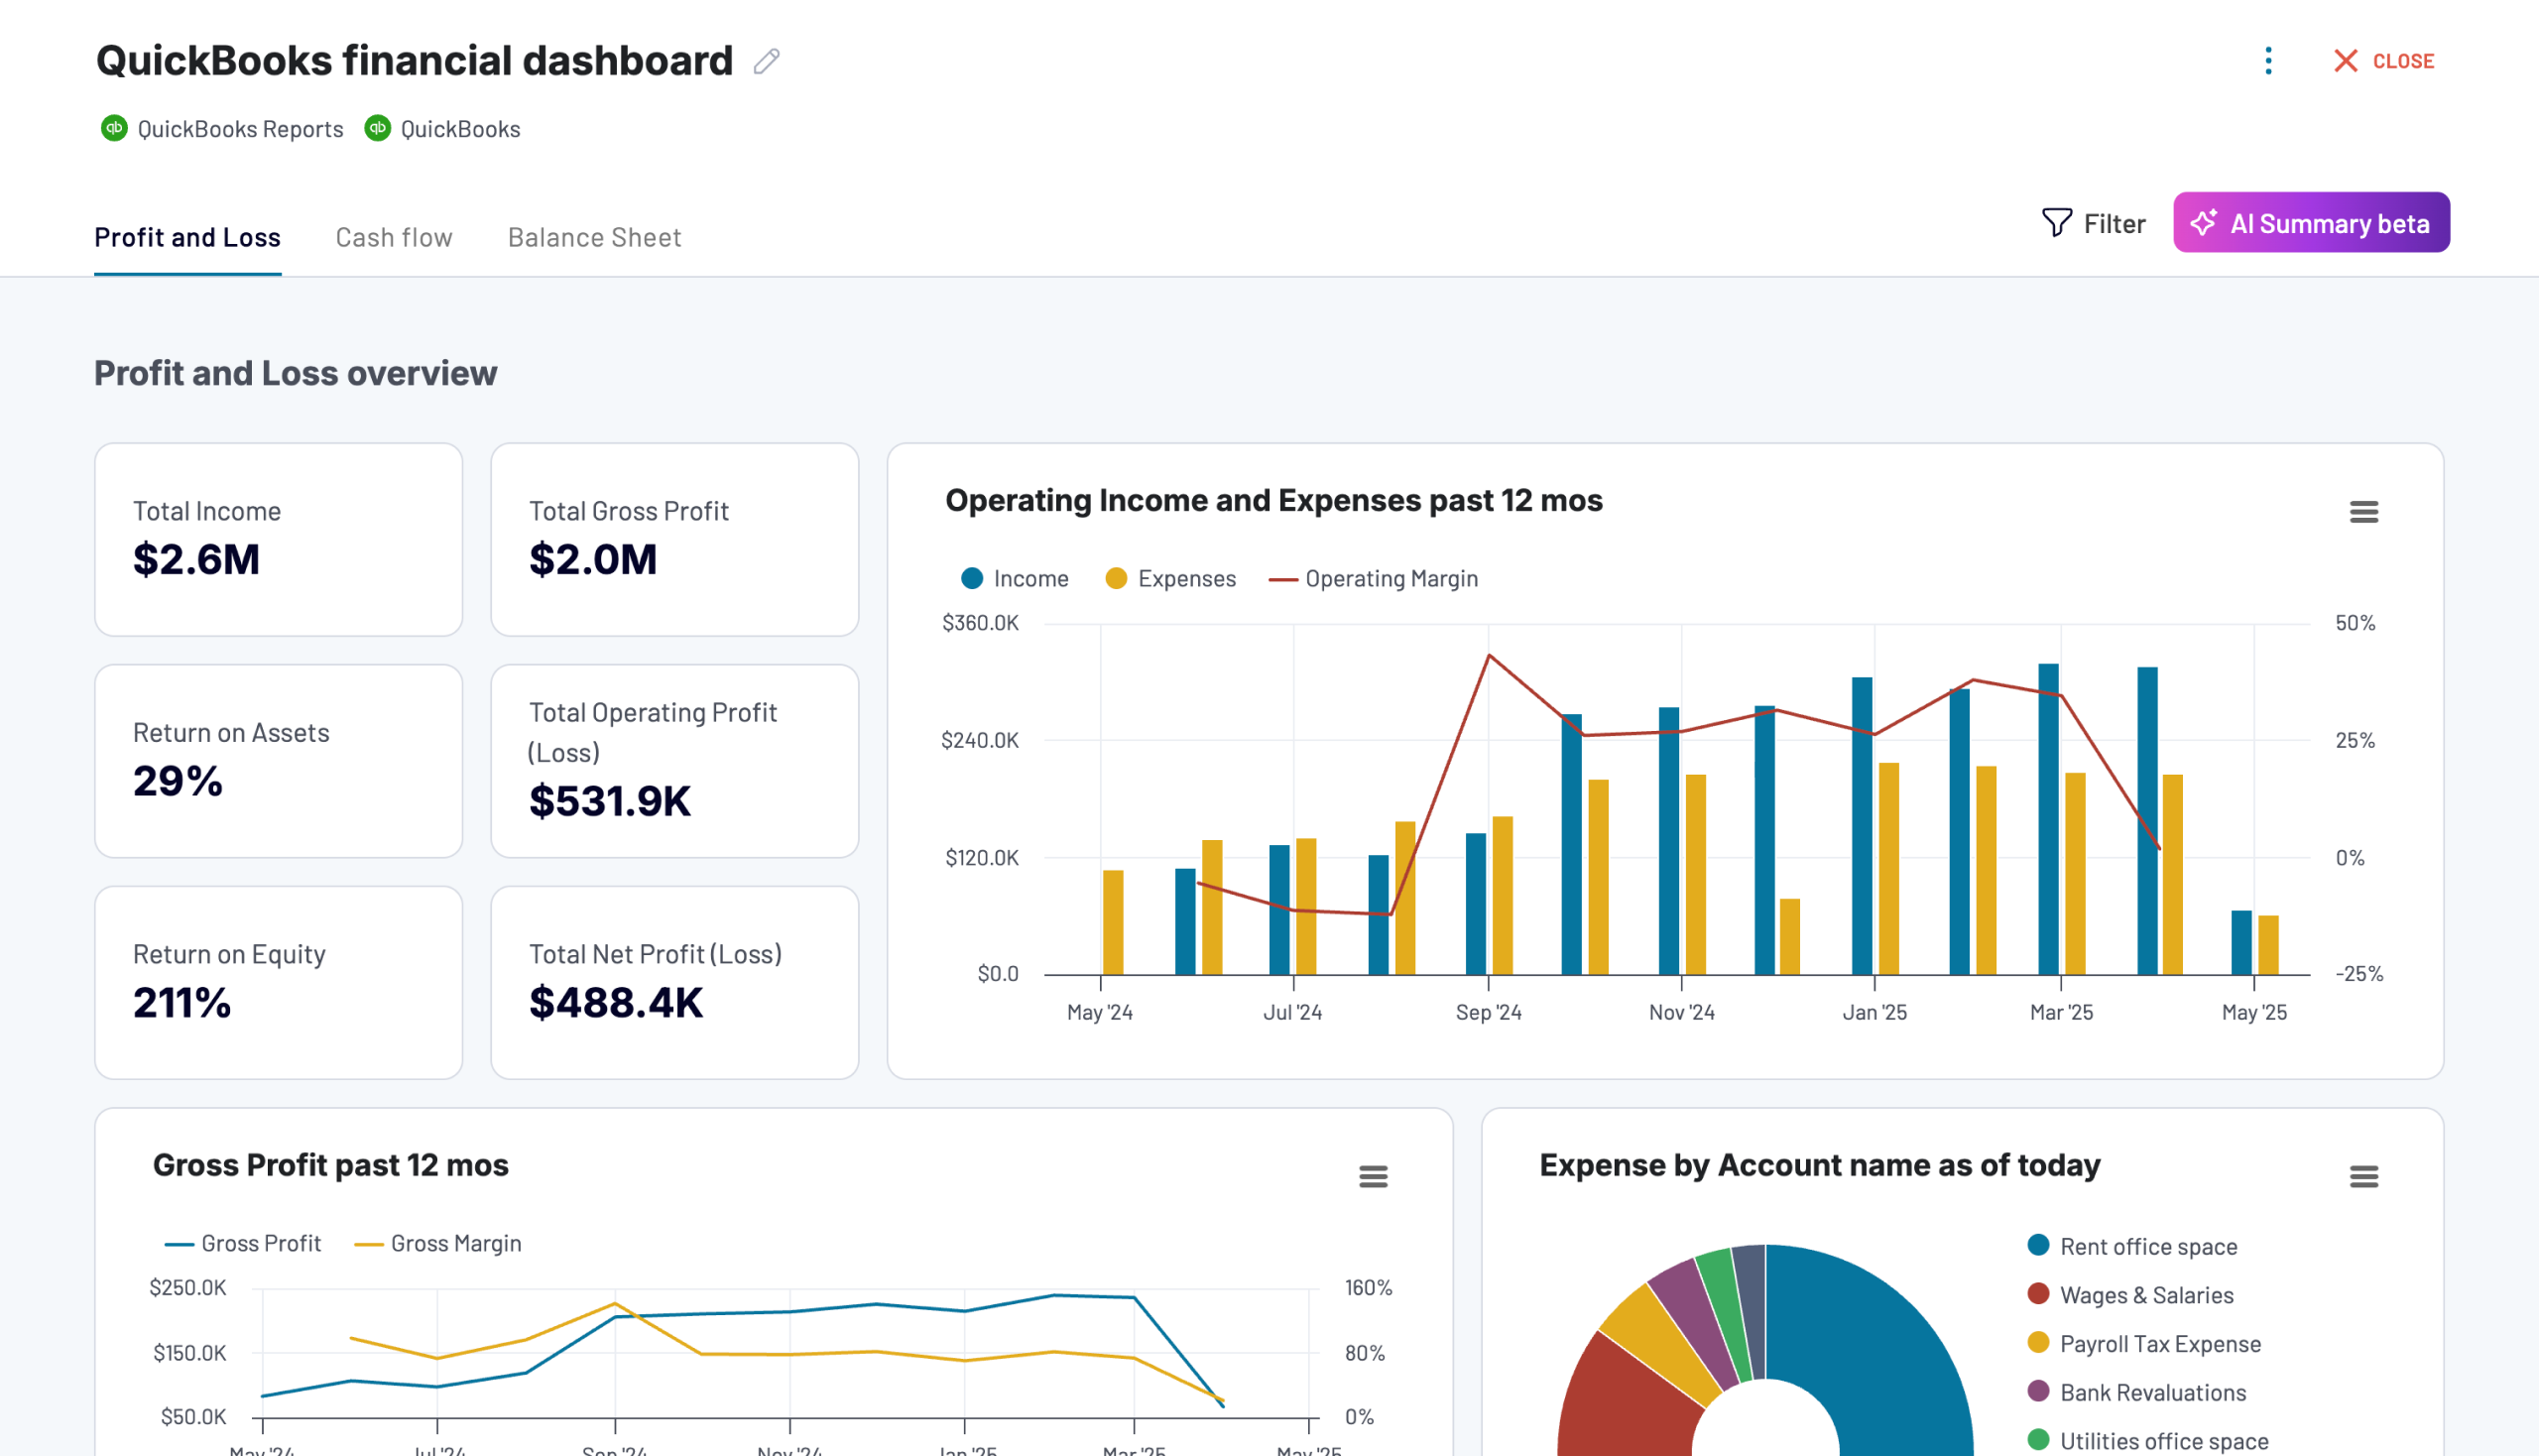
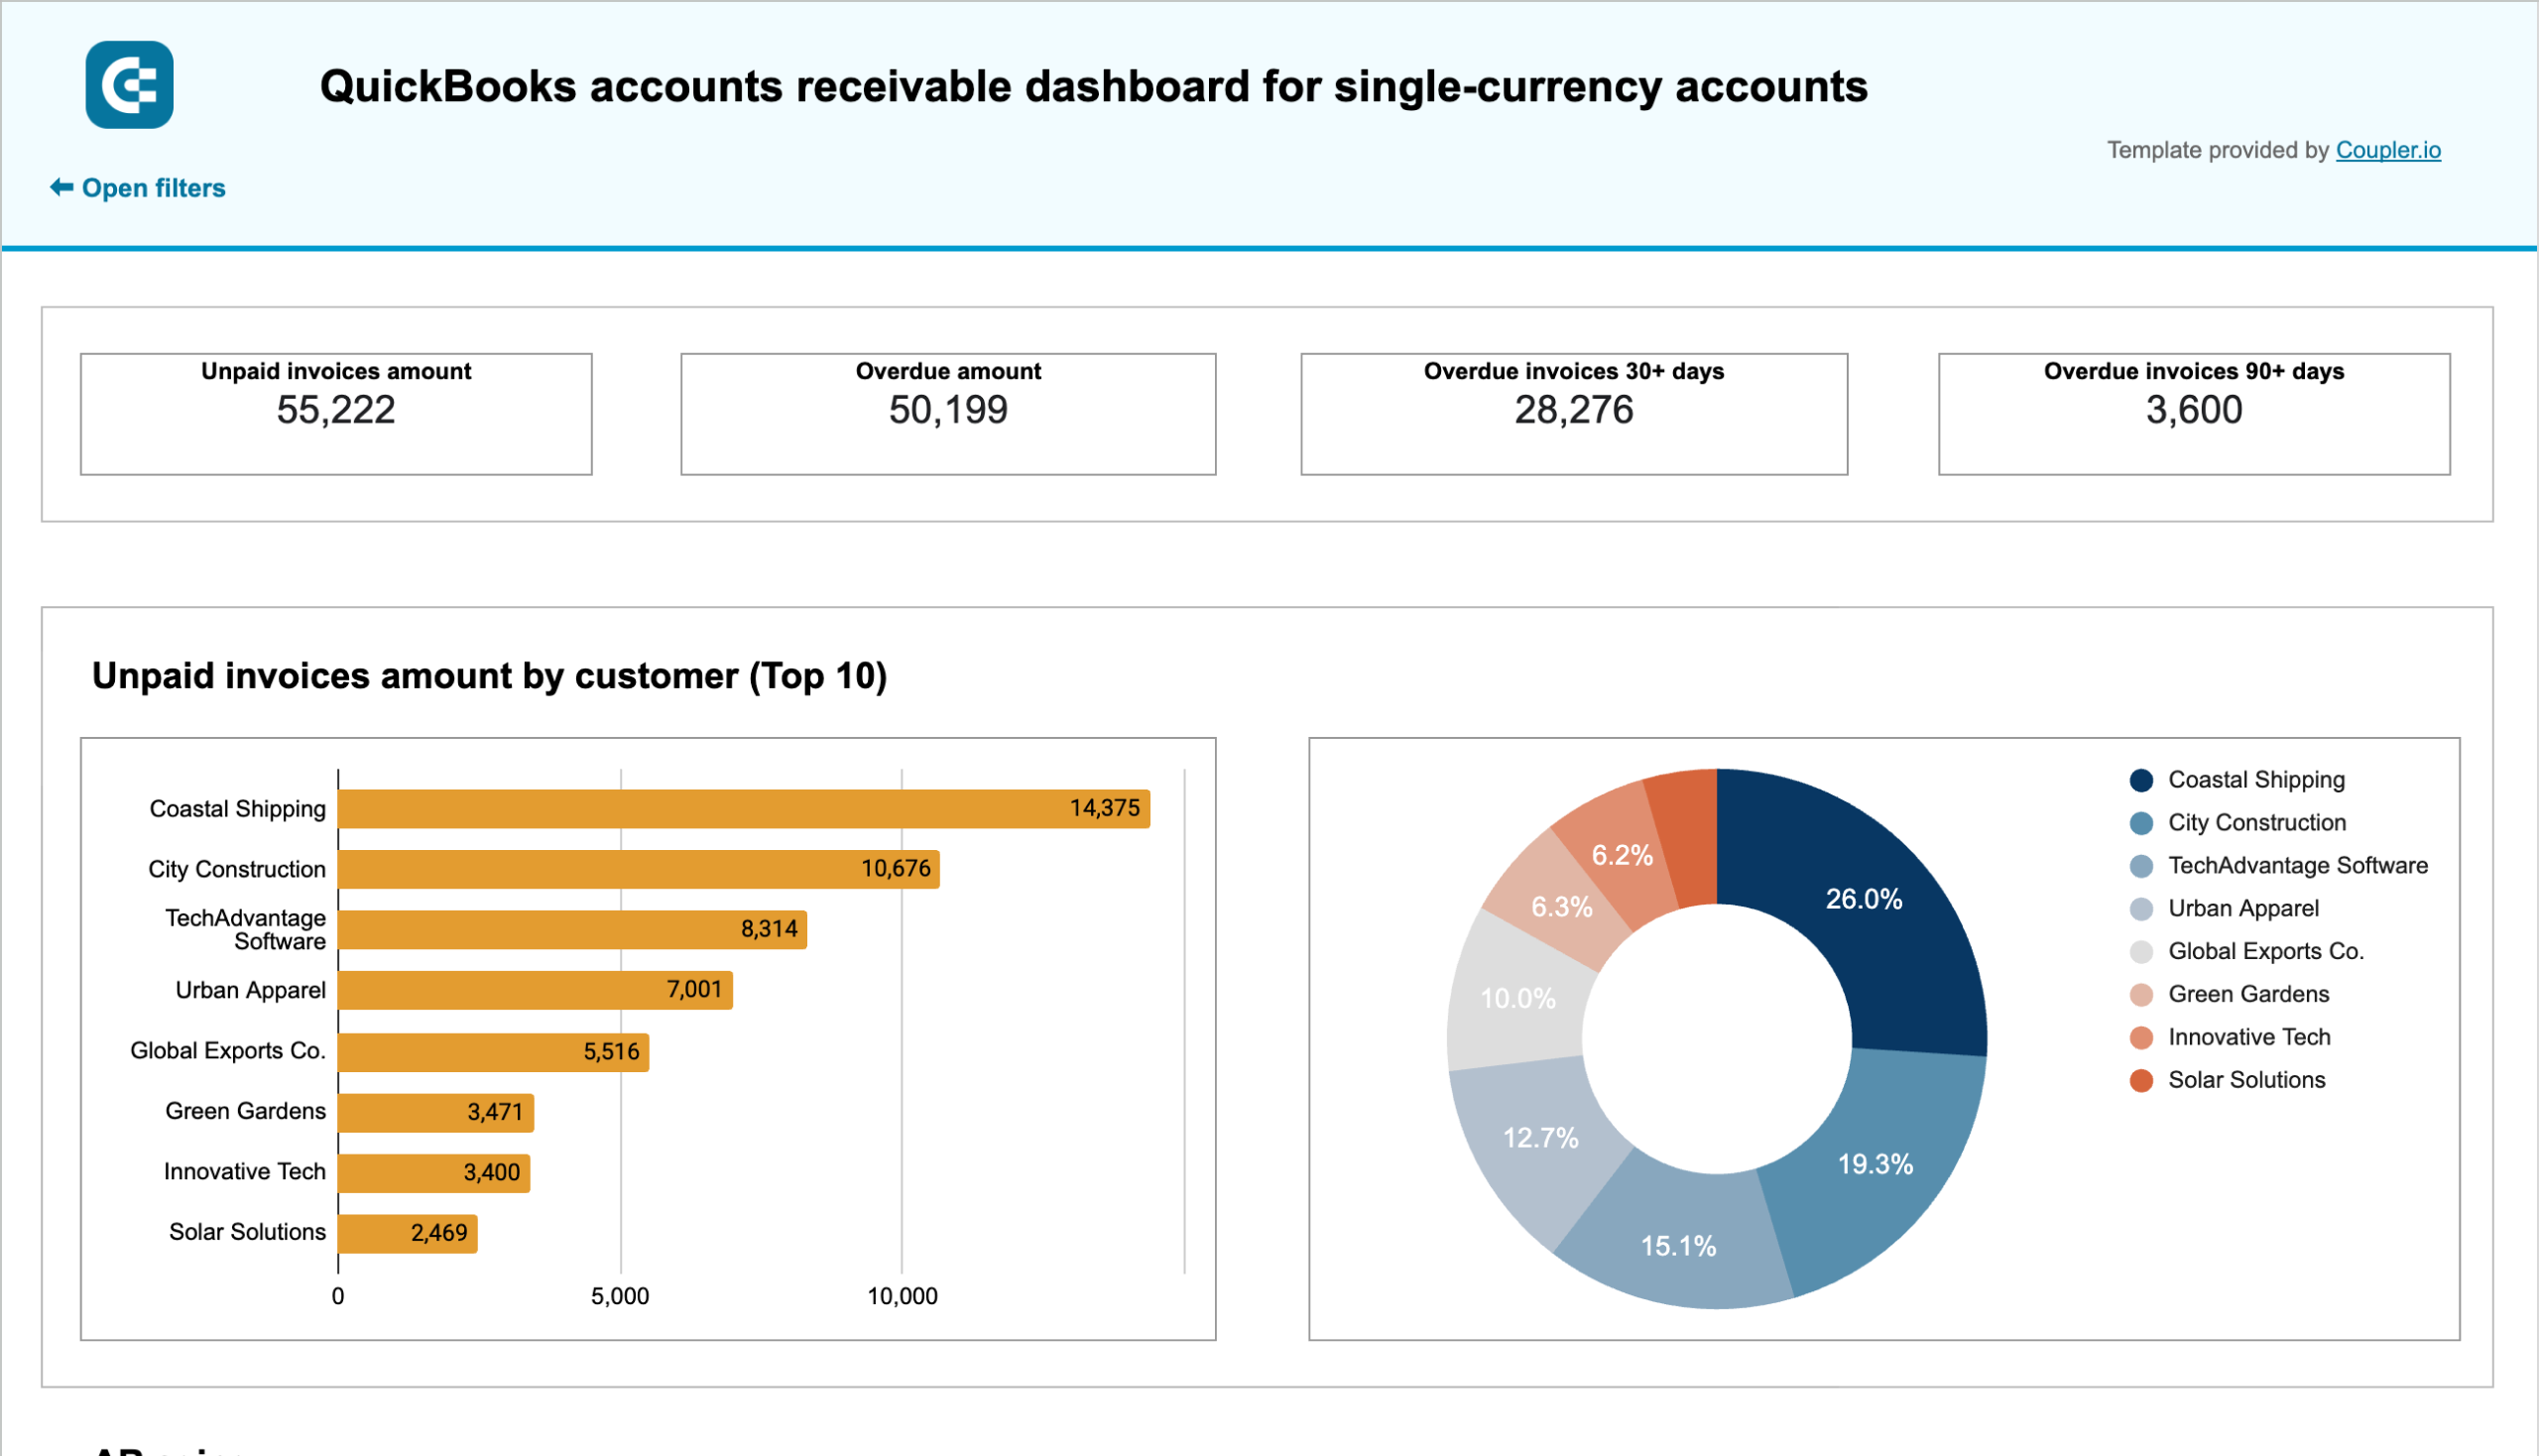
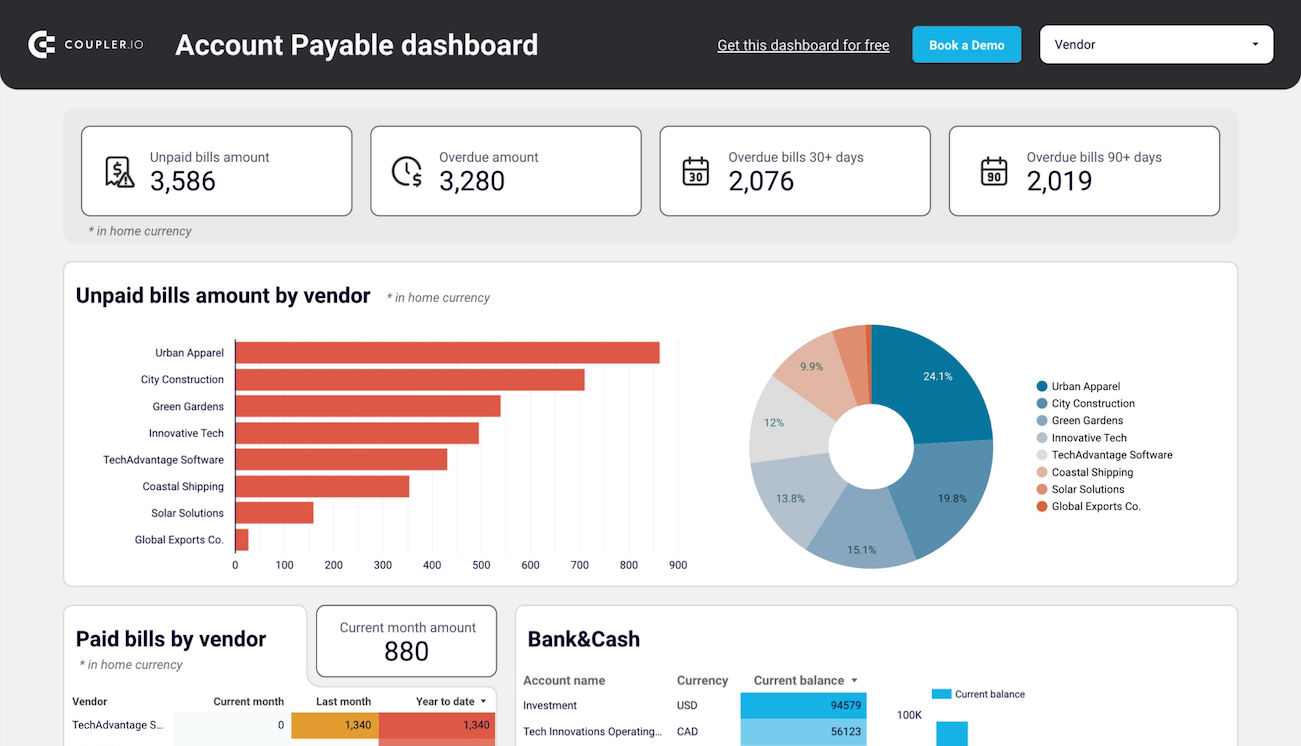
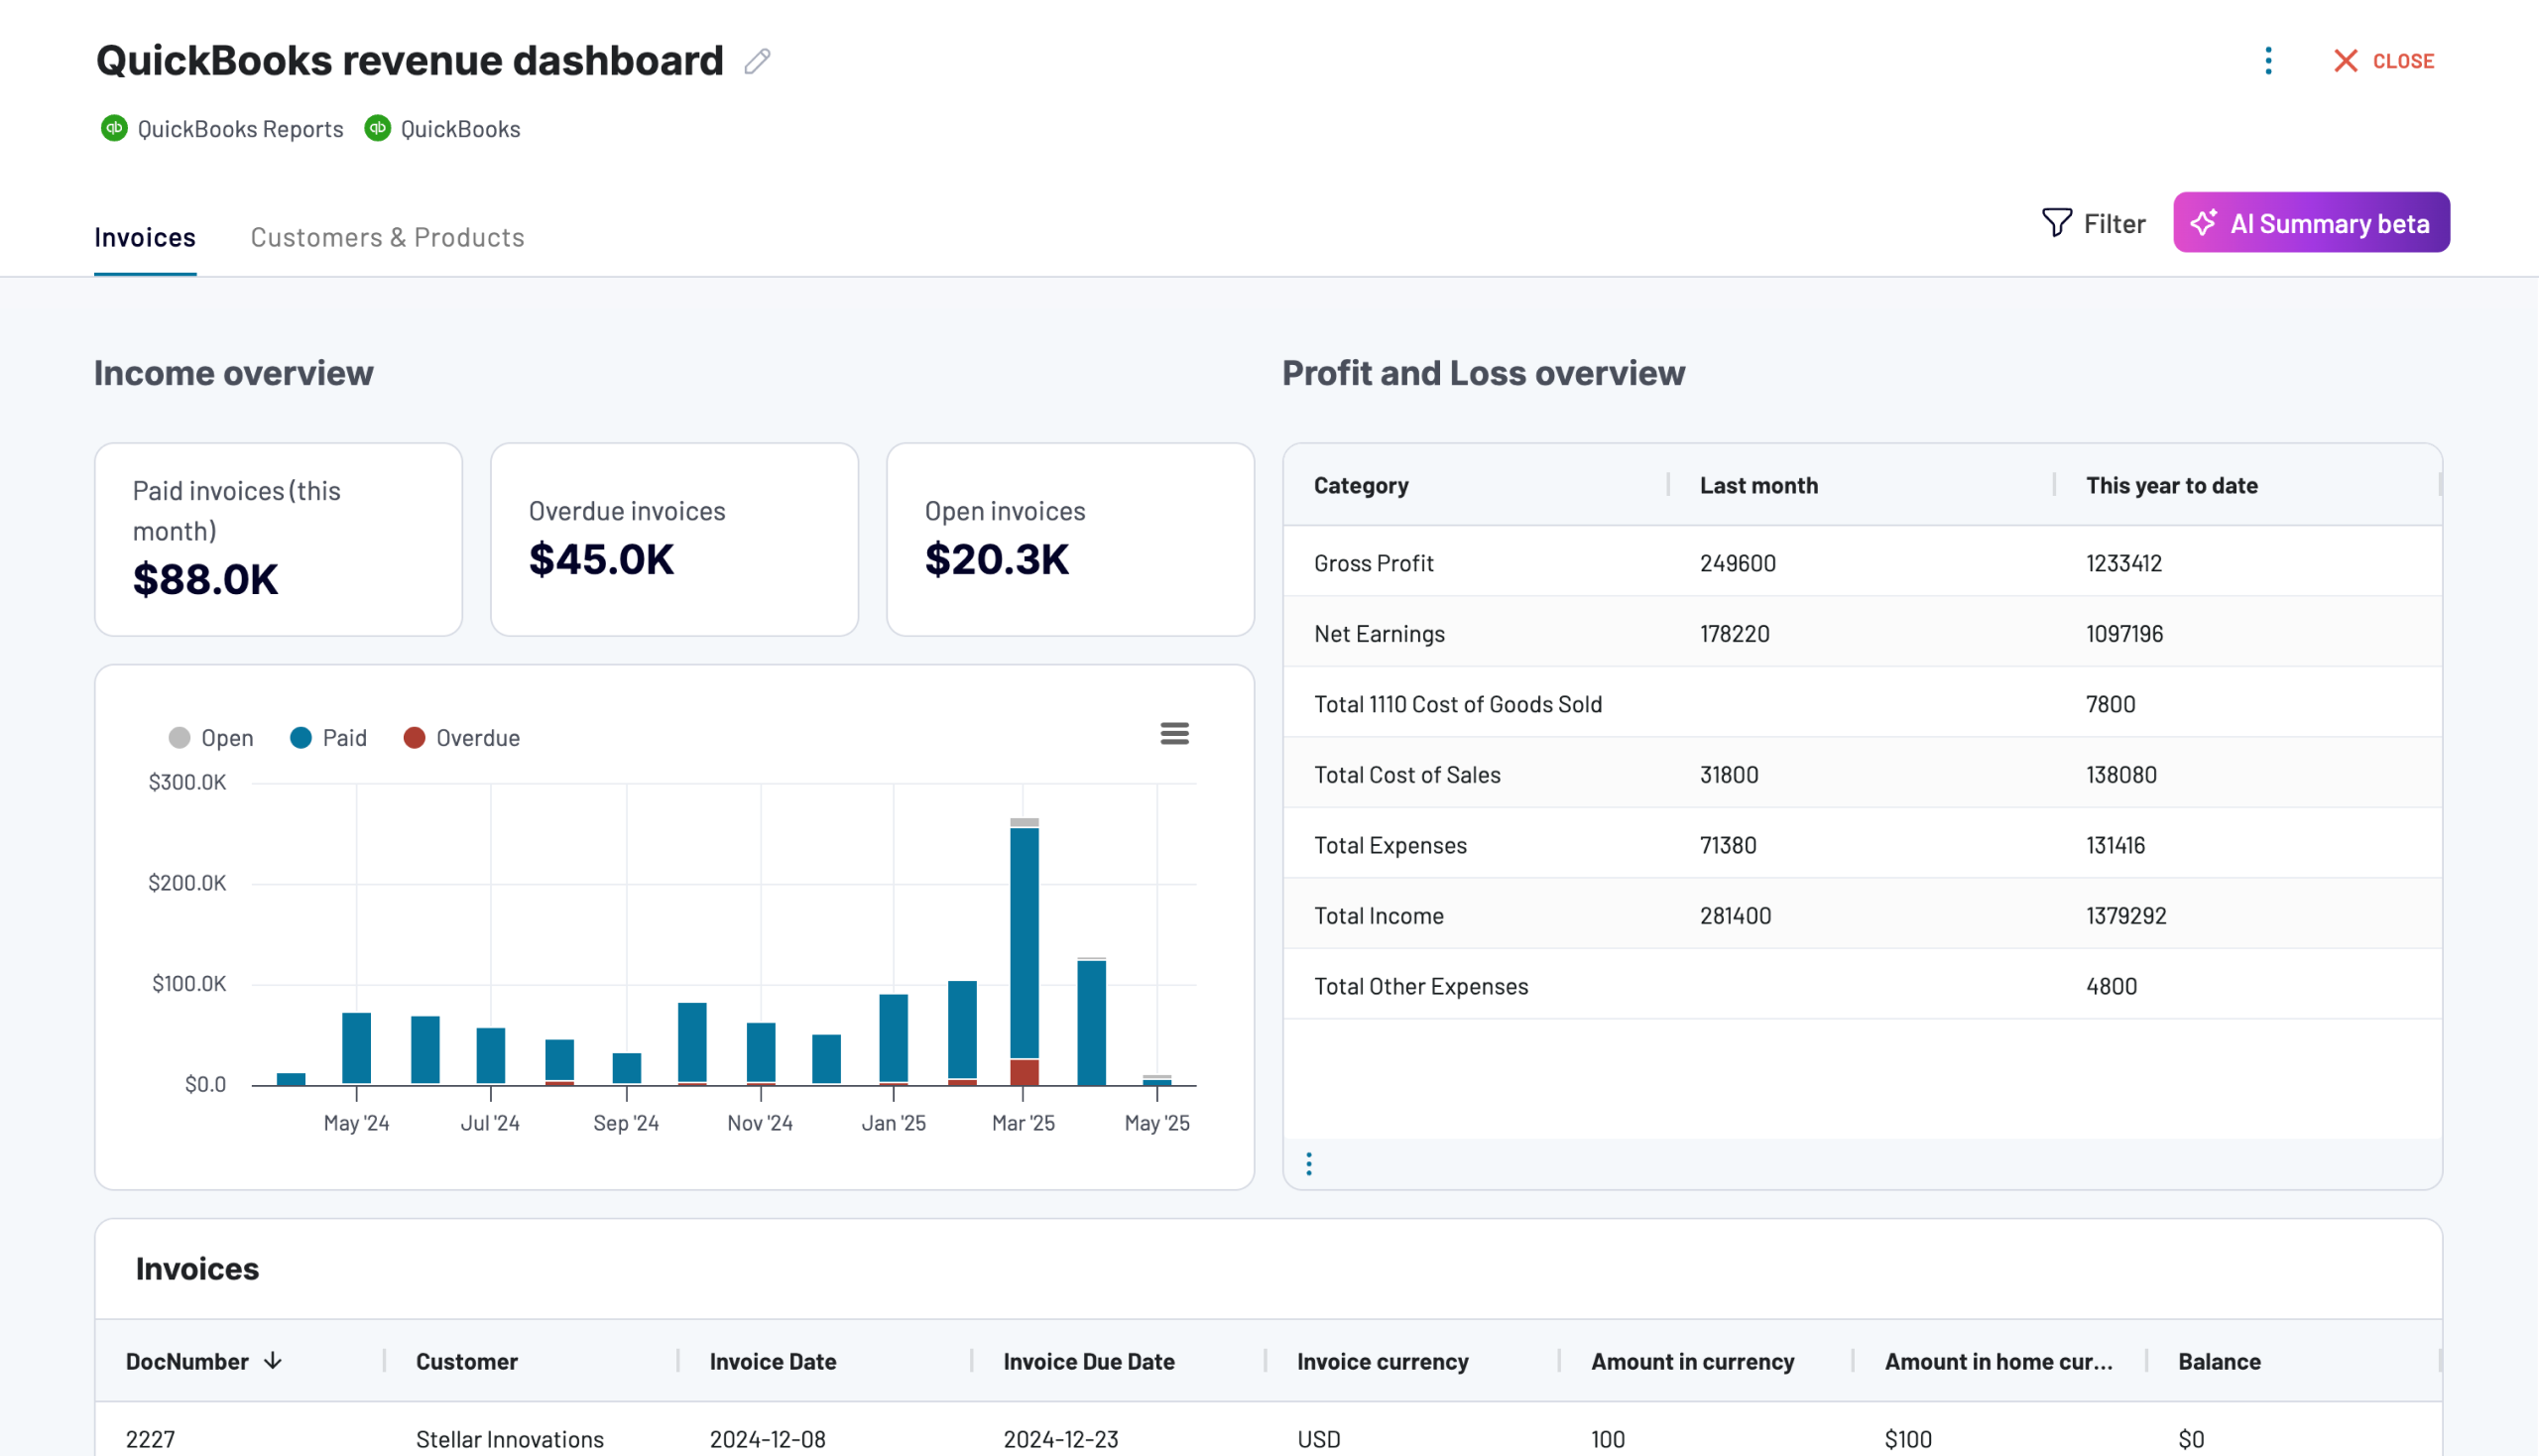
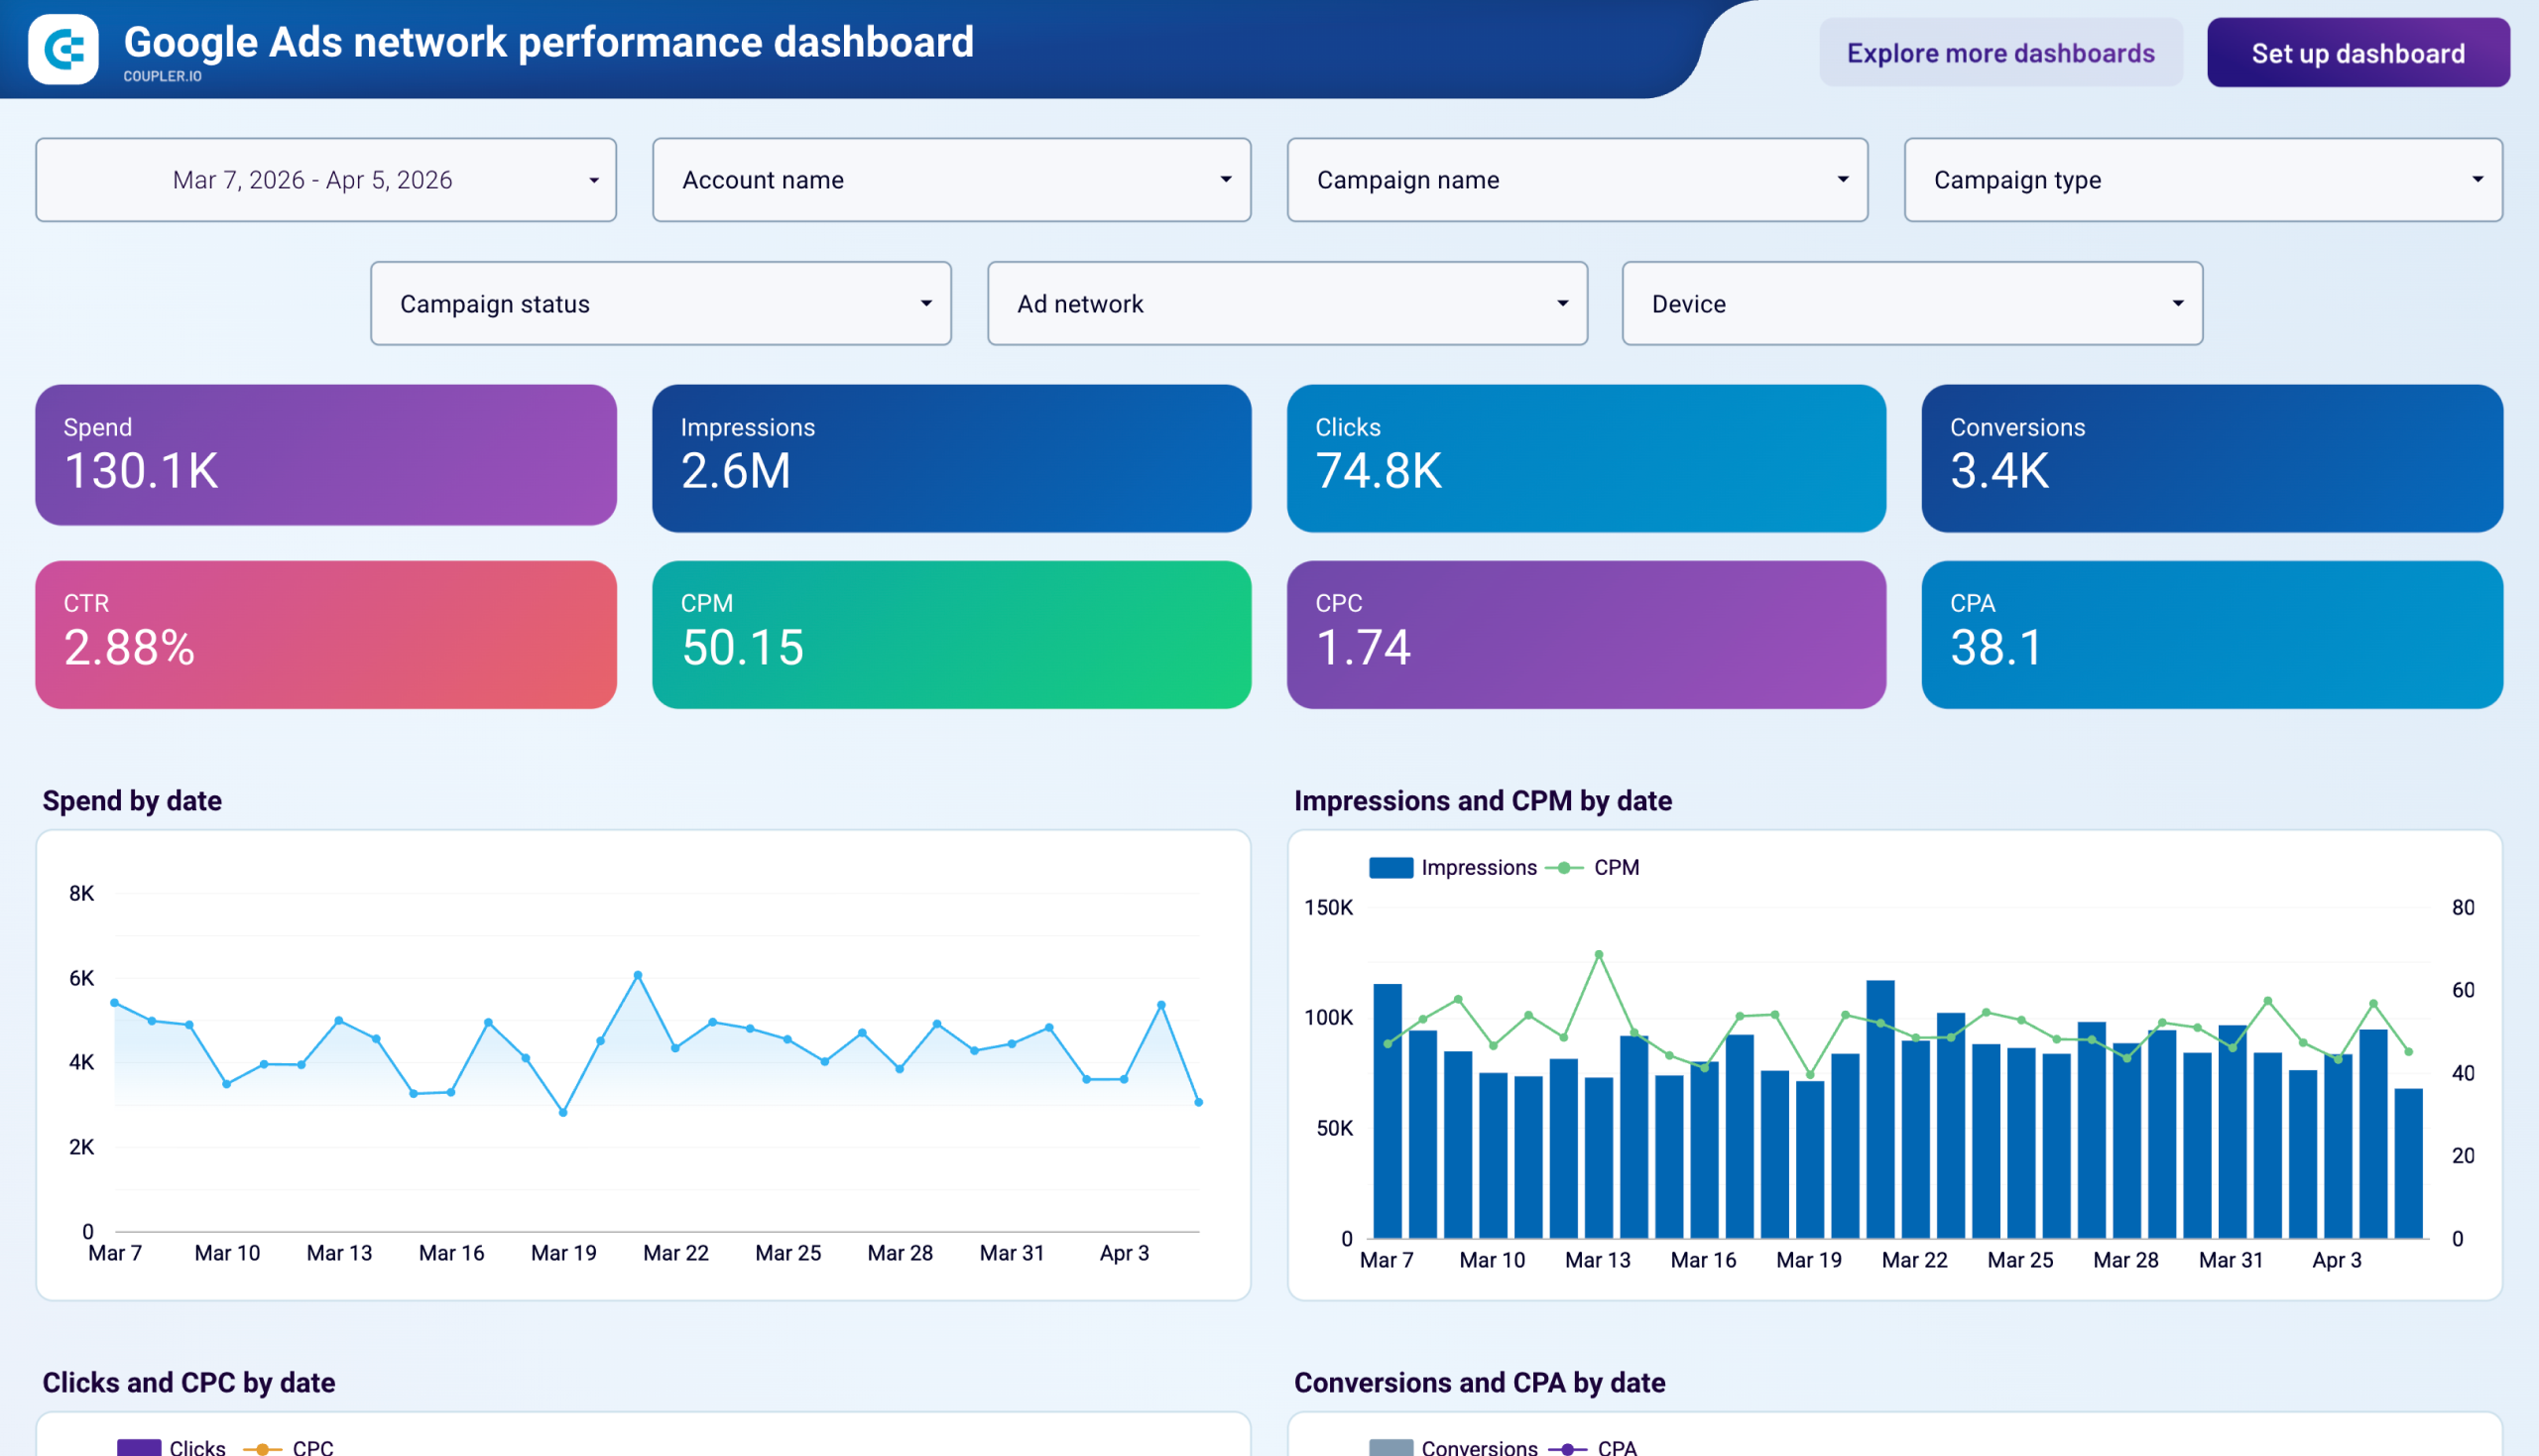
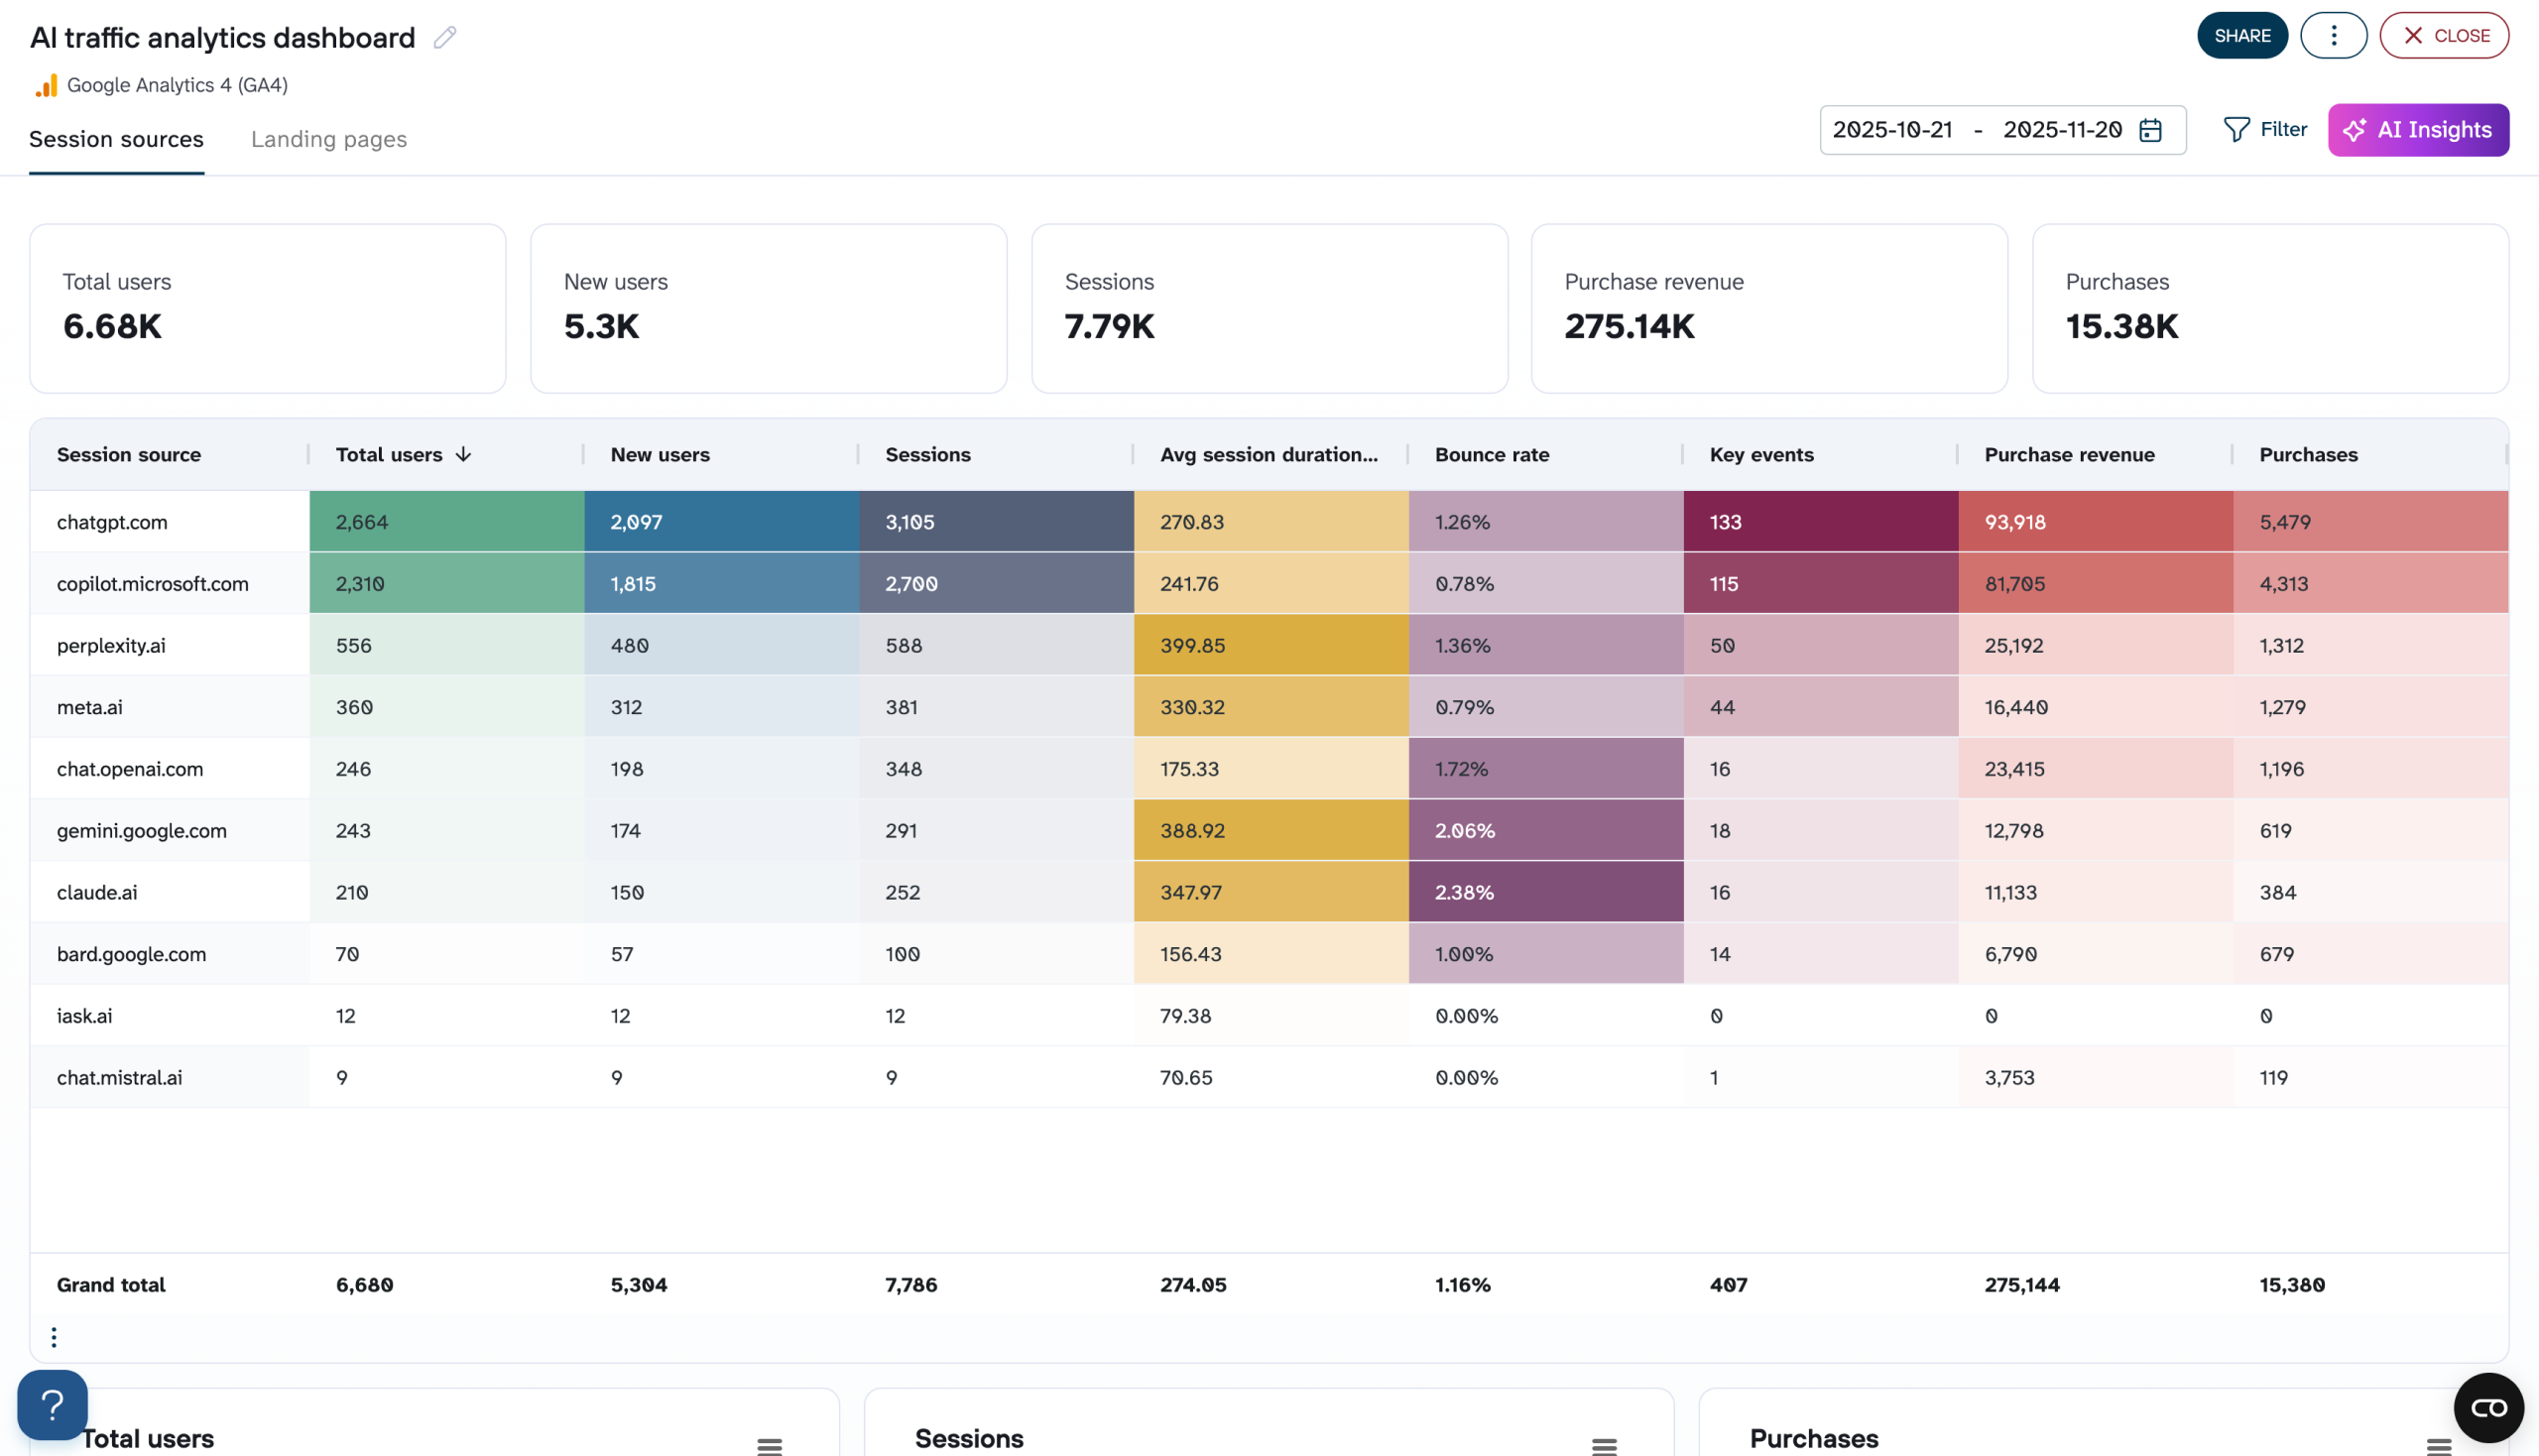
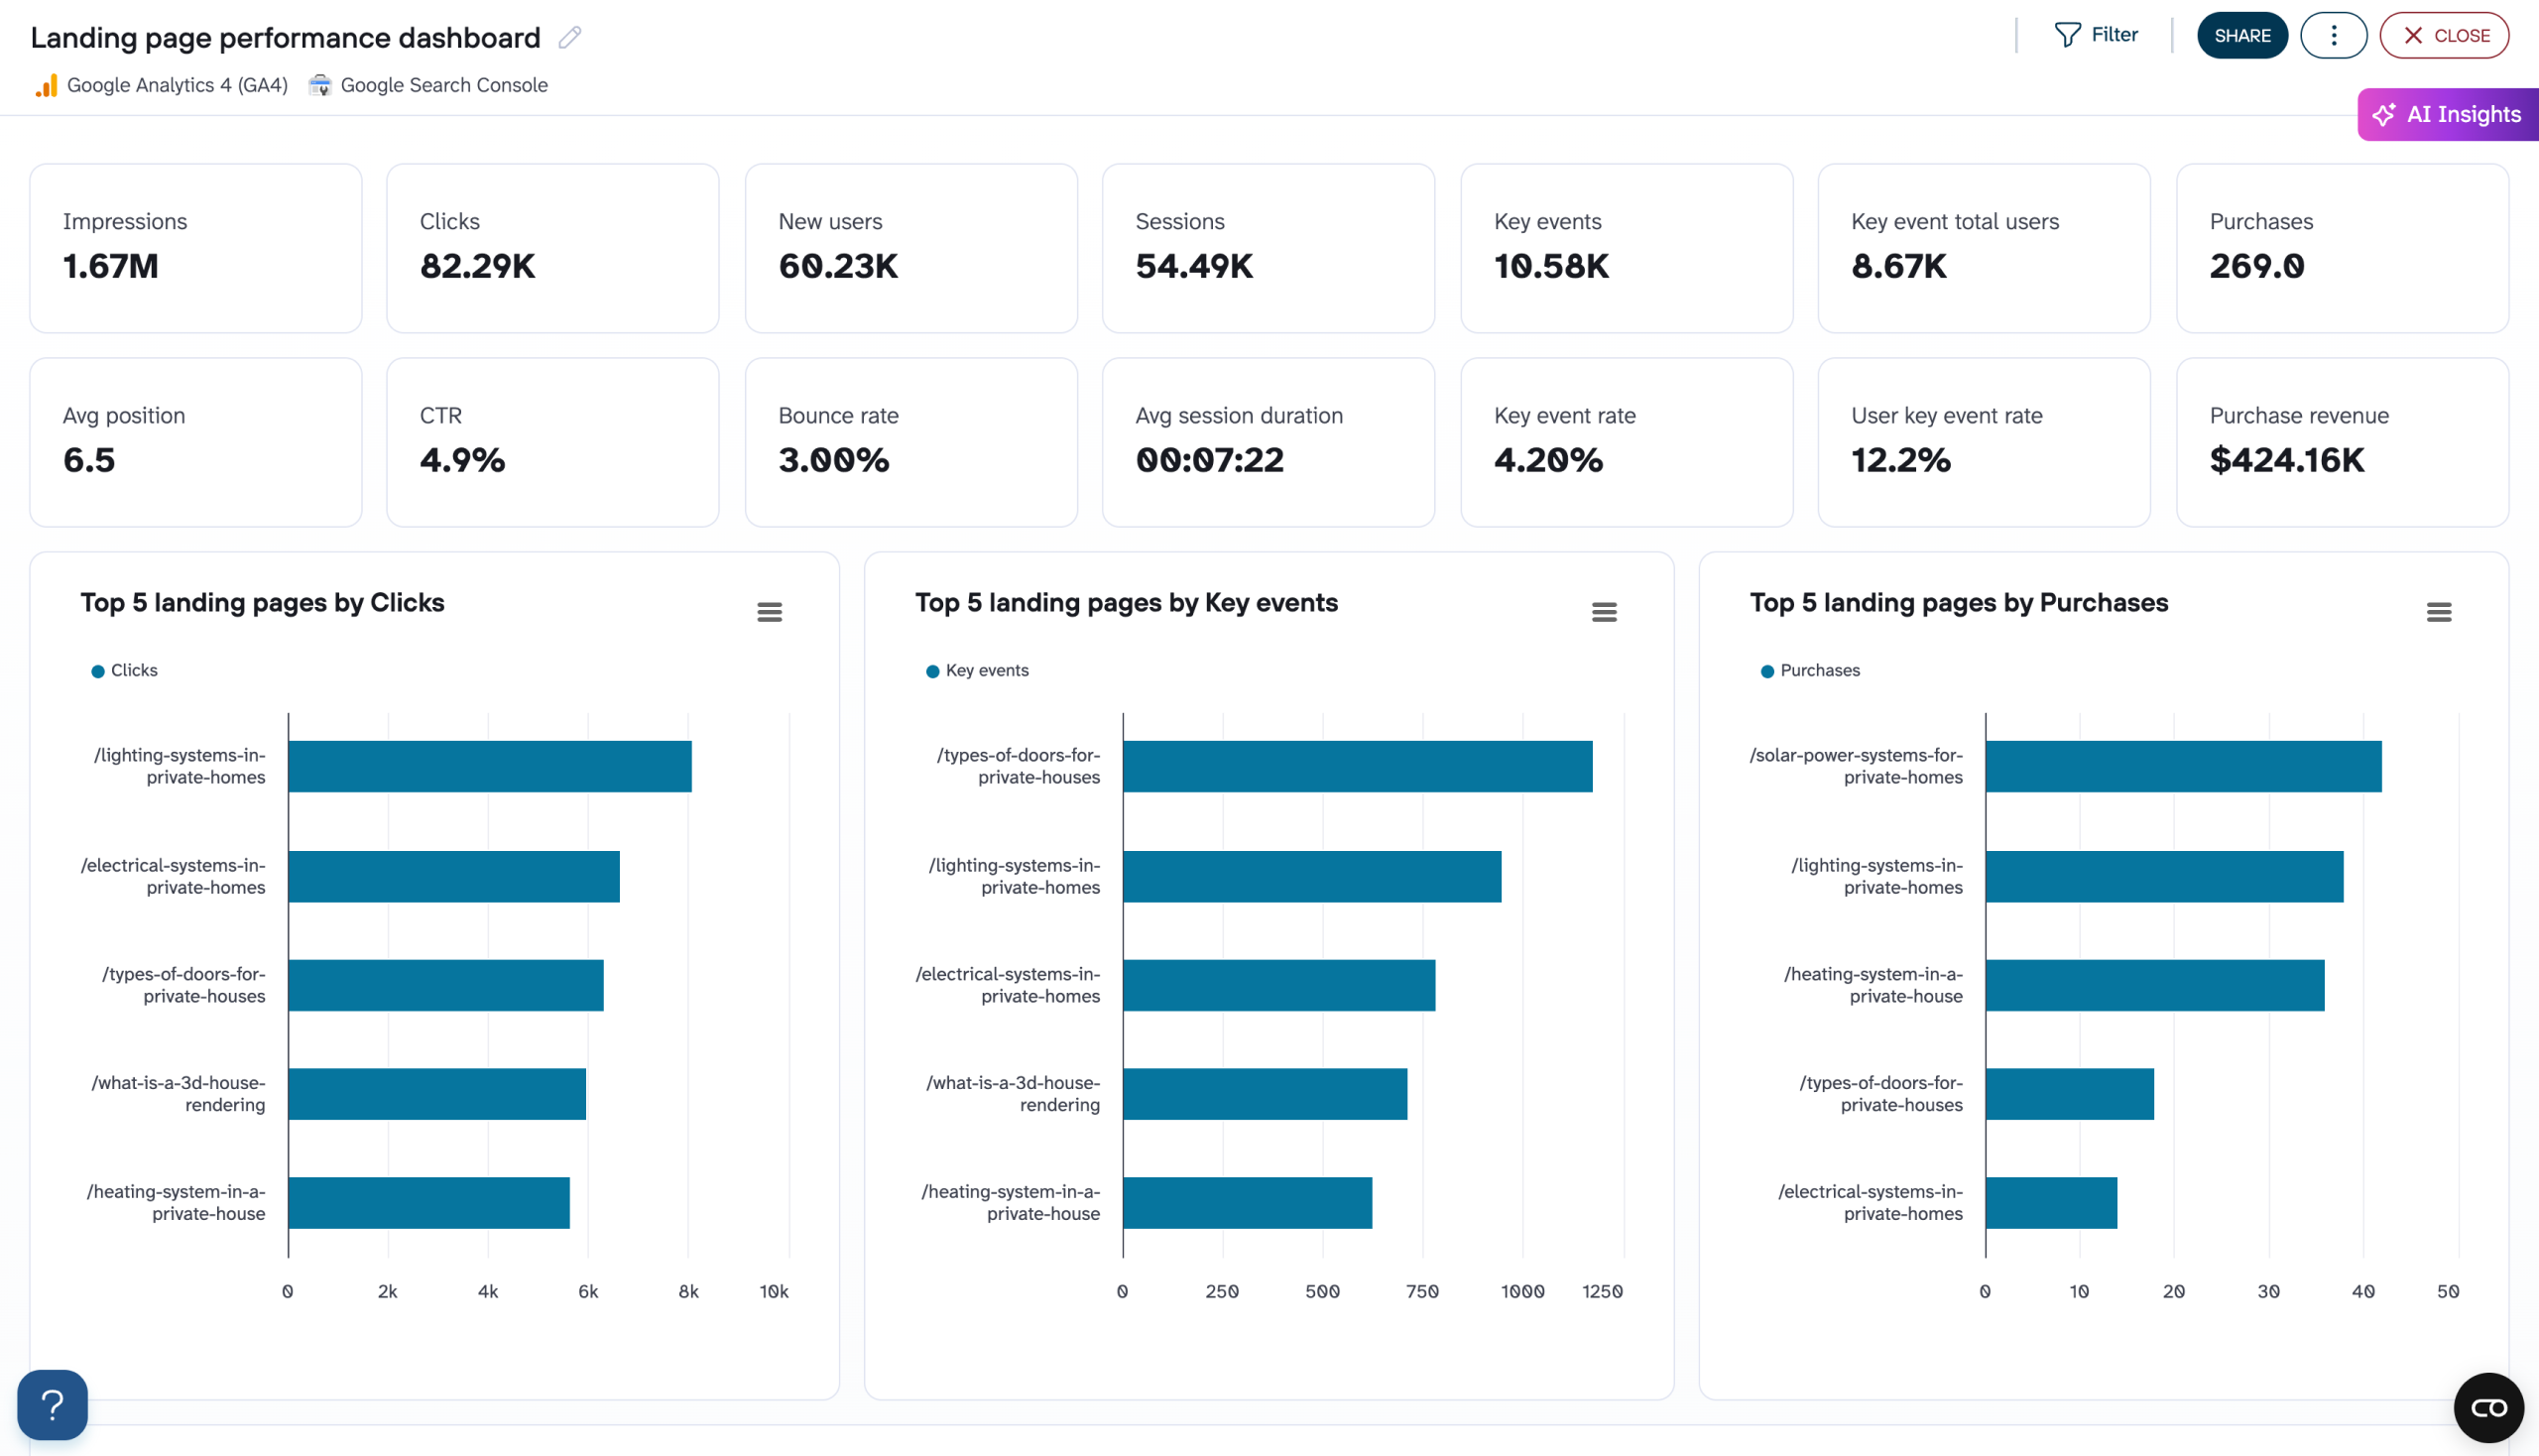
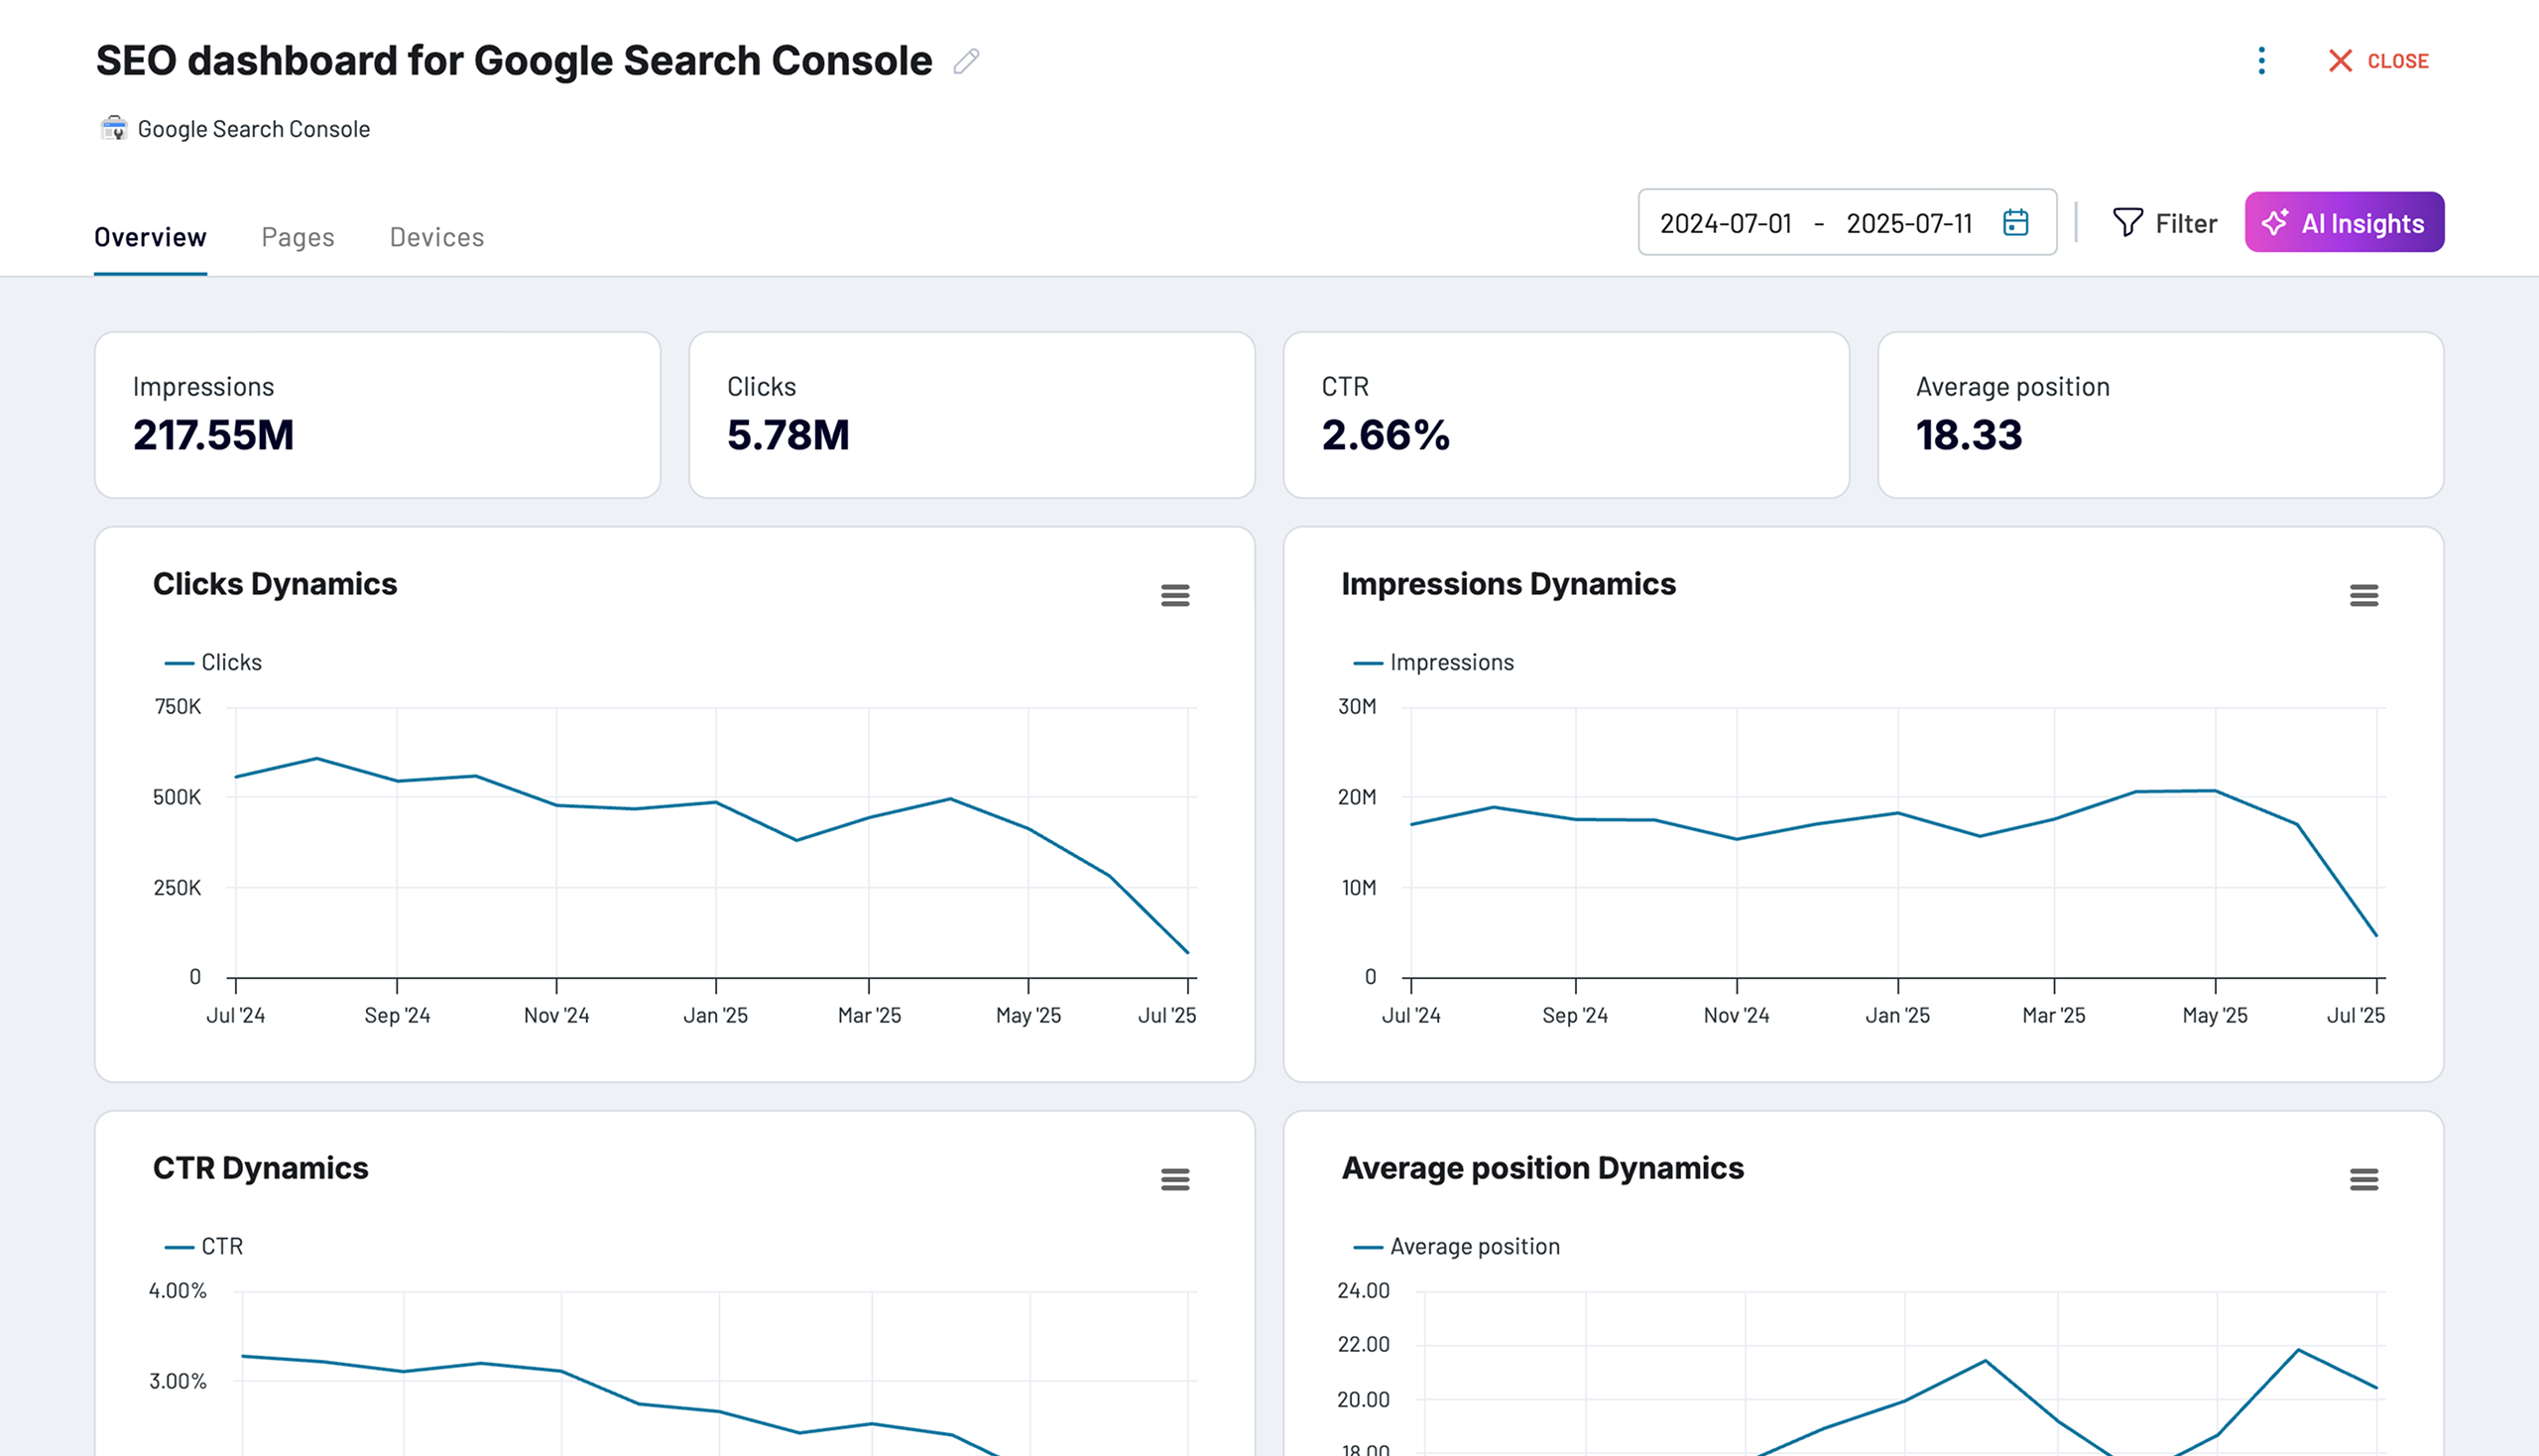
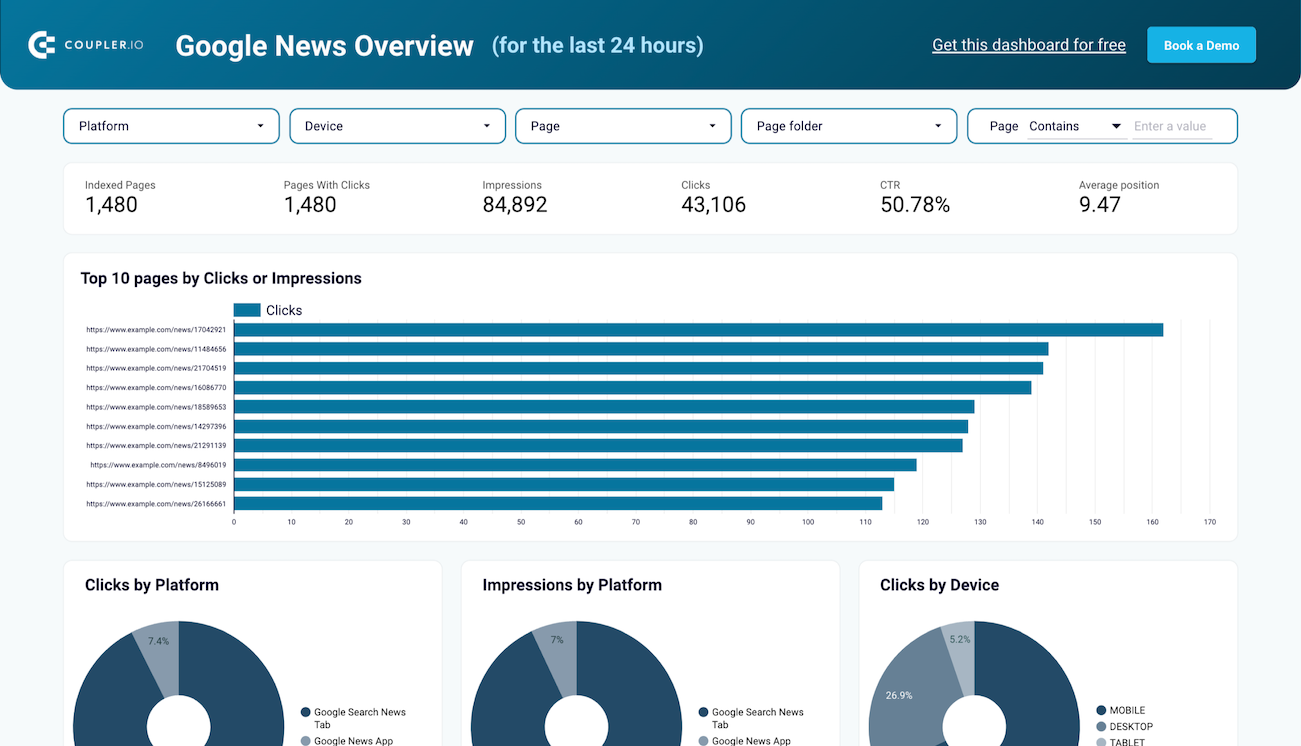
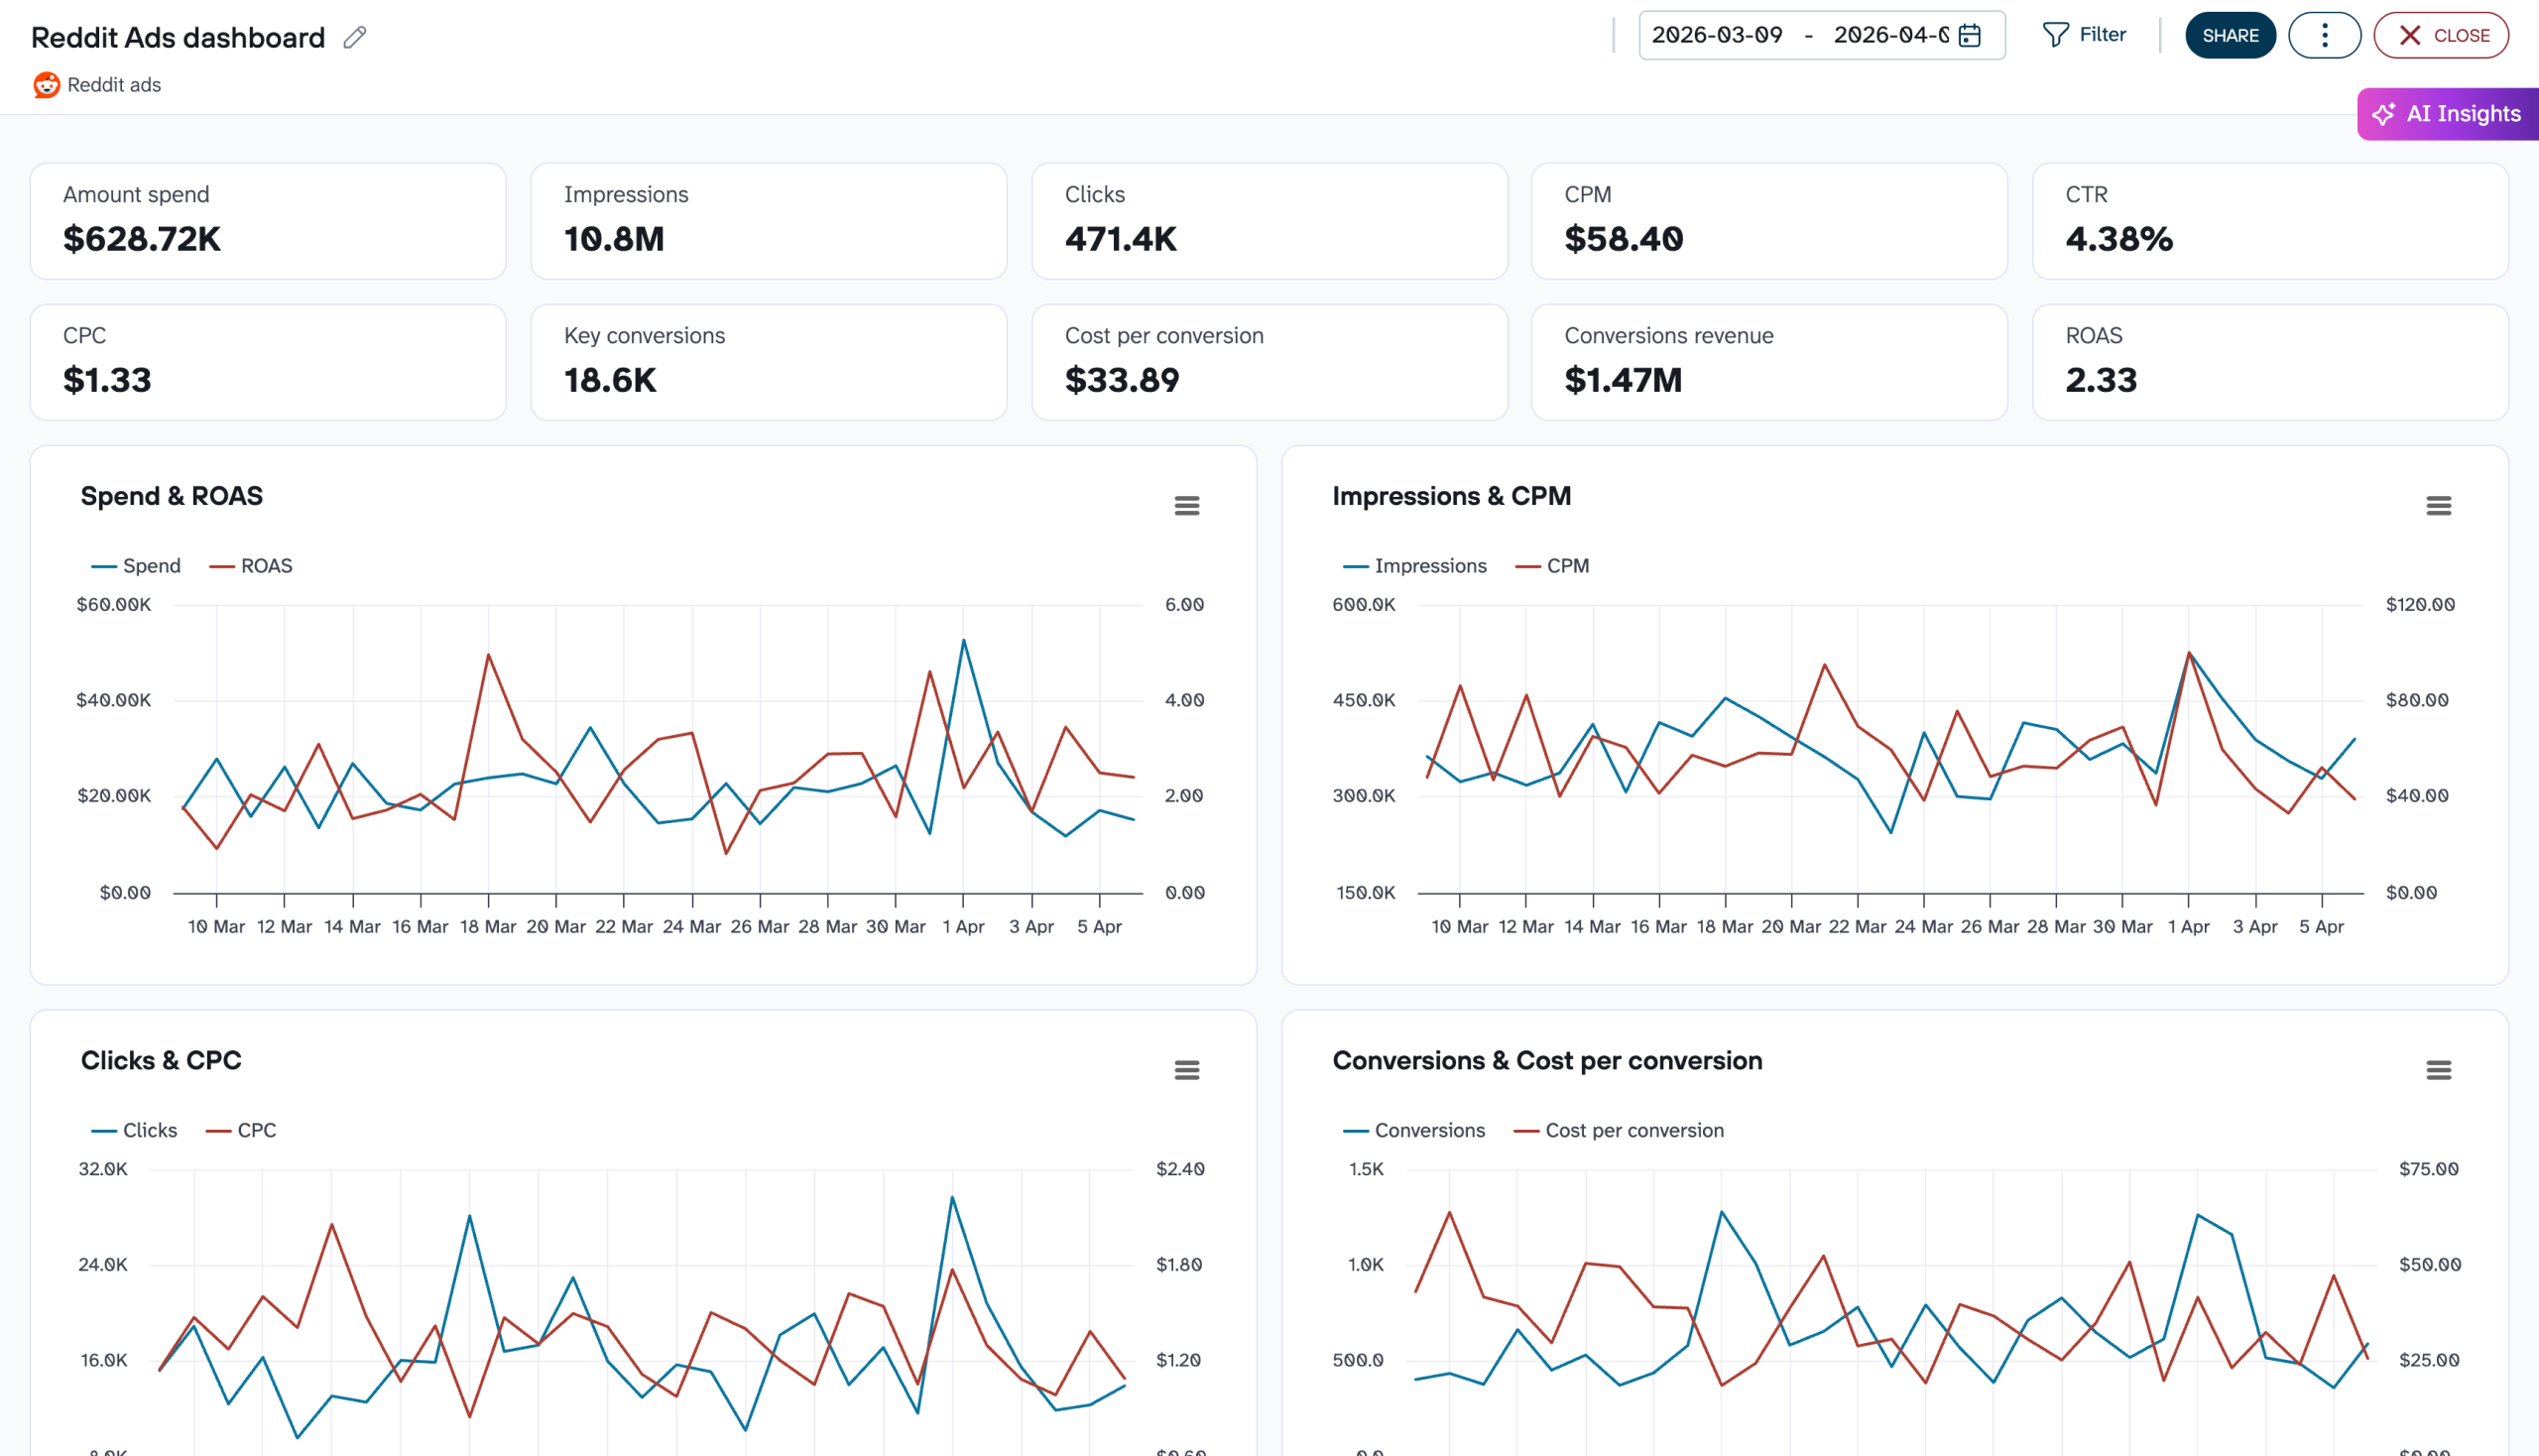
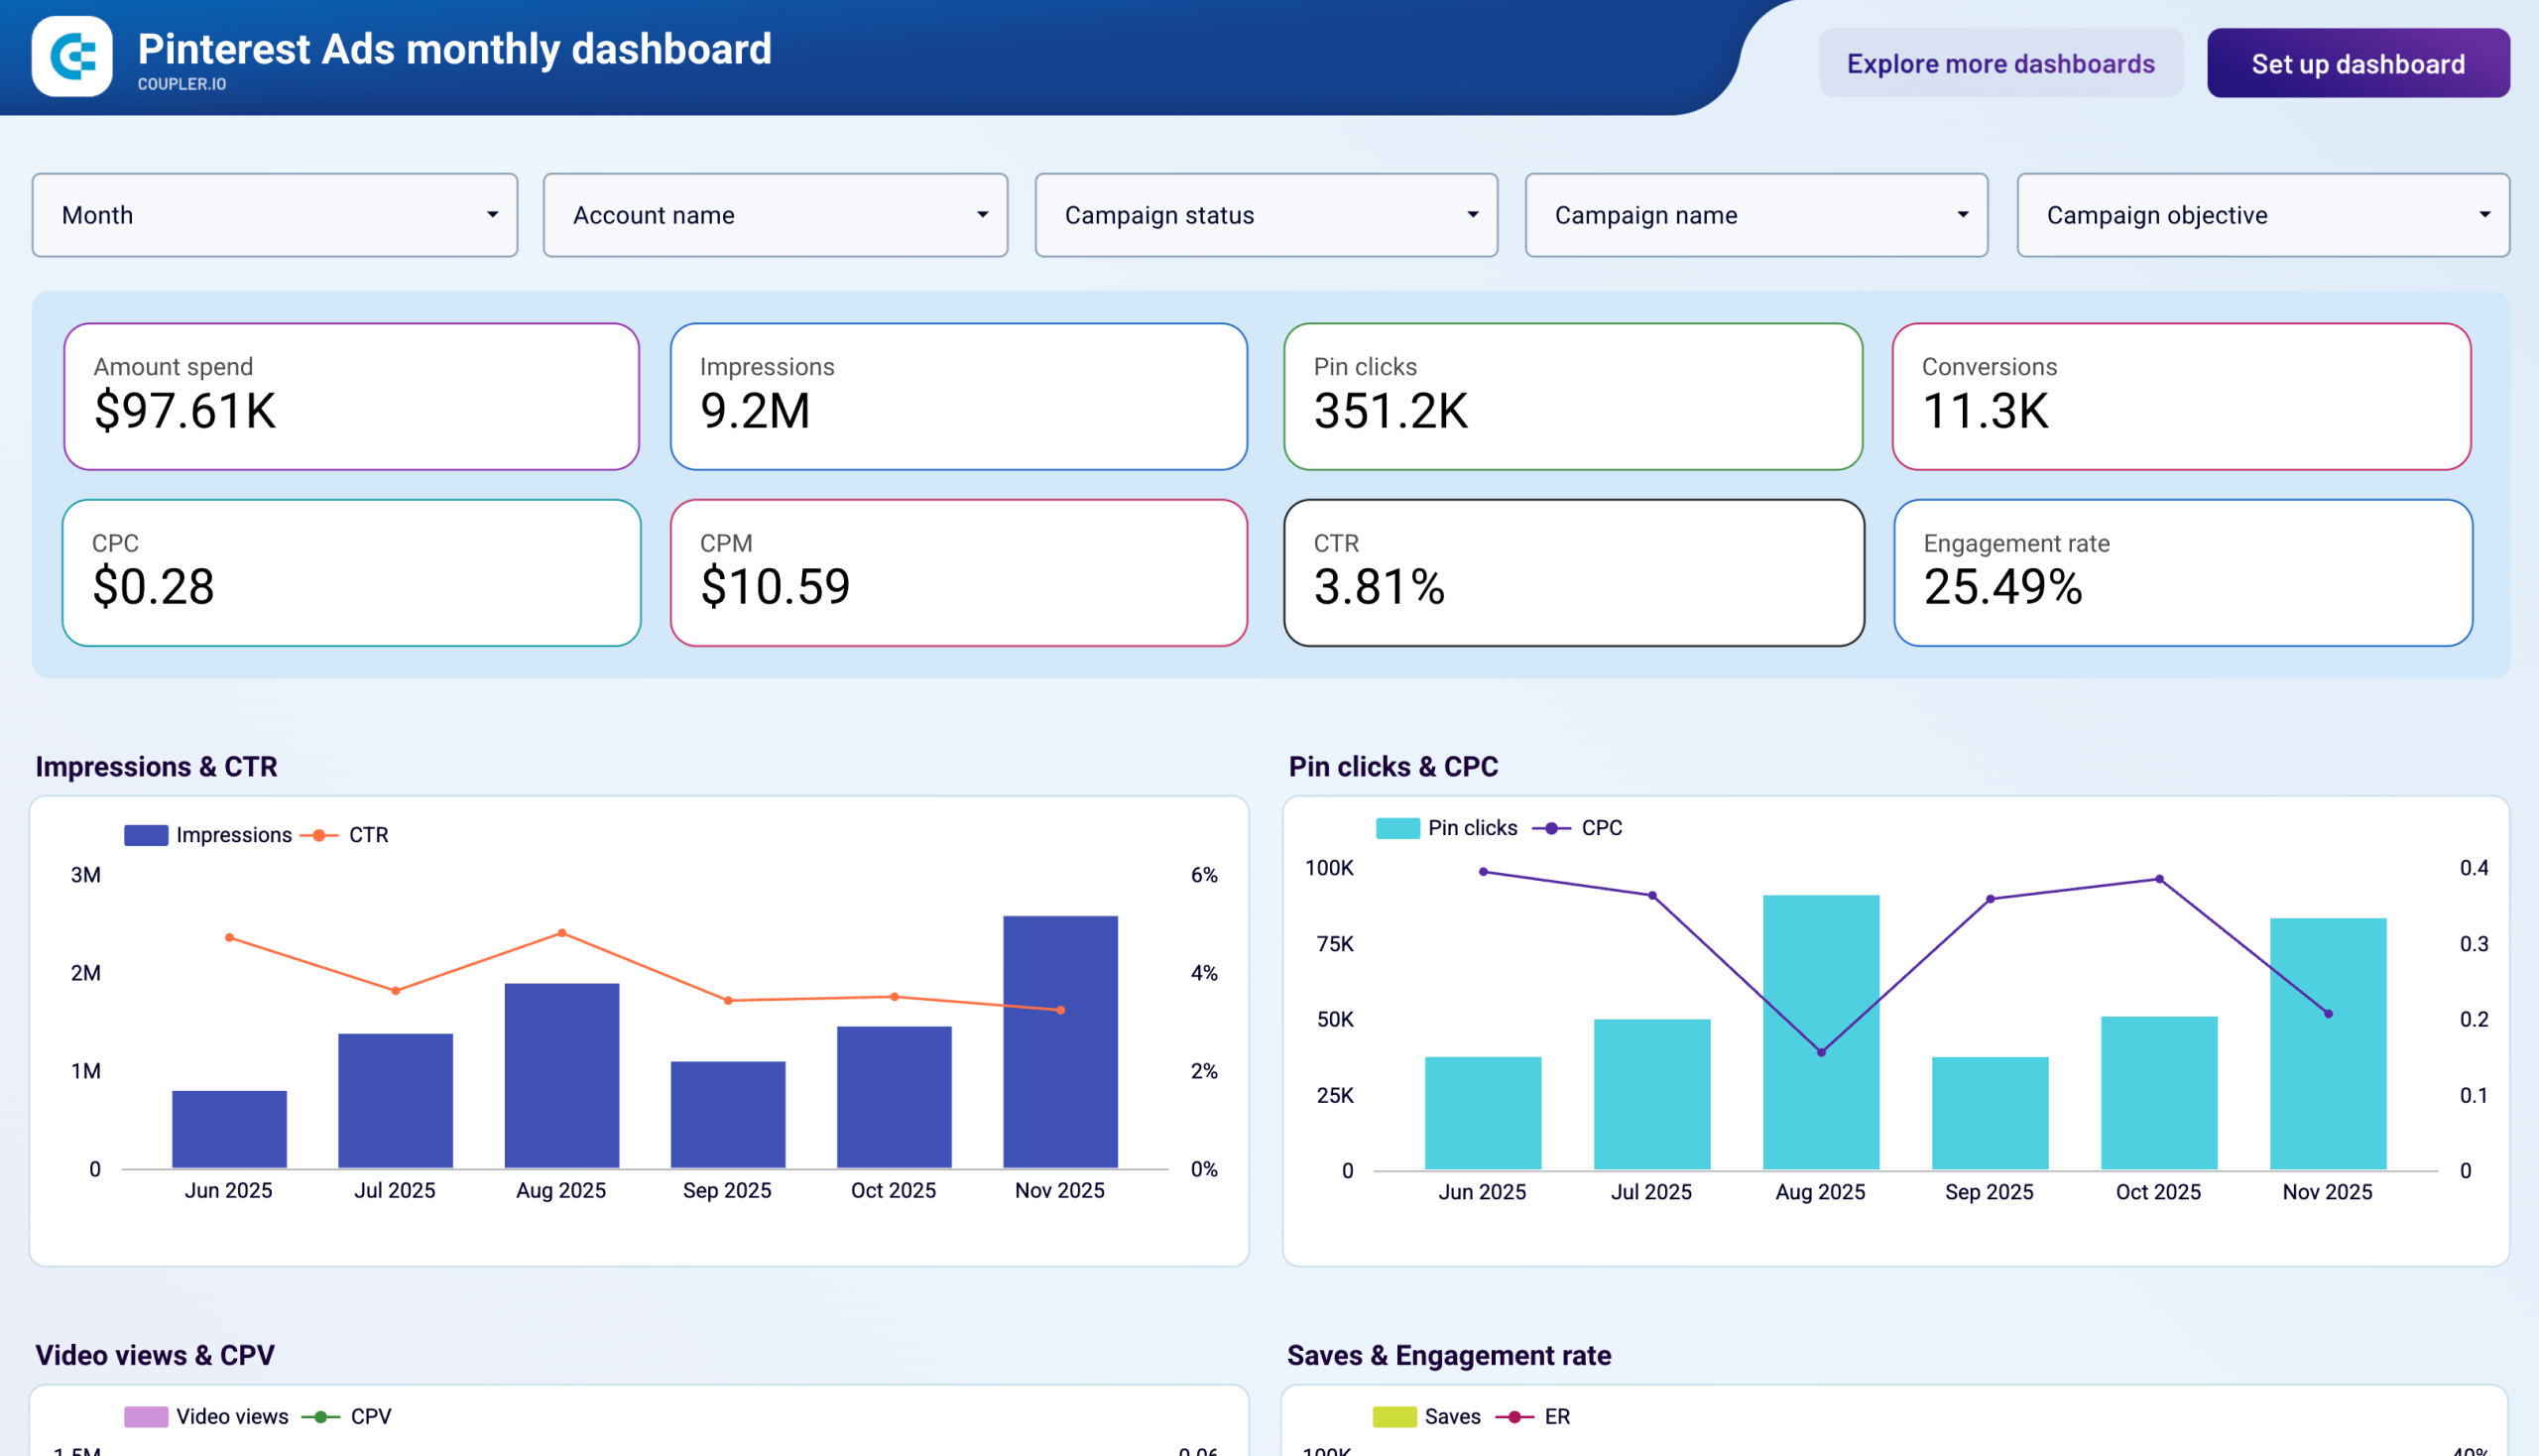
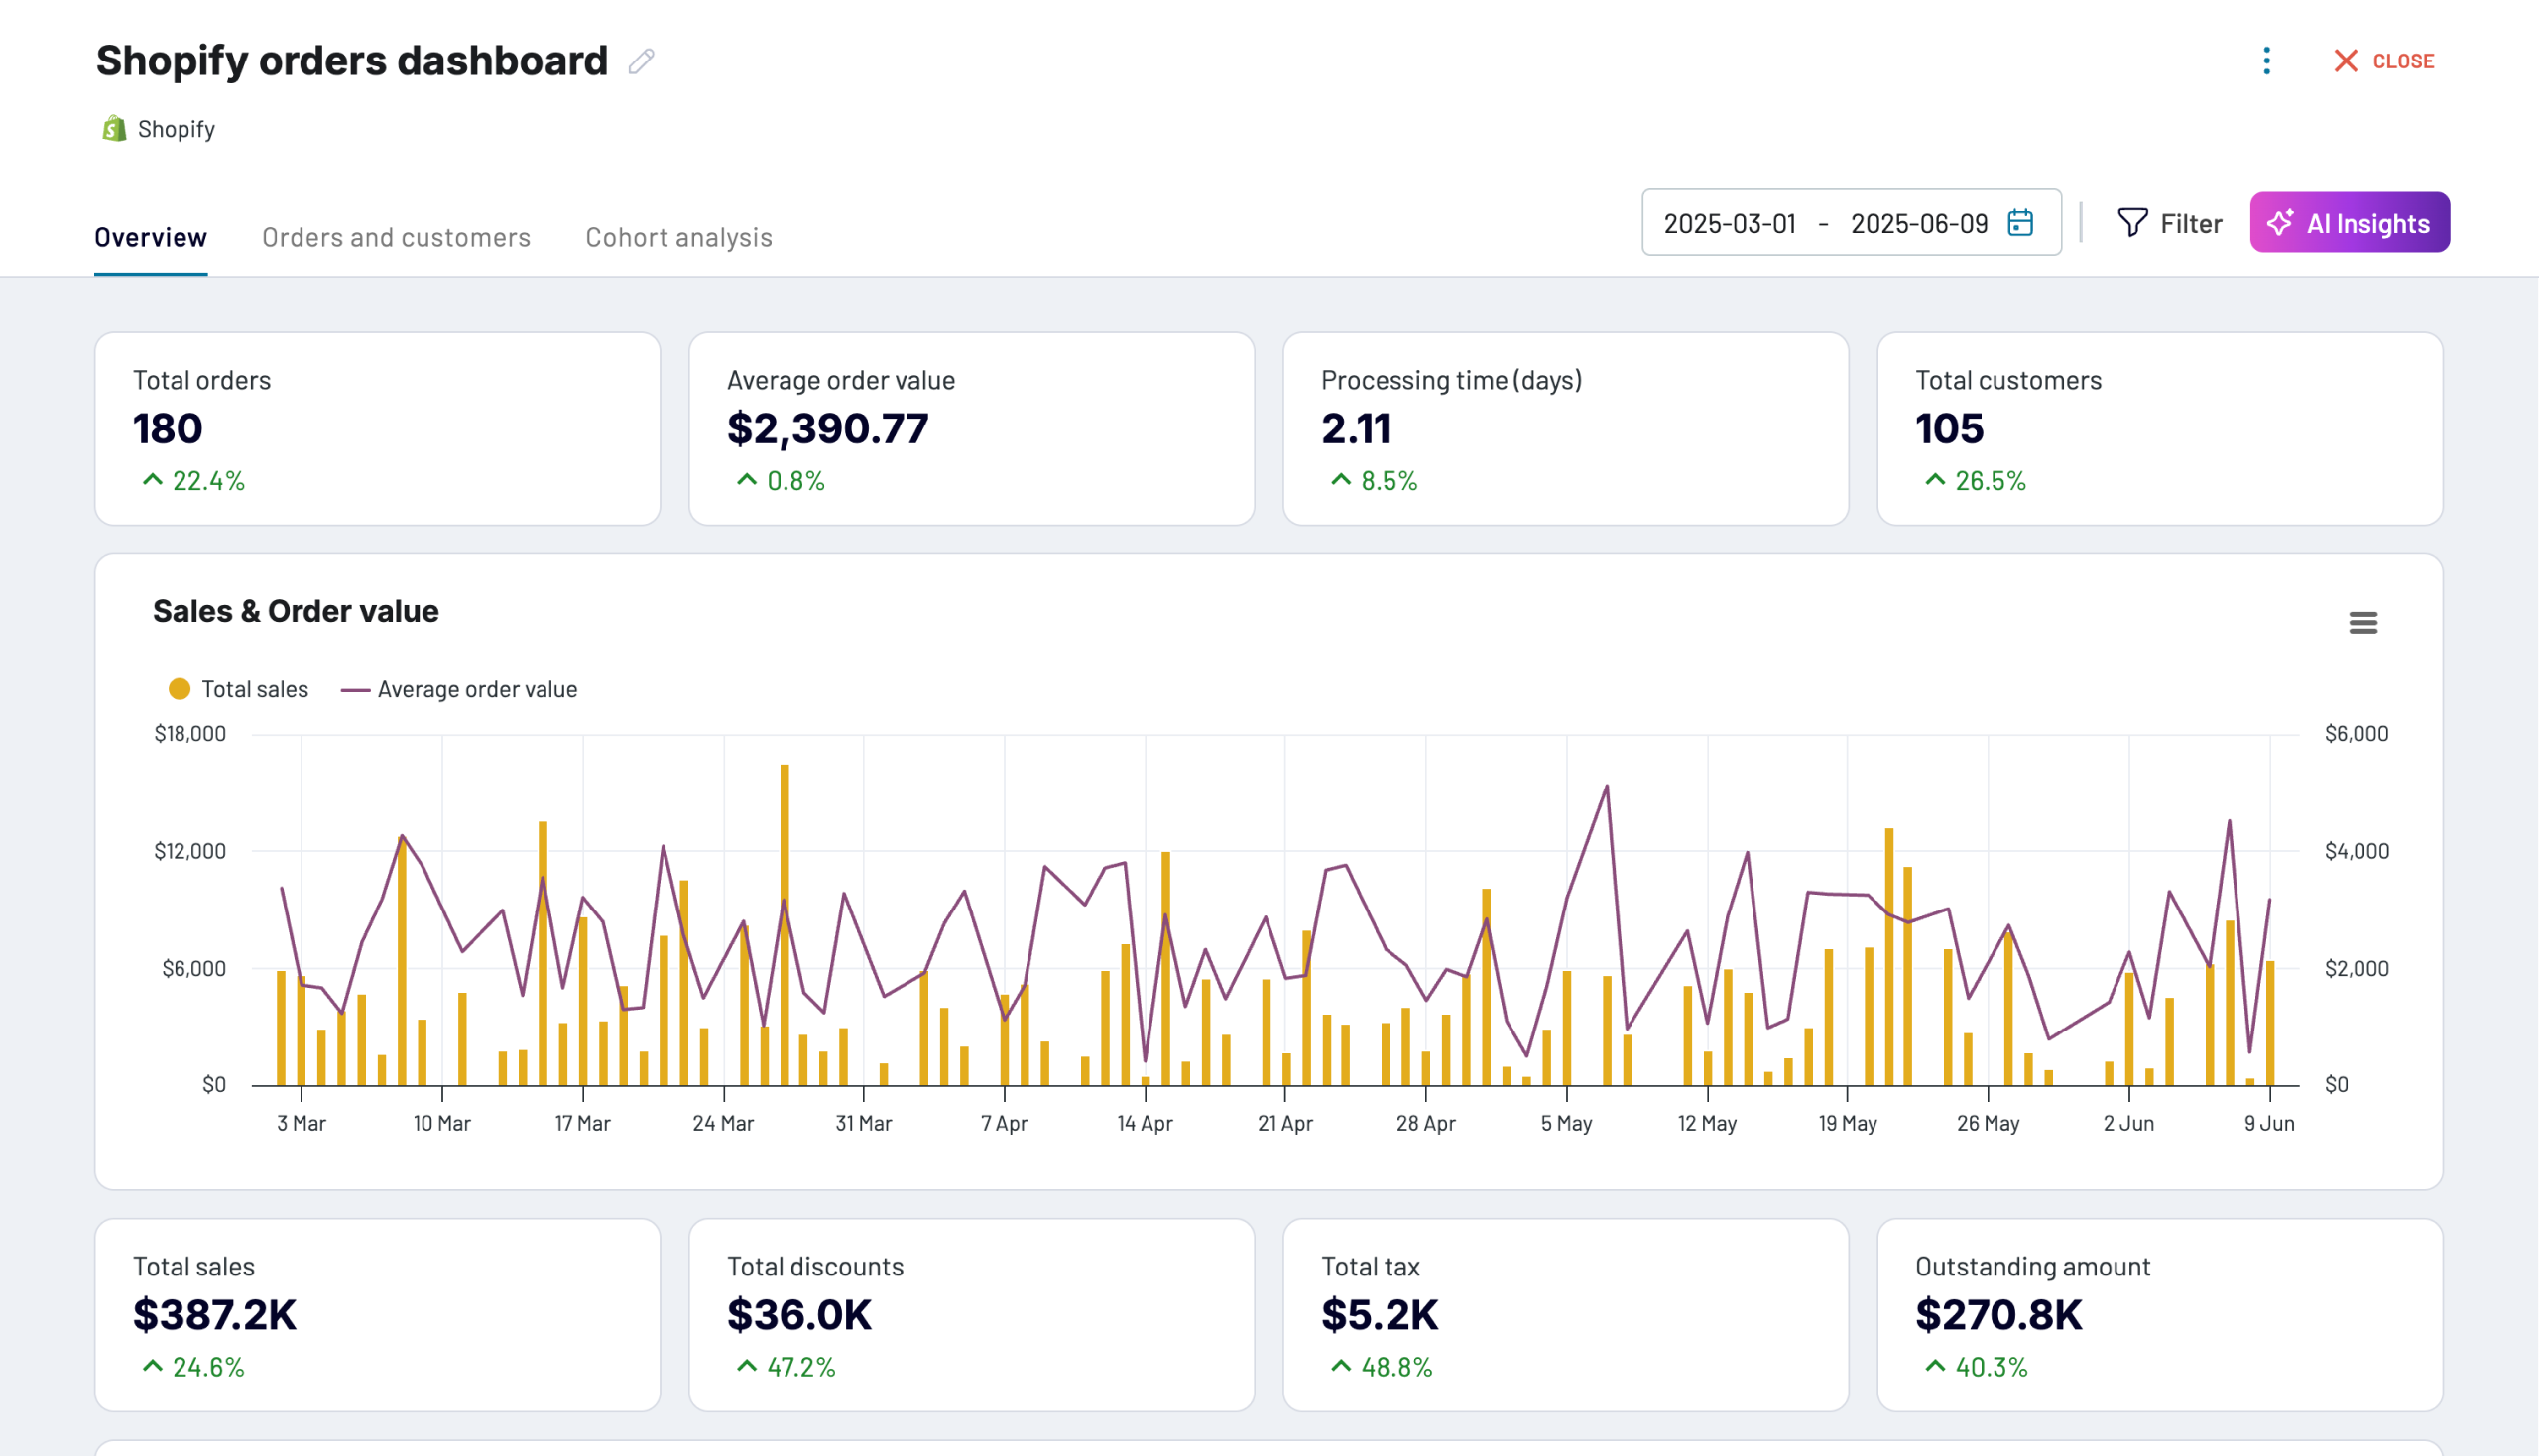
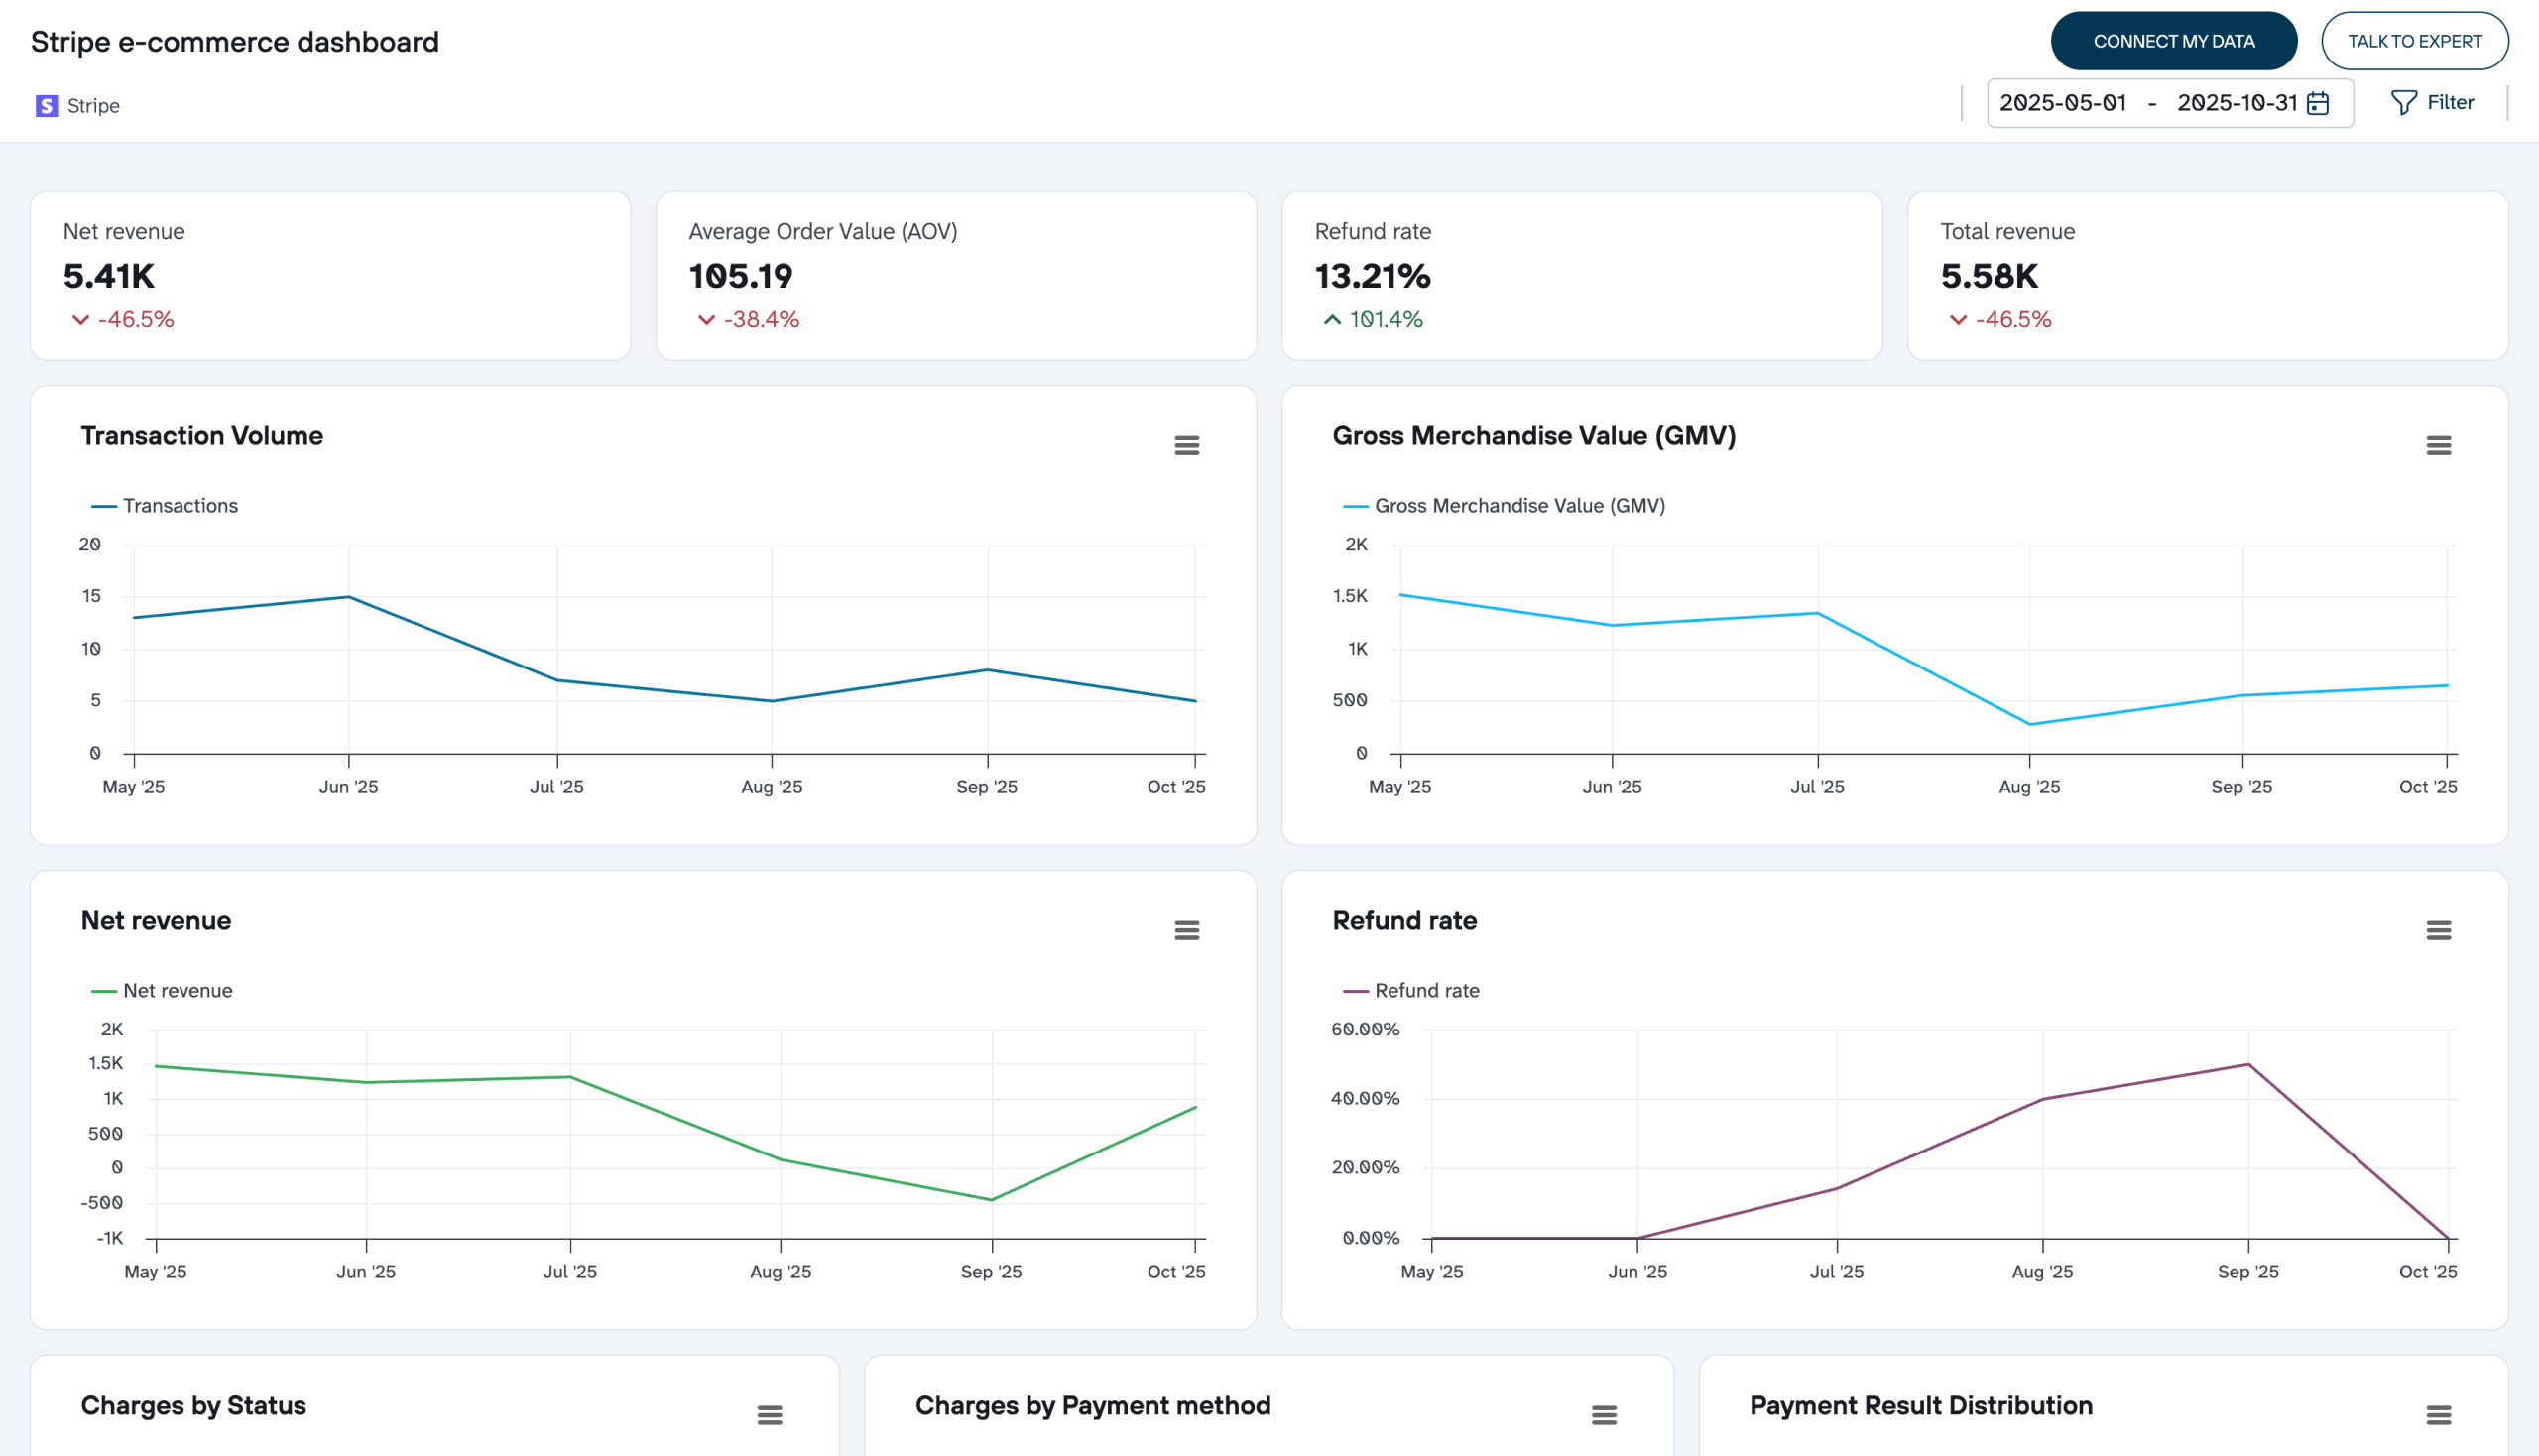
Get analysis-ready data with Coupler.io and build dashboards using Looker Studio or other BI tools in minutes.

Schedule the refresh of your TikTok Ads data and build triggered automation sequences using incoming and outgoing webhooks.

Integrate TikTok Ads with these destinations


What data you can export from TikTok Ads?
-
Basic campaign report
-
Basic ad group report
-
Basic ad report
-
GMV Max campaign report
-
Campaigns
-
Ads
-
Basic advertiser report
-
Audience campaign report
-
Audience advertiser report
-
Audience ad report
-
Audience ad group report
-
Playable Ad report
-
Playable Ad report by country
-
Dynamic Showcase Ads (DSA) campaign report
-
Dynamic Showcase Ads (DSA) report
-
Dynamic Showcase Ads (DSA) advertiser report
-
Dynamic Showcase Ads (DSA) ad group report
Coupler.io made it easy to create dashboards and reports from different data sources. The sync is reliable and the user experience is amazing.

Take your reporting to the next level
 Sign Up with Google
 Sign Up with MICROSOFT
 SIGN UP WITH EMAIL
By signing up to Coupler.io, you agree to our Privacy Policy and Terms of Use.
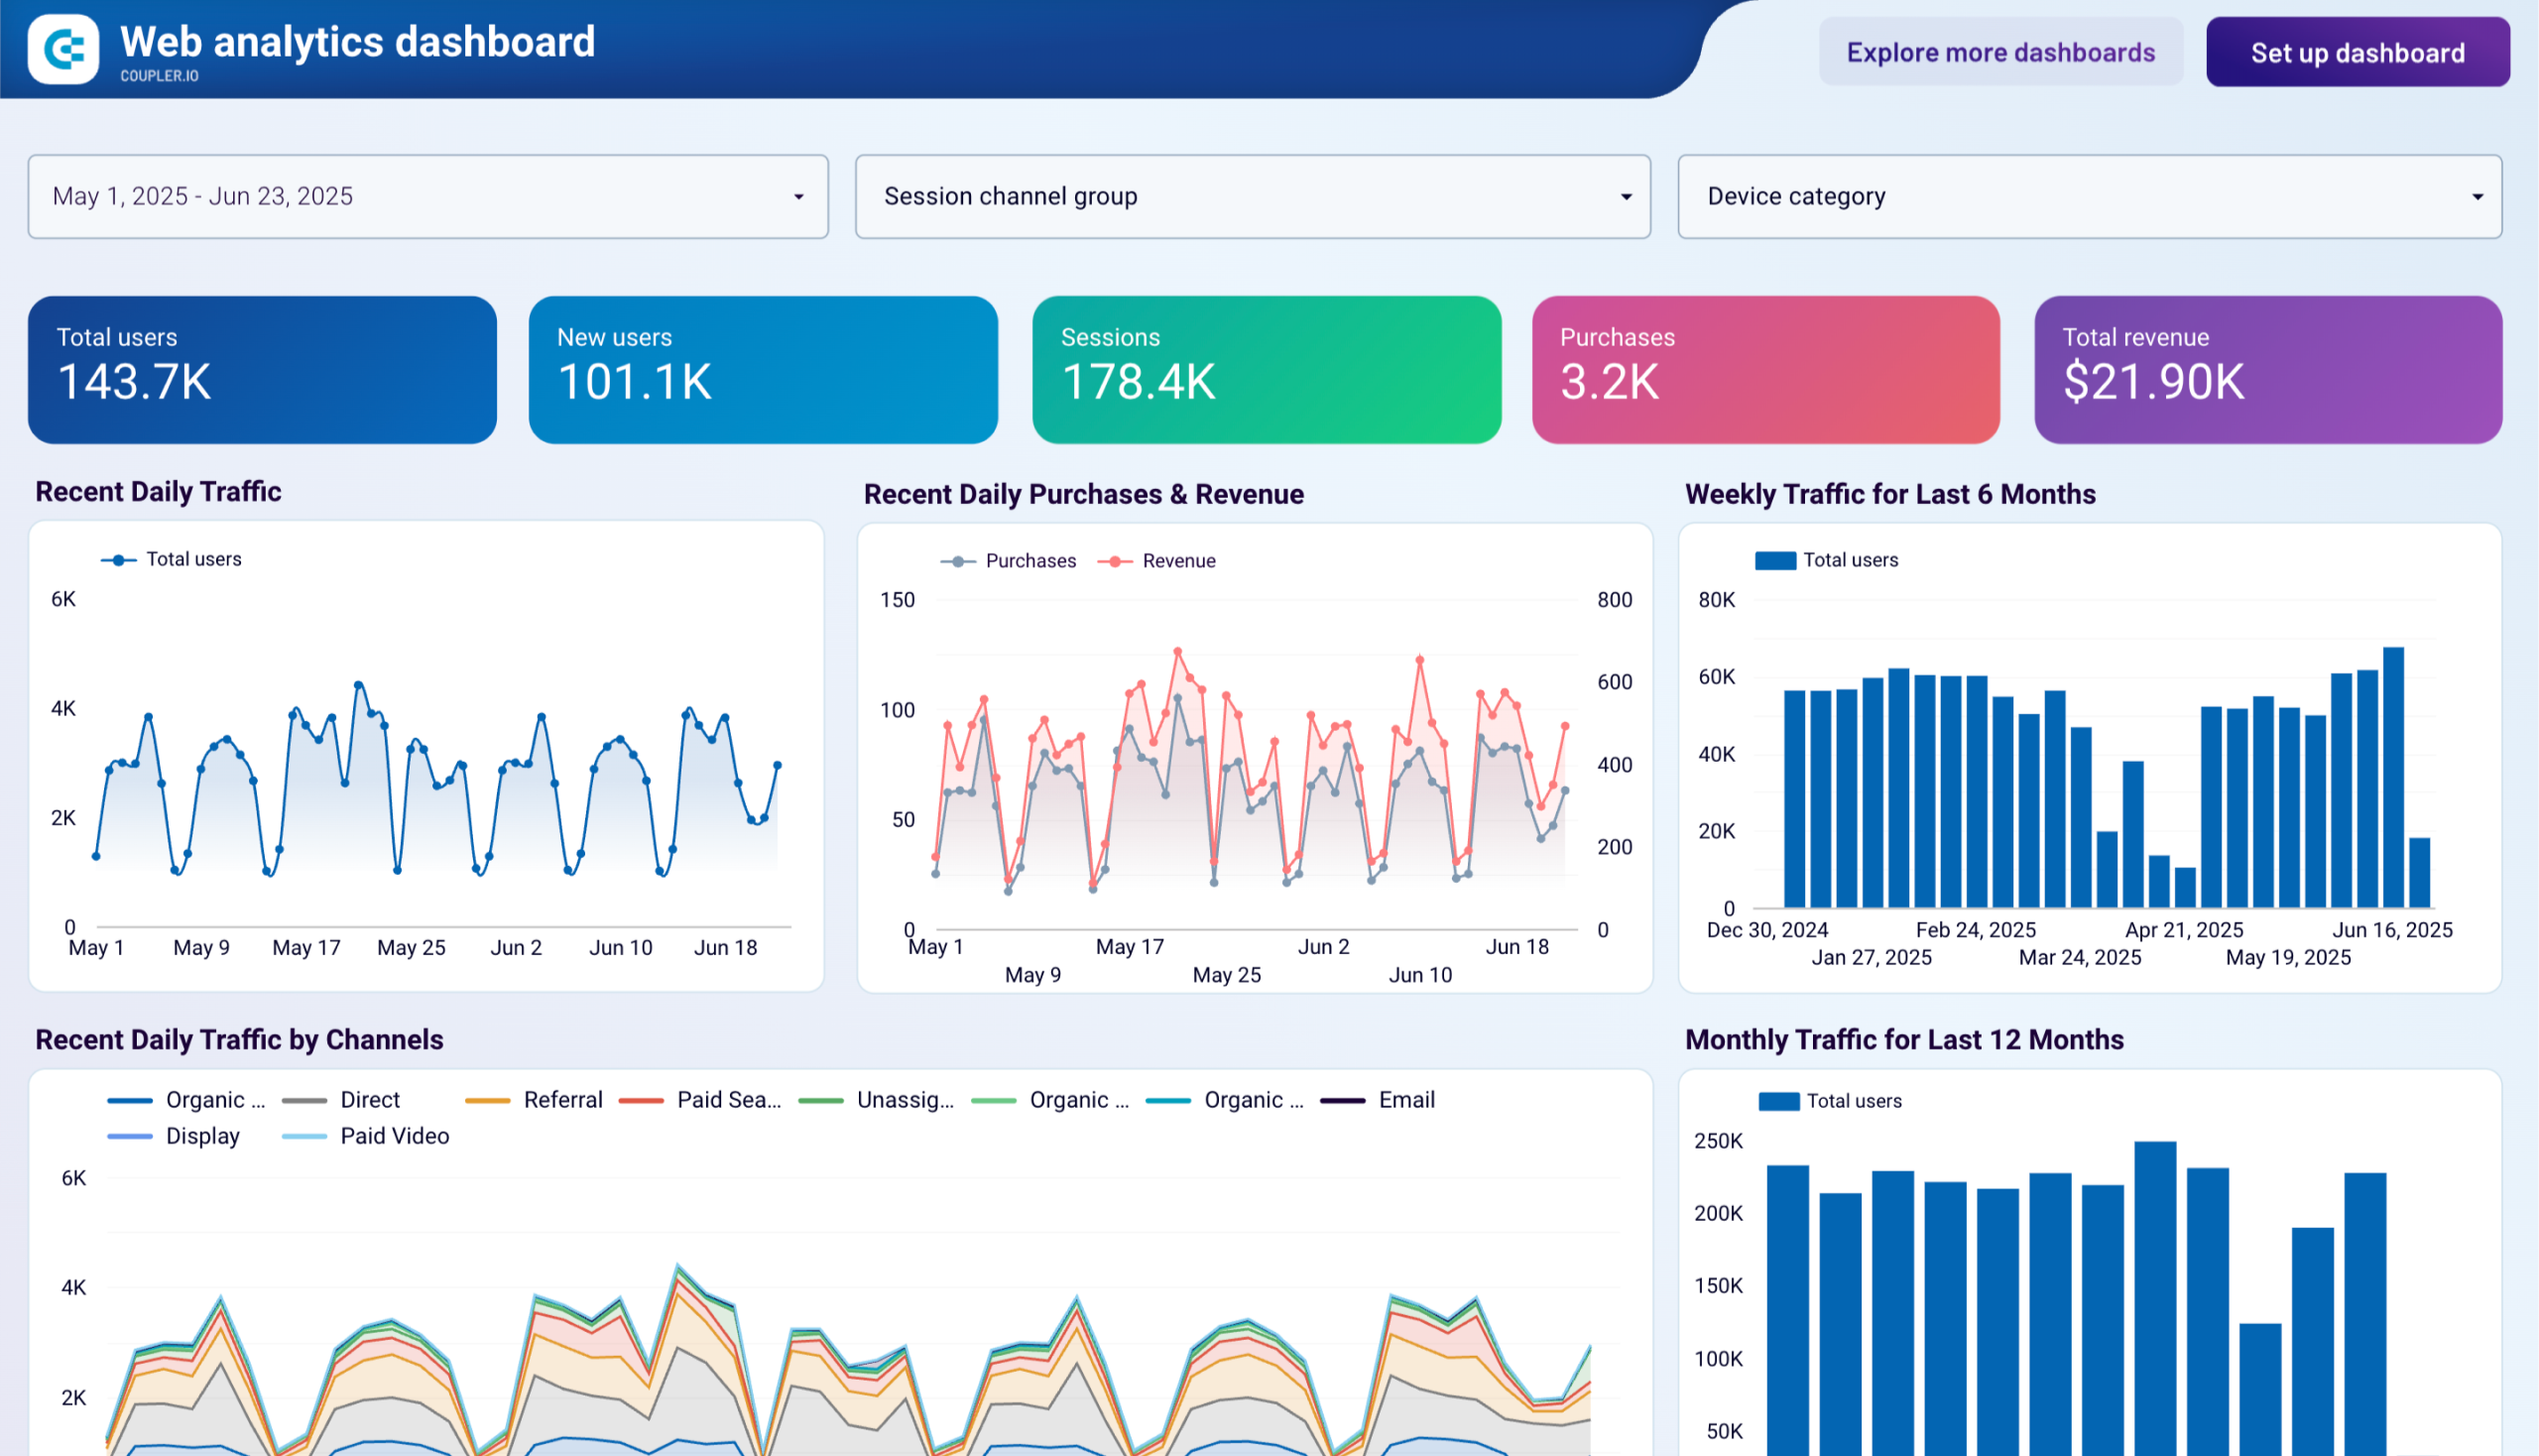
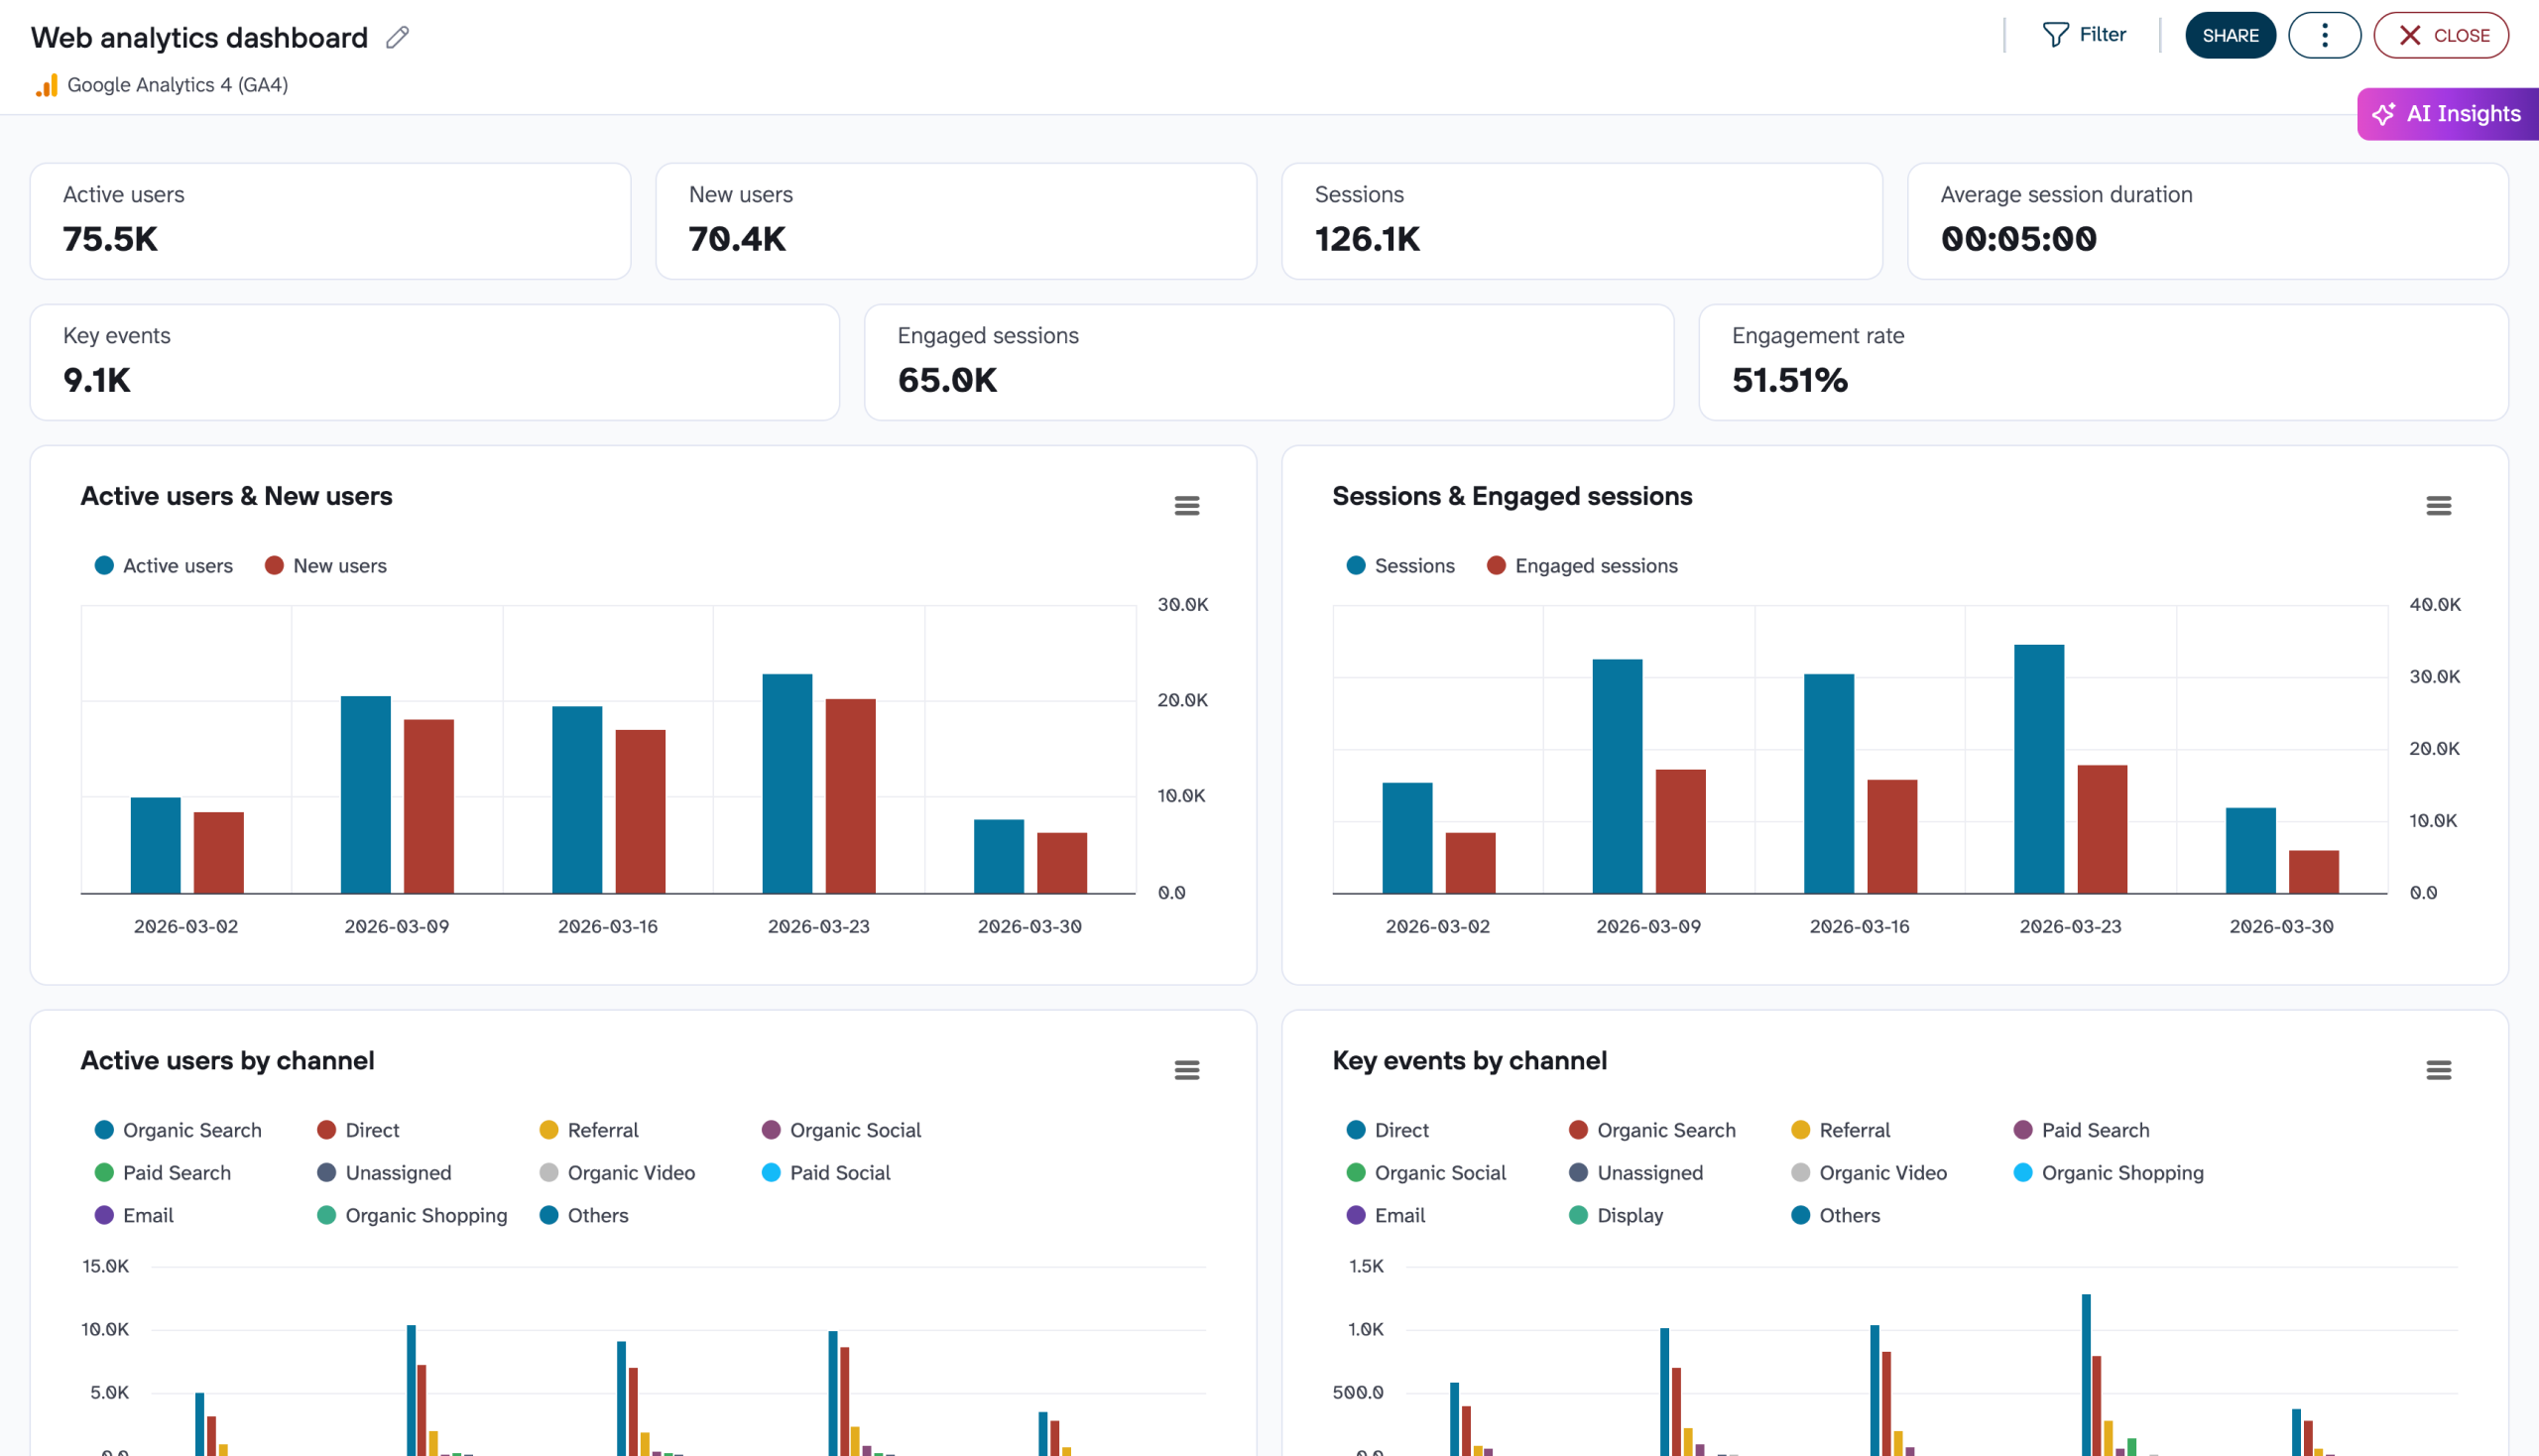
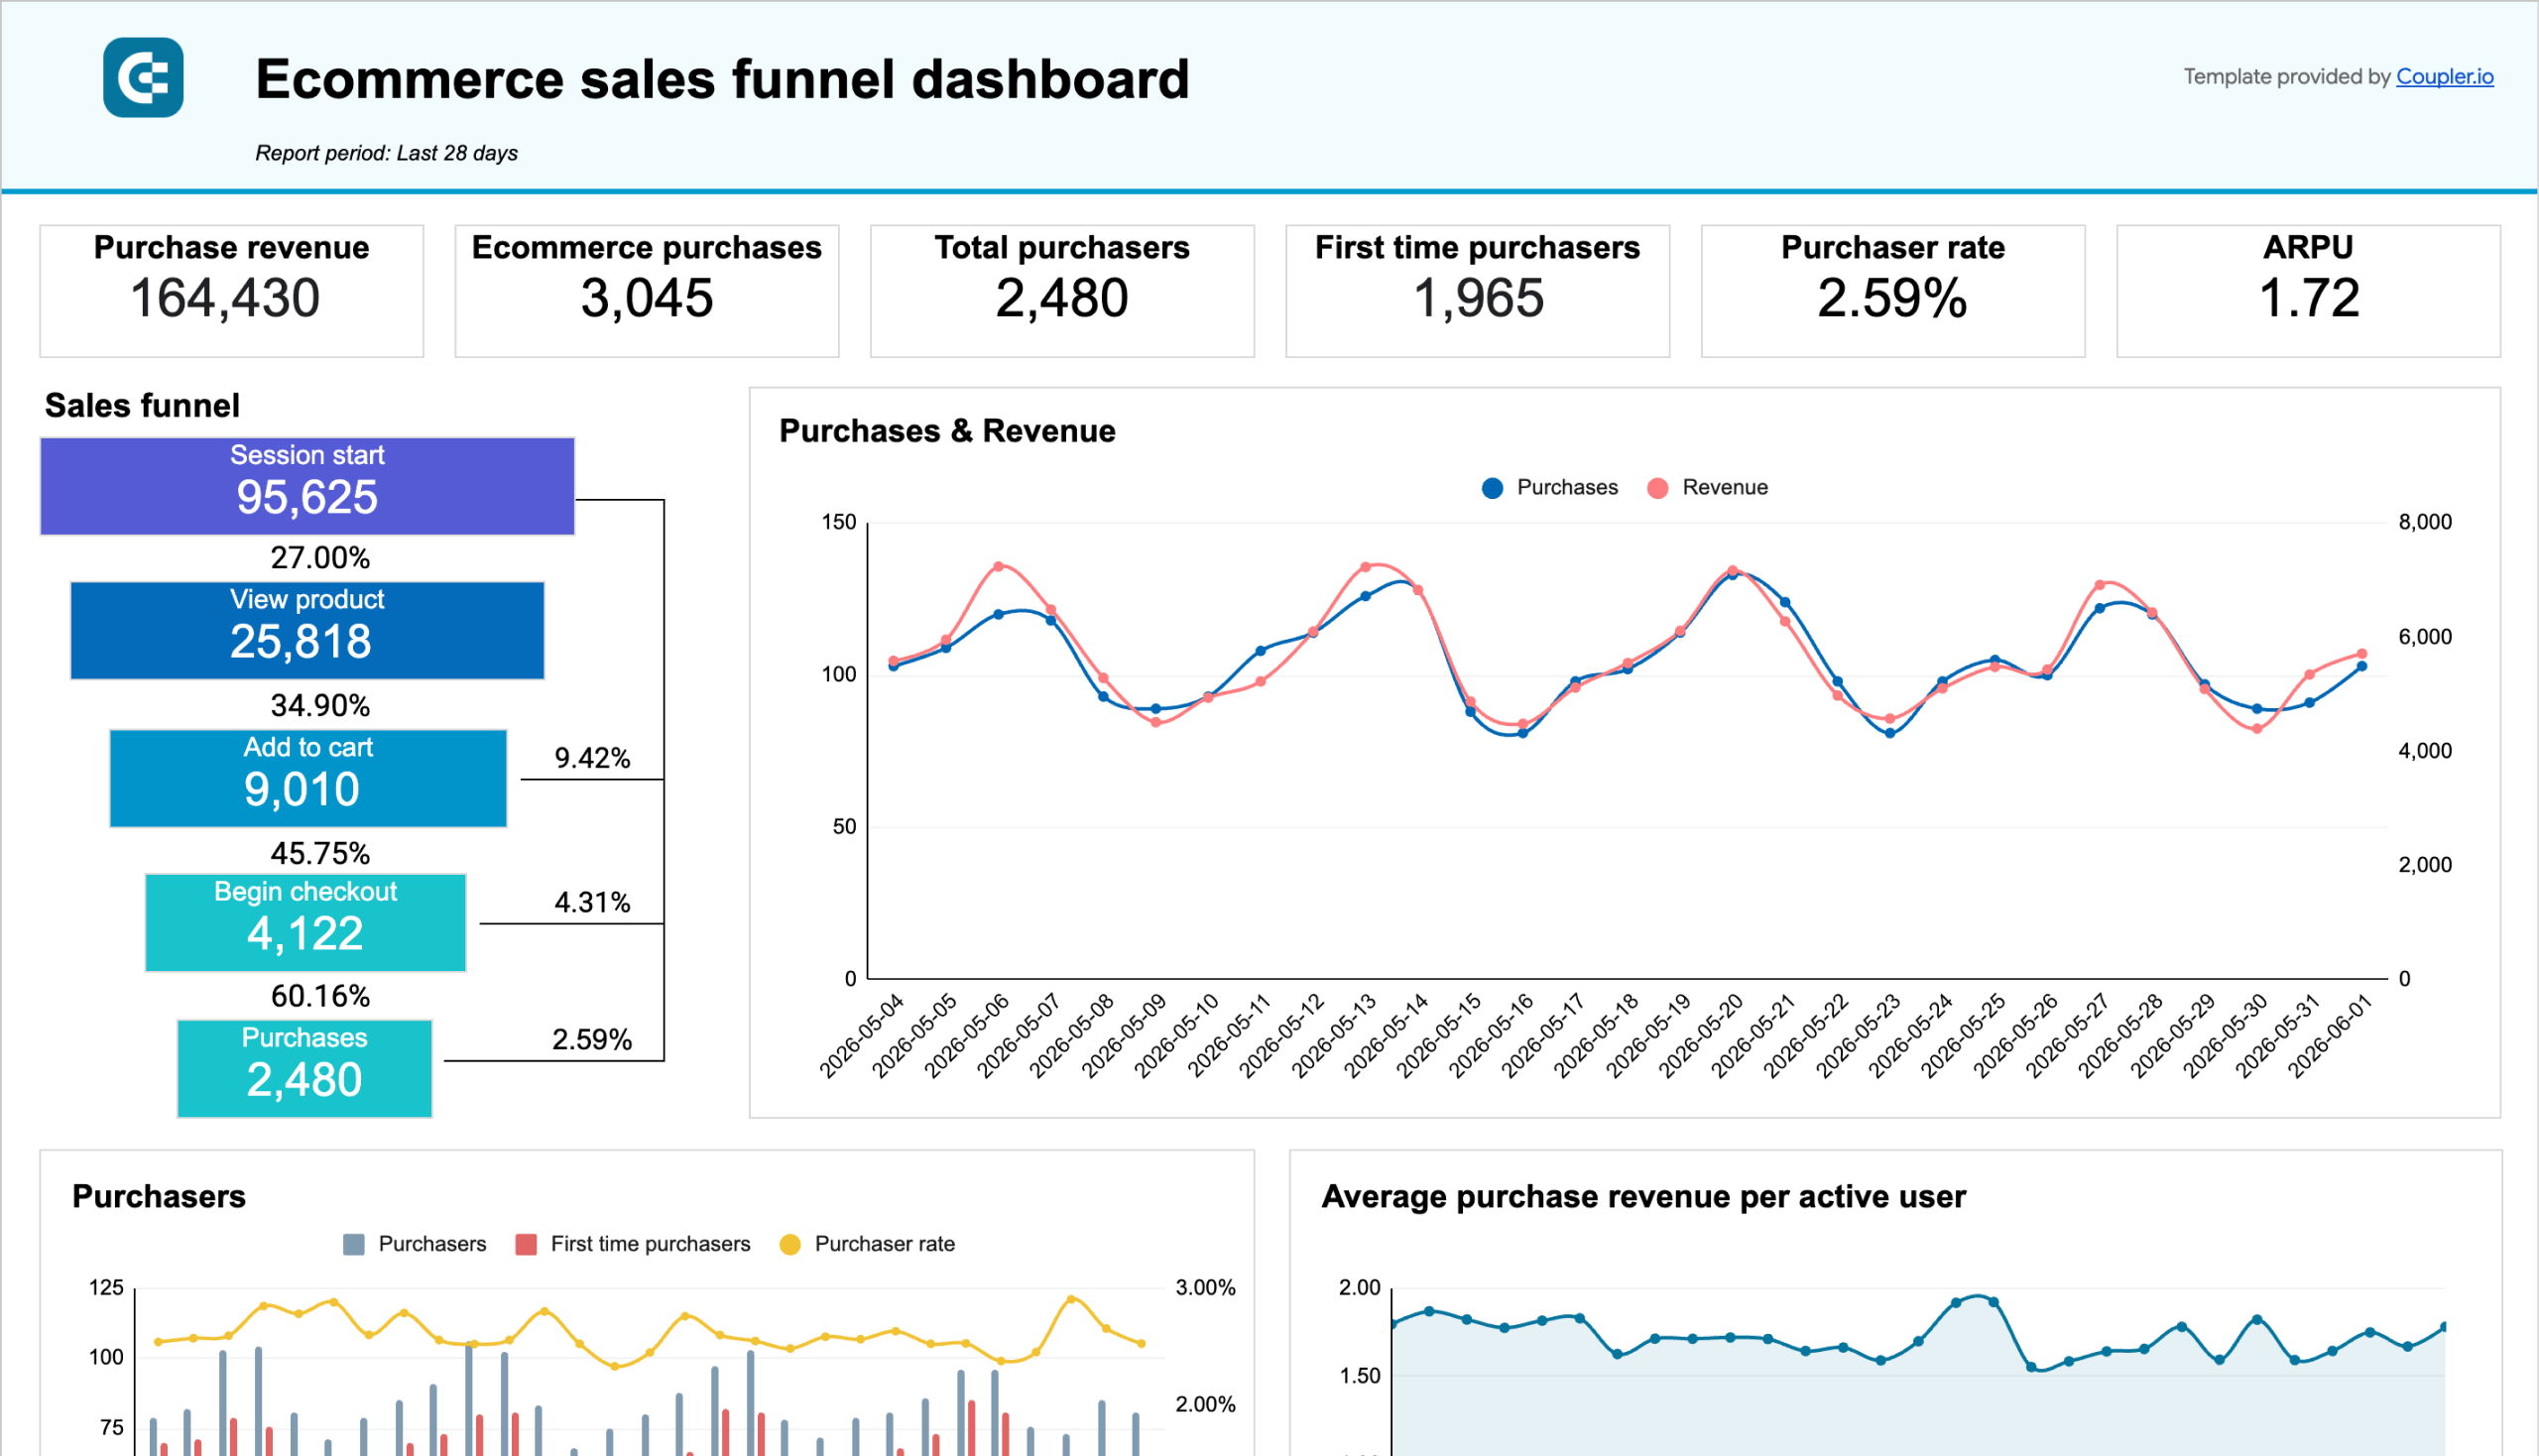
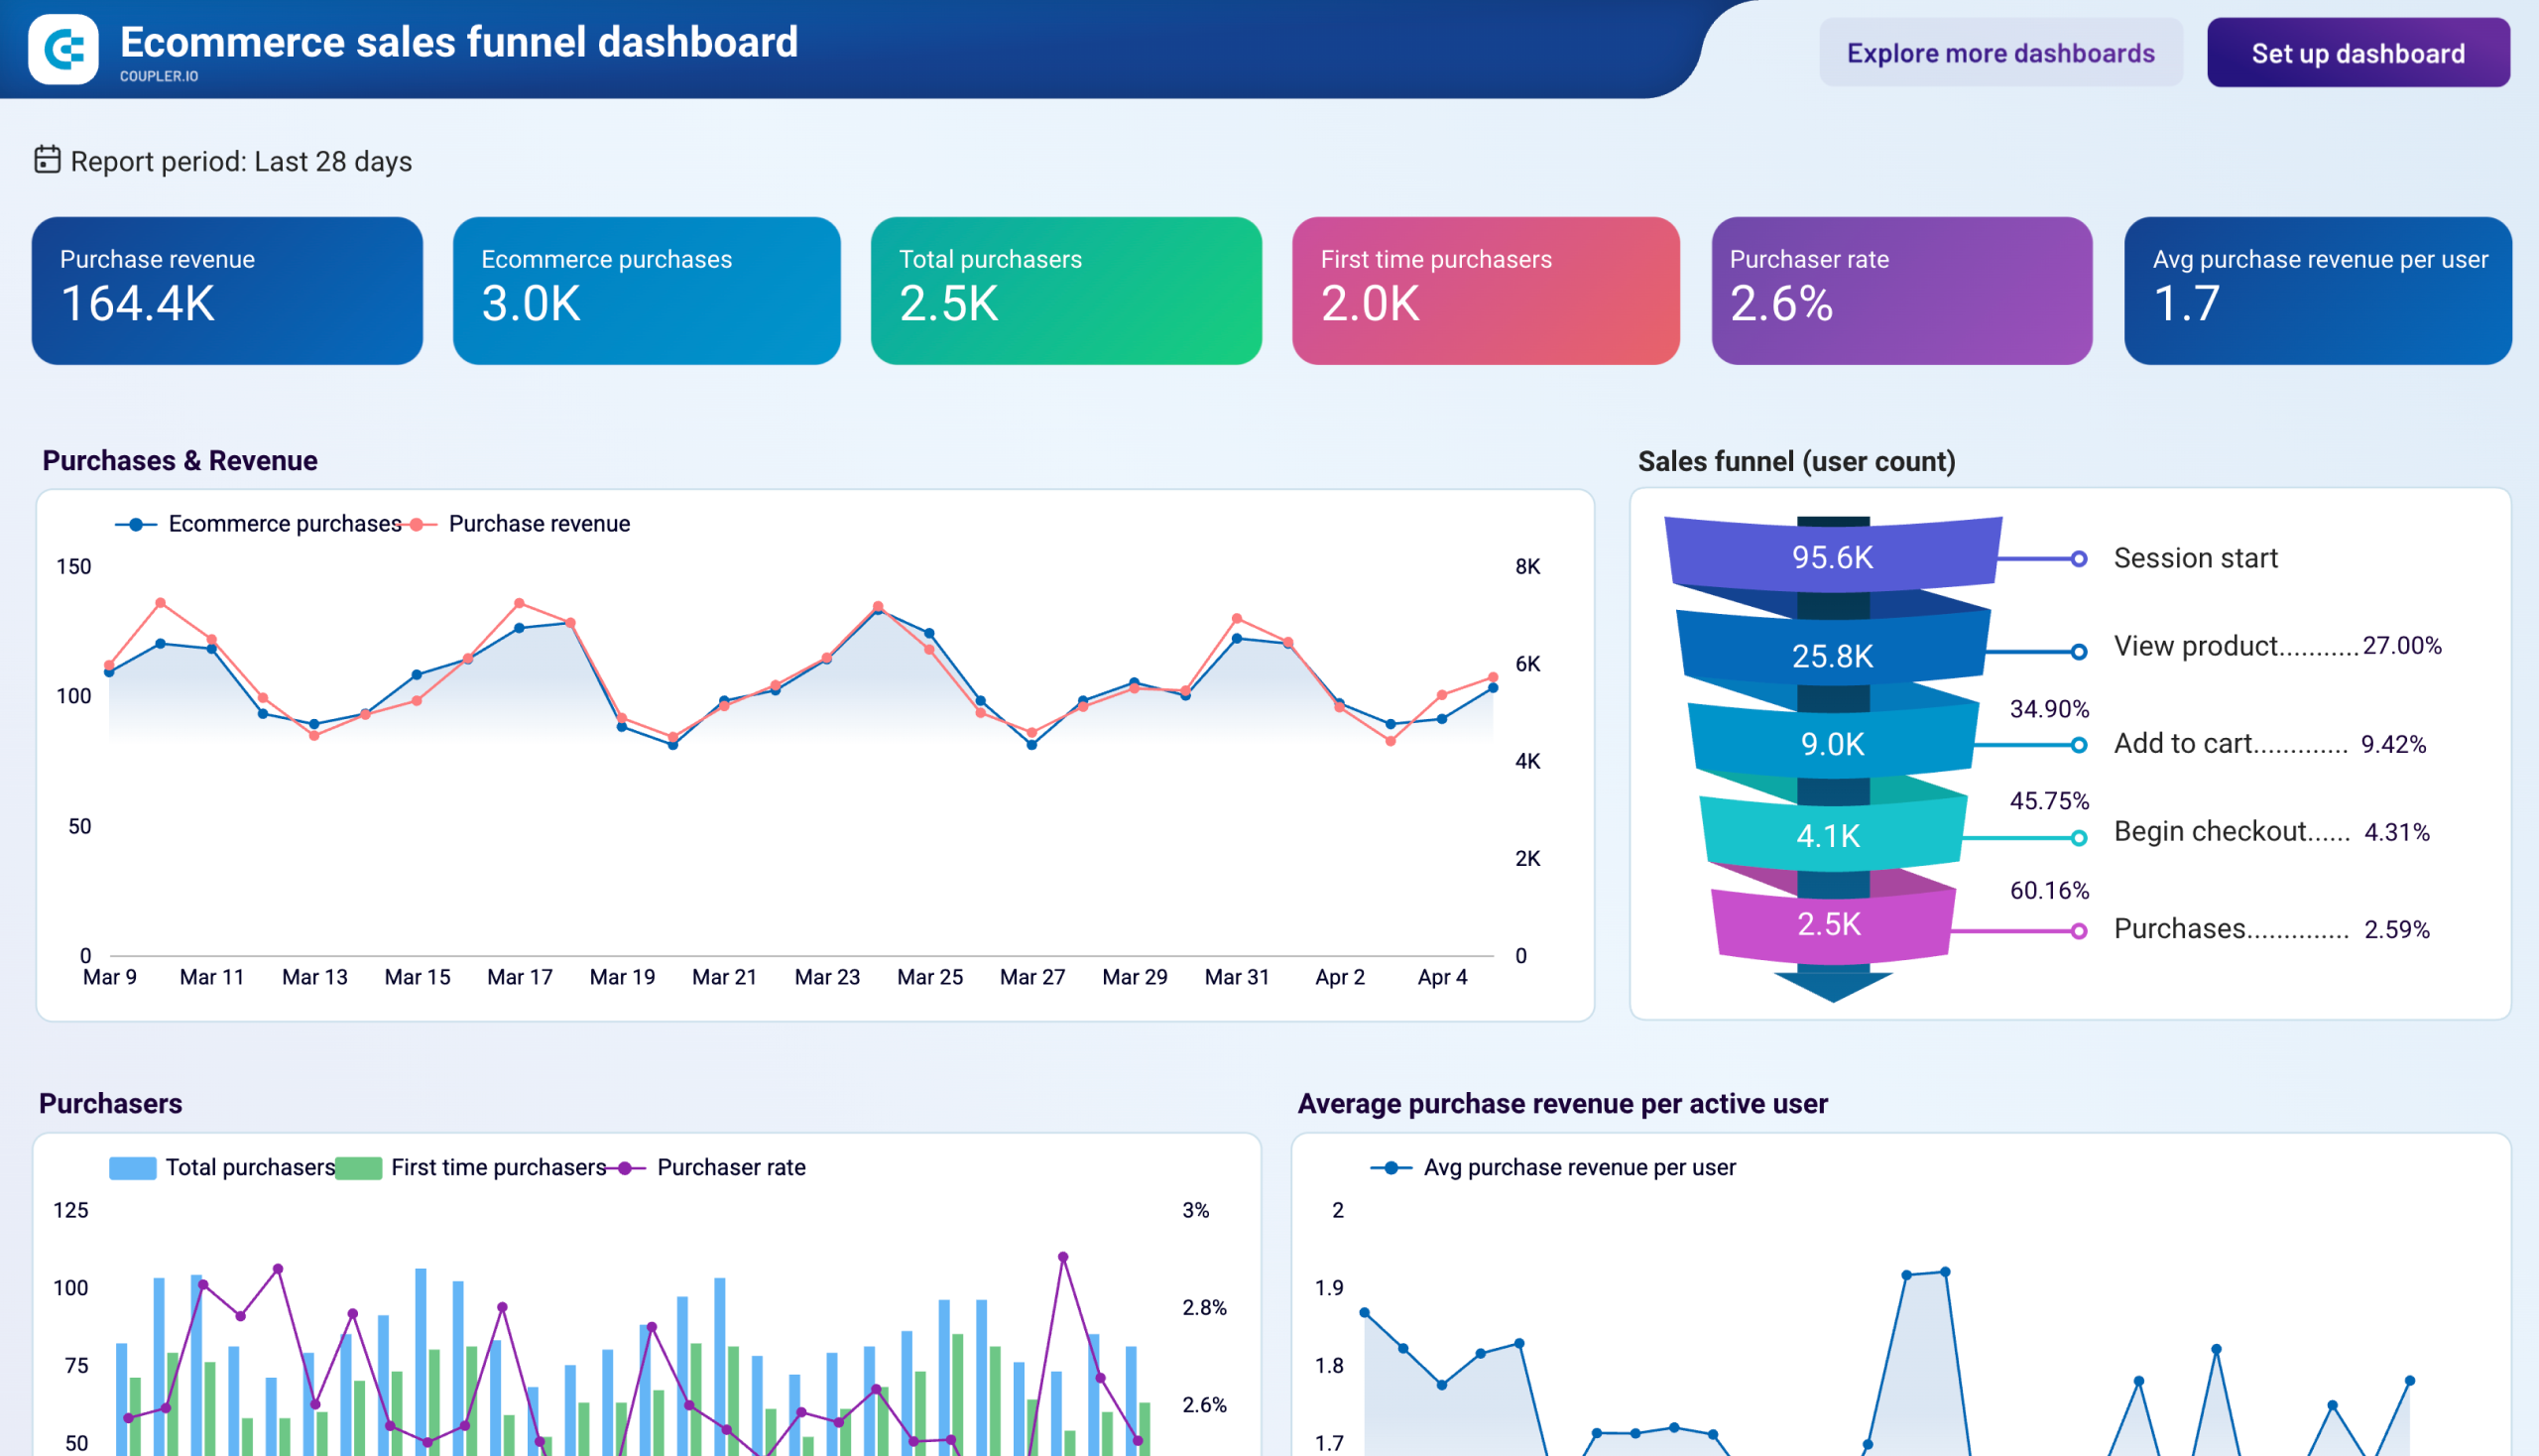
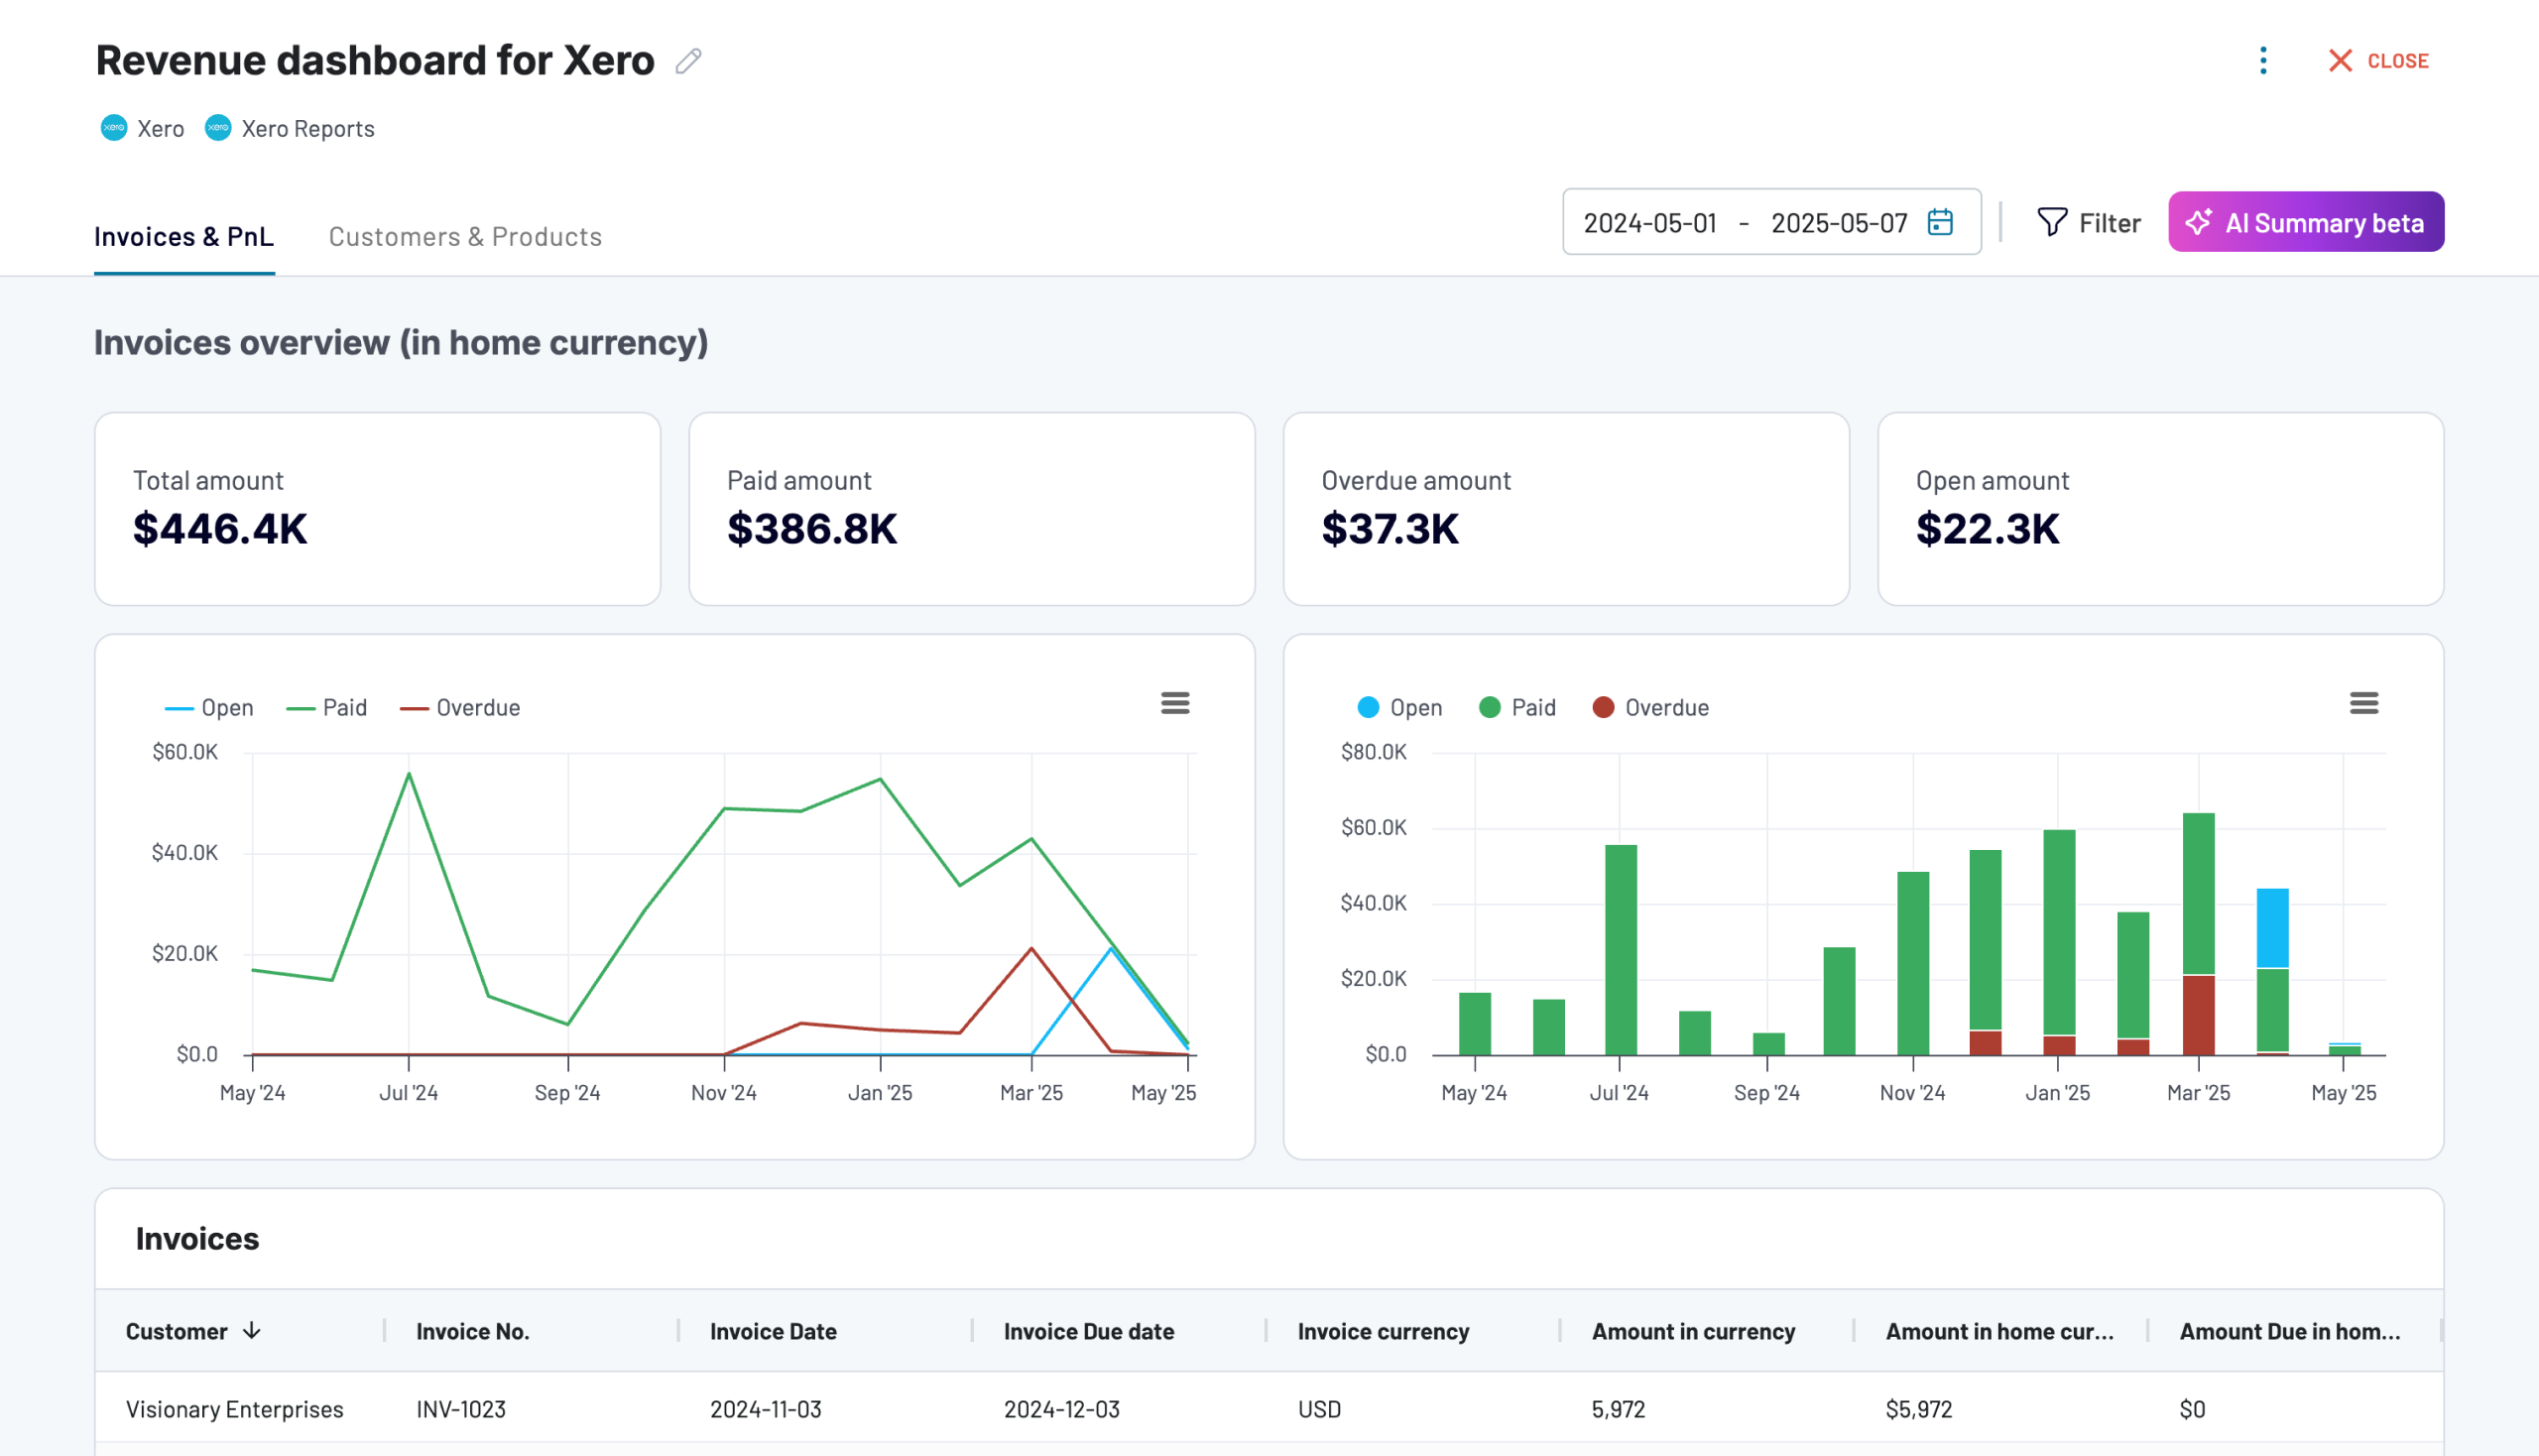
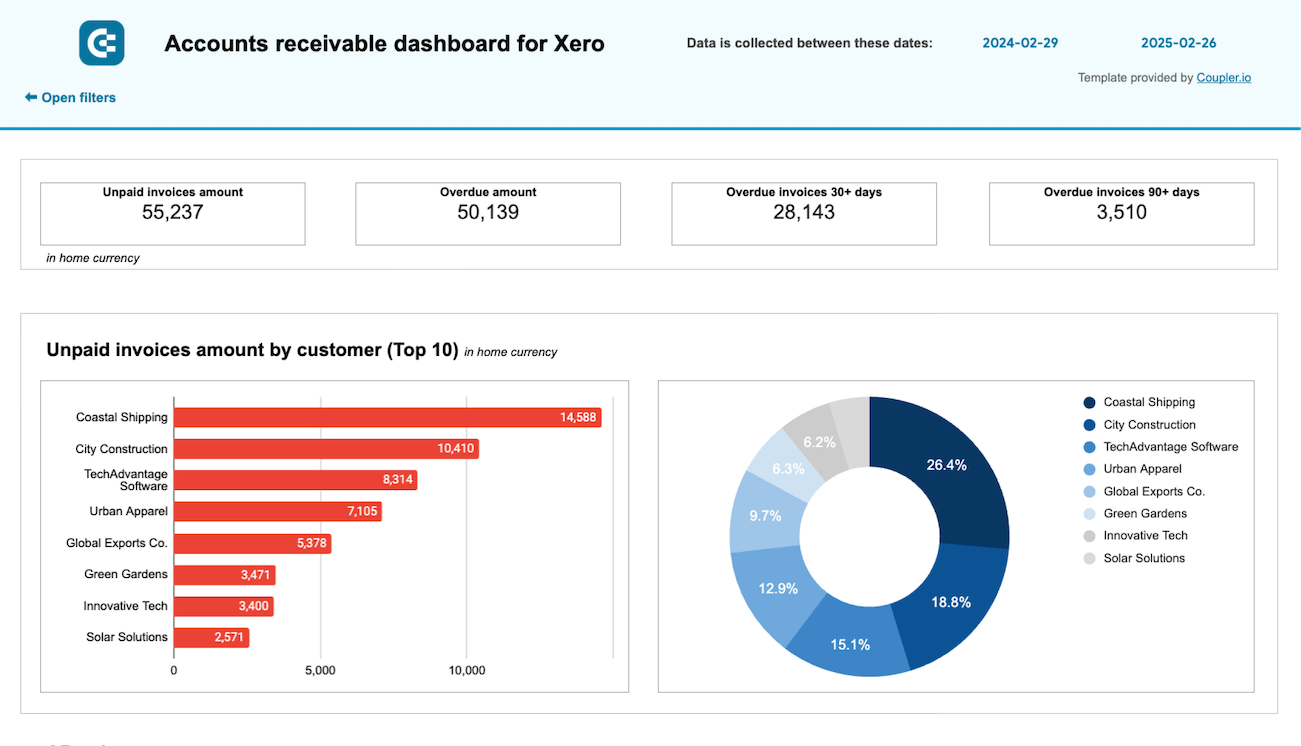
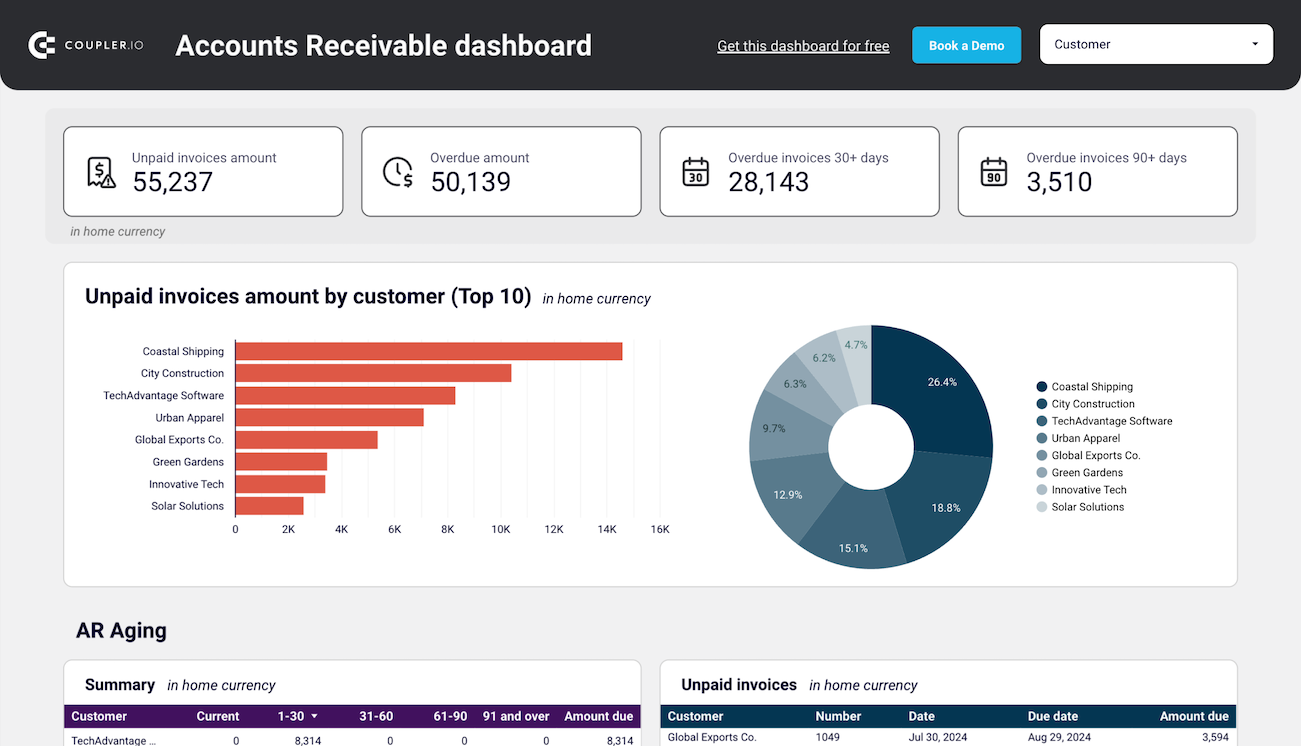
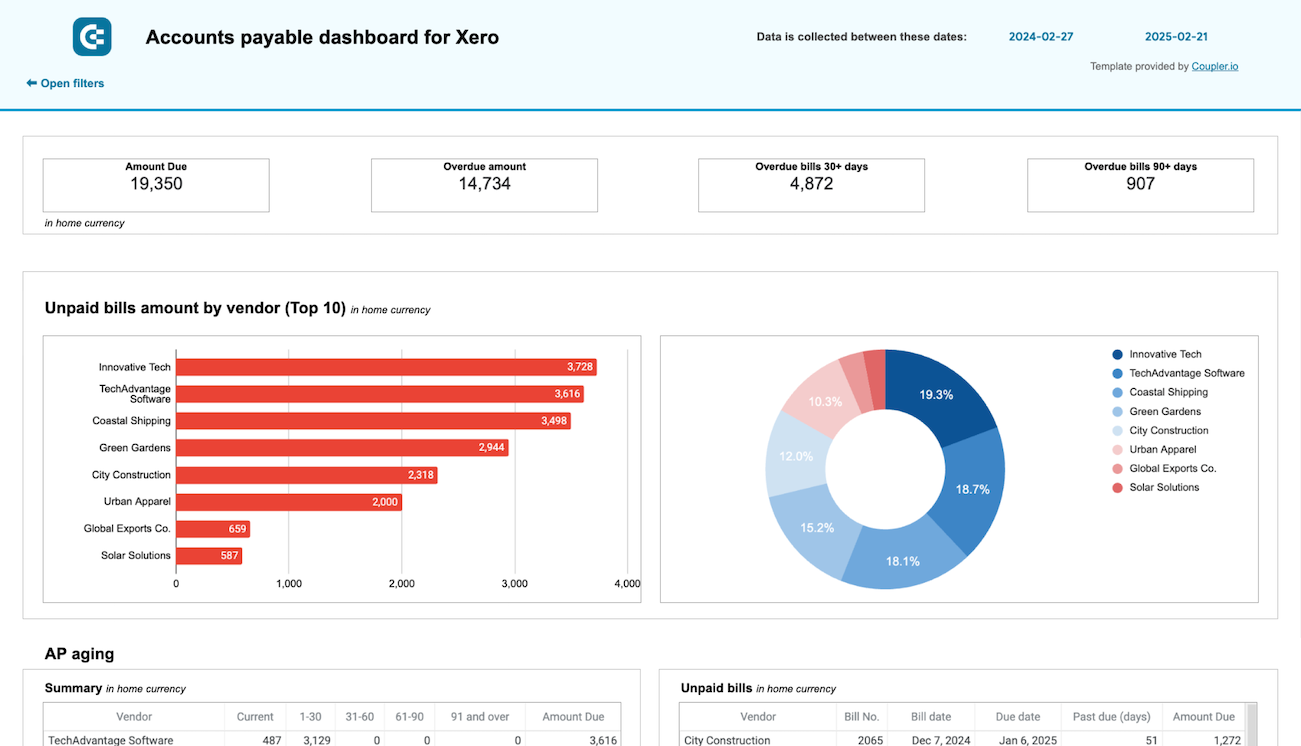
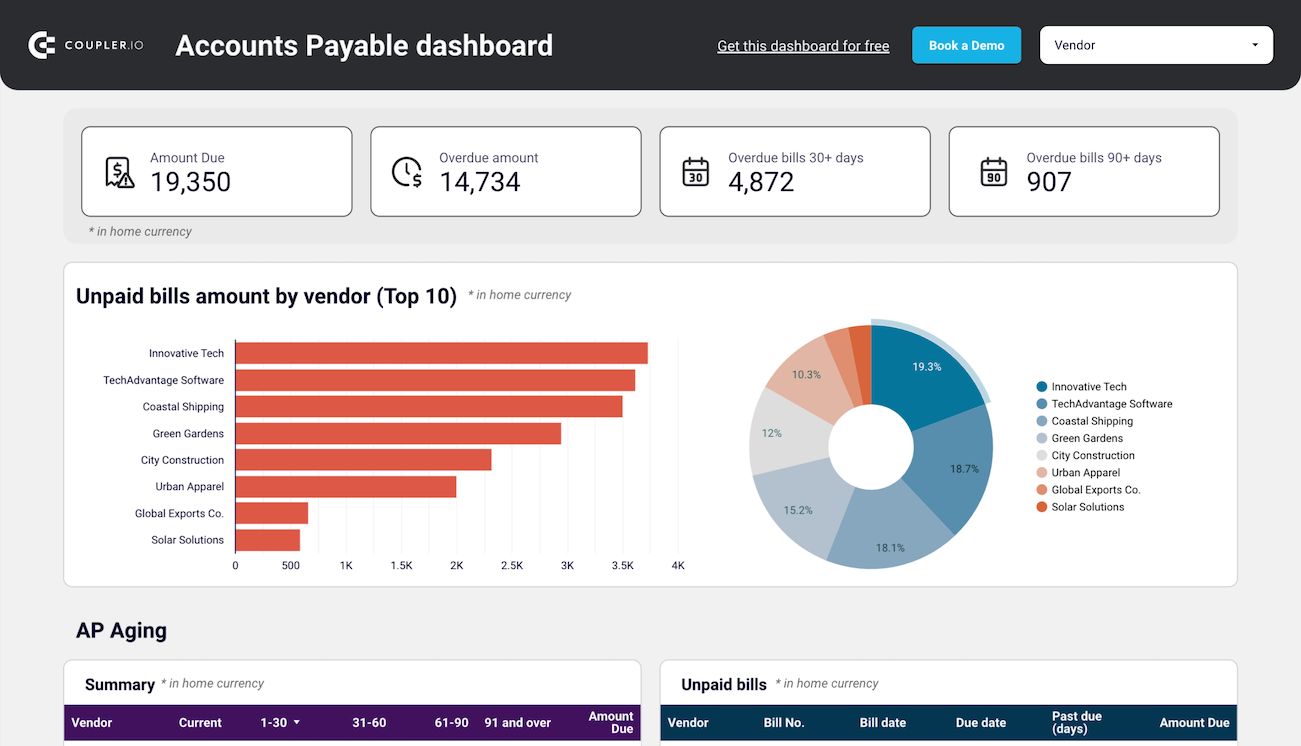
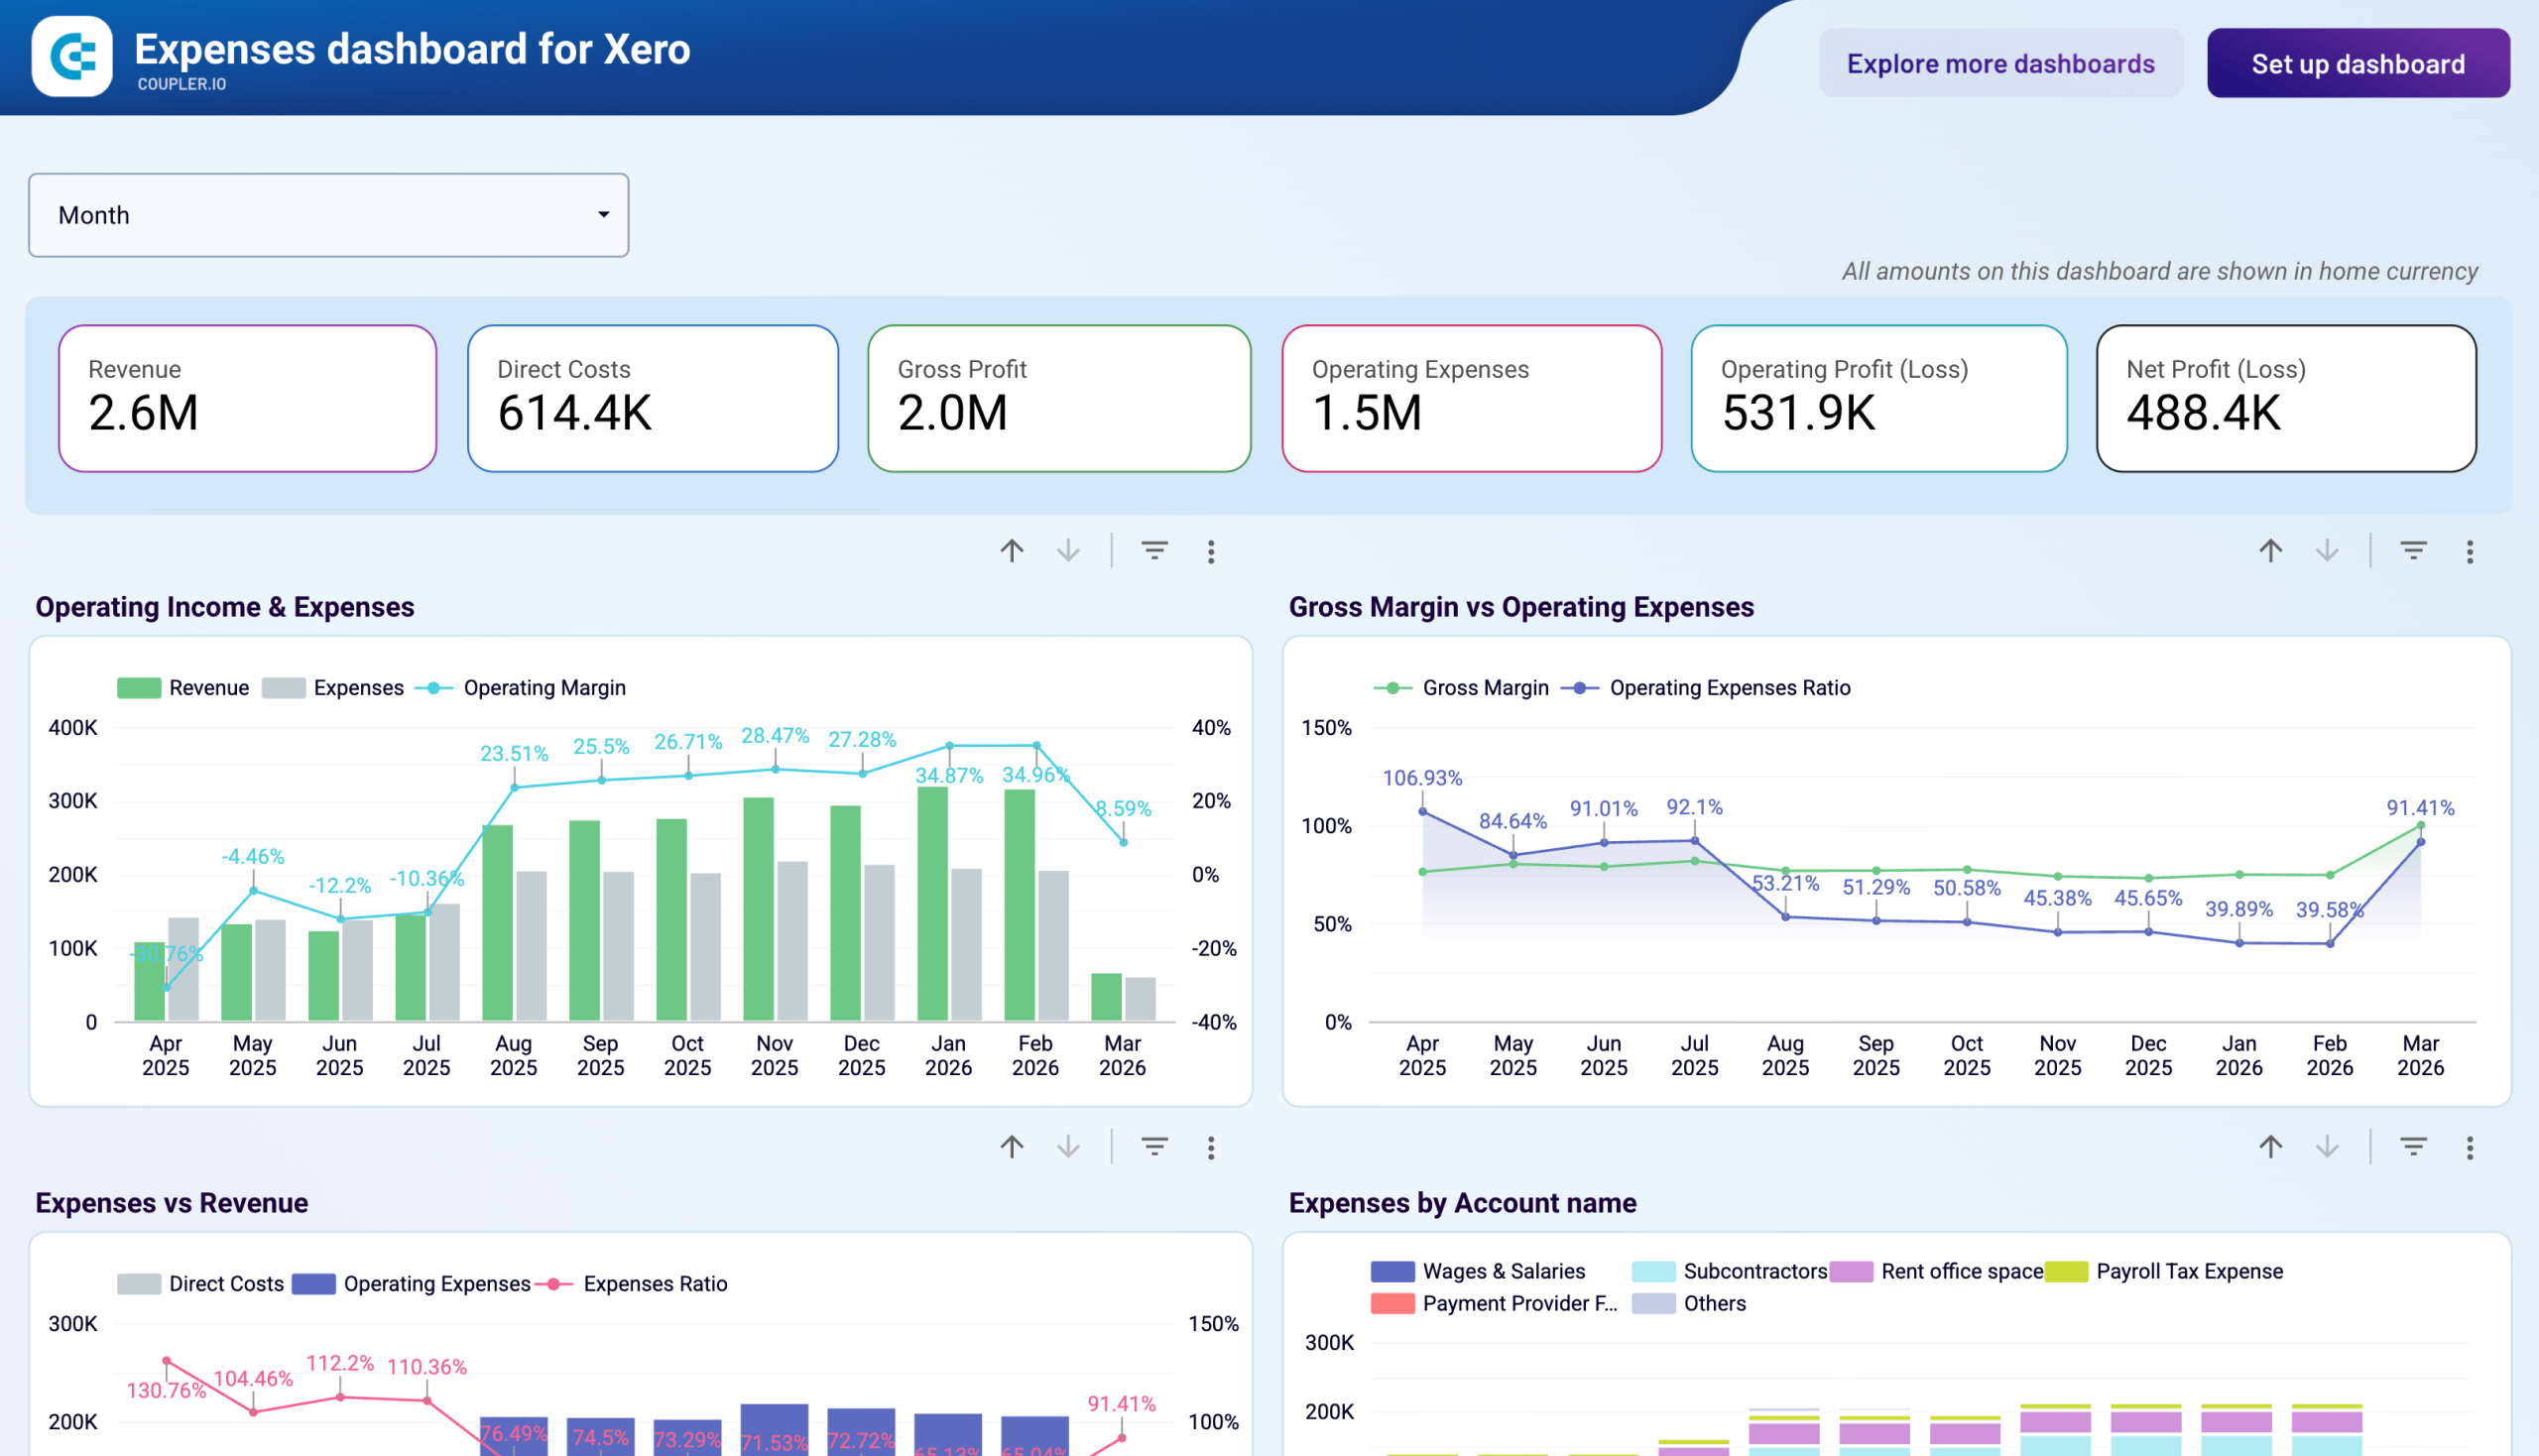
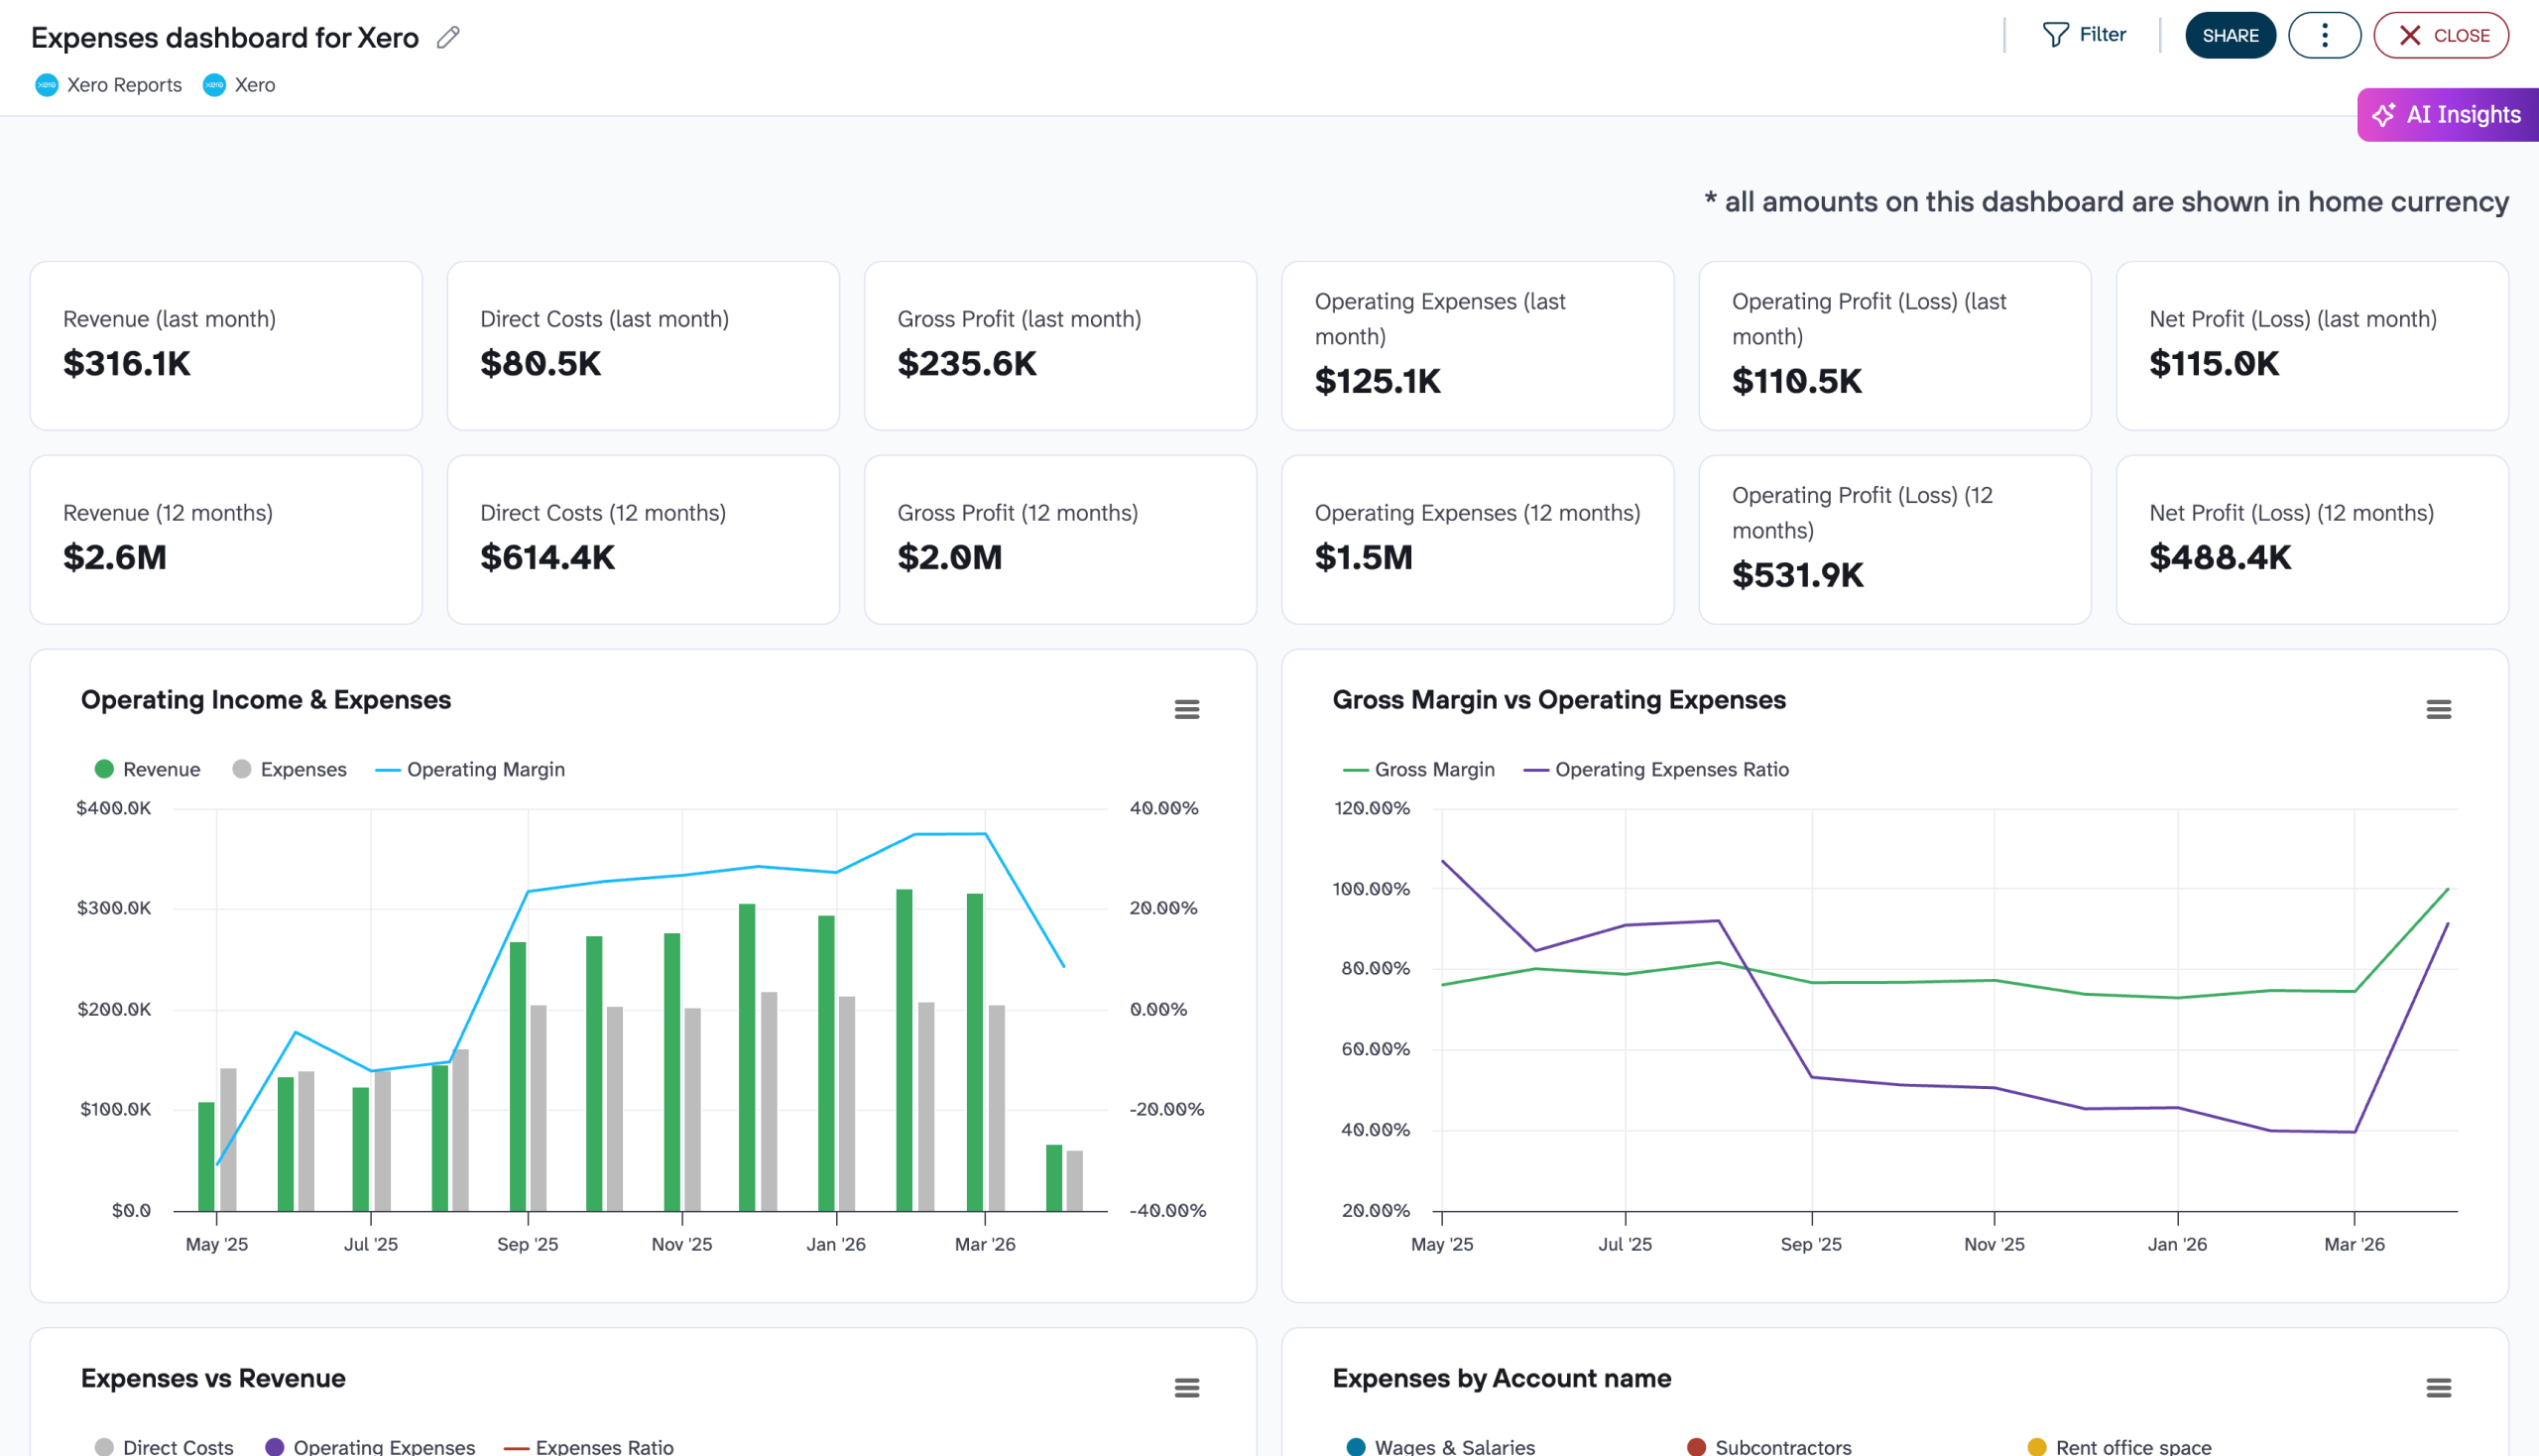
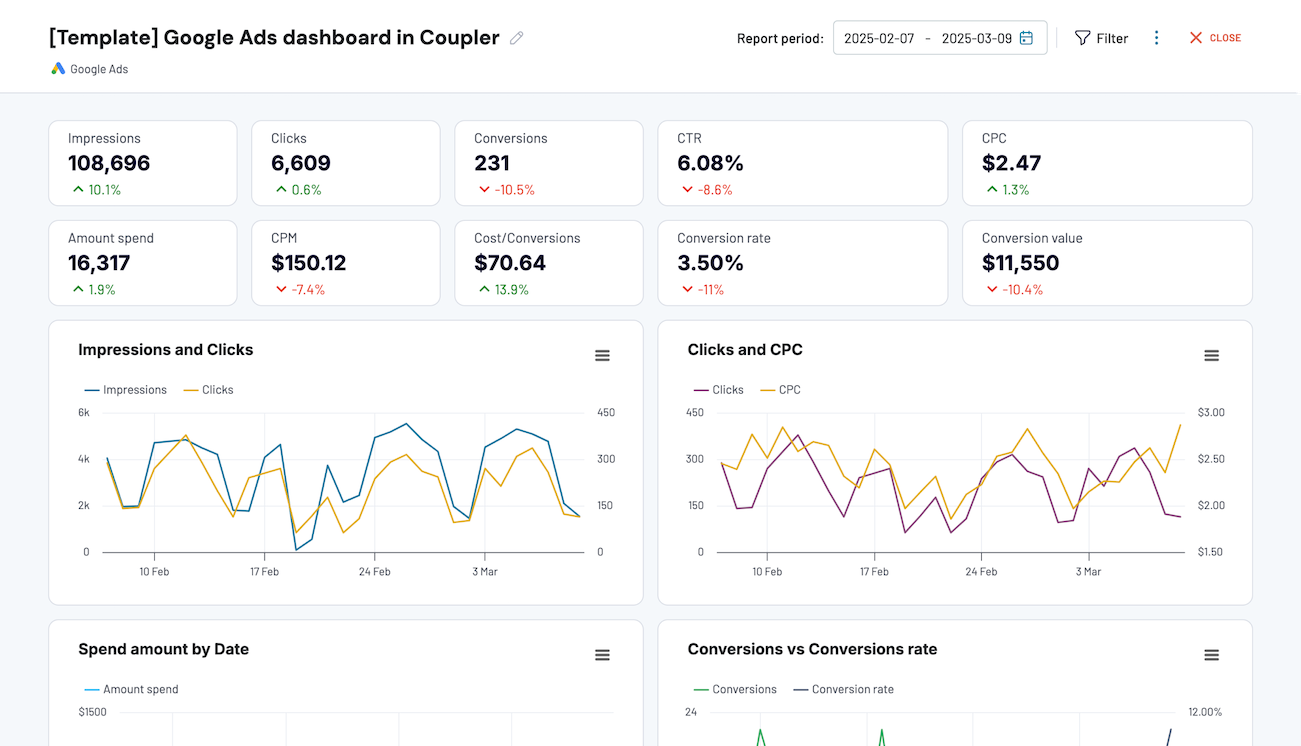
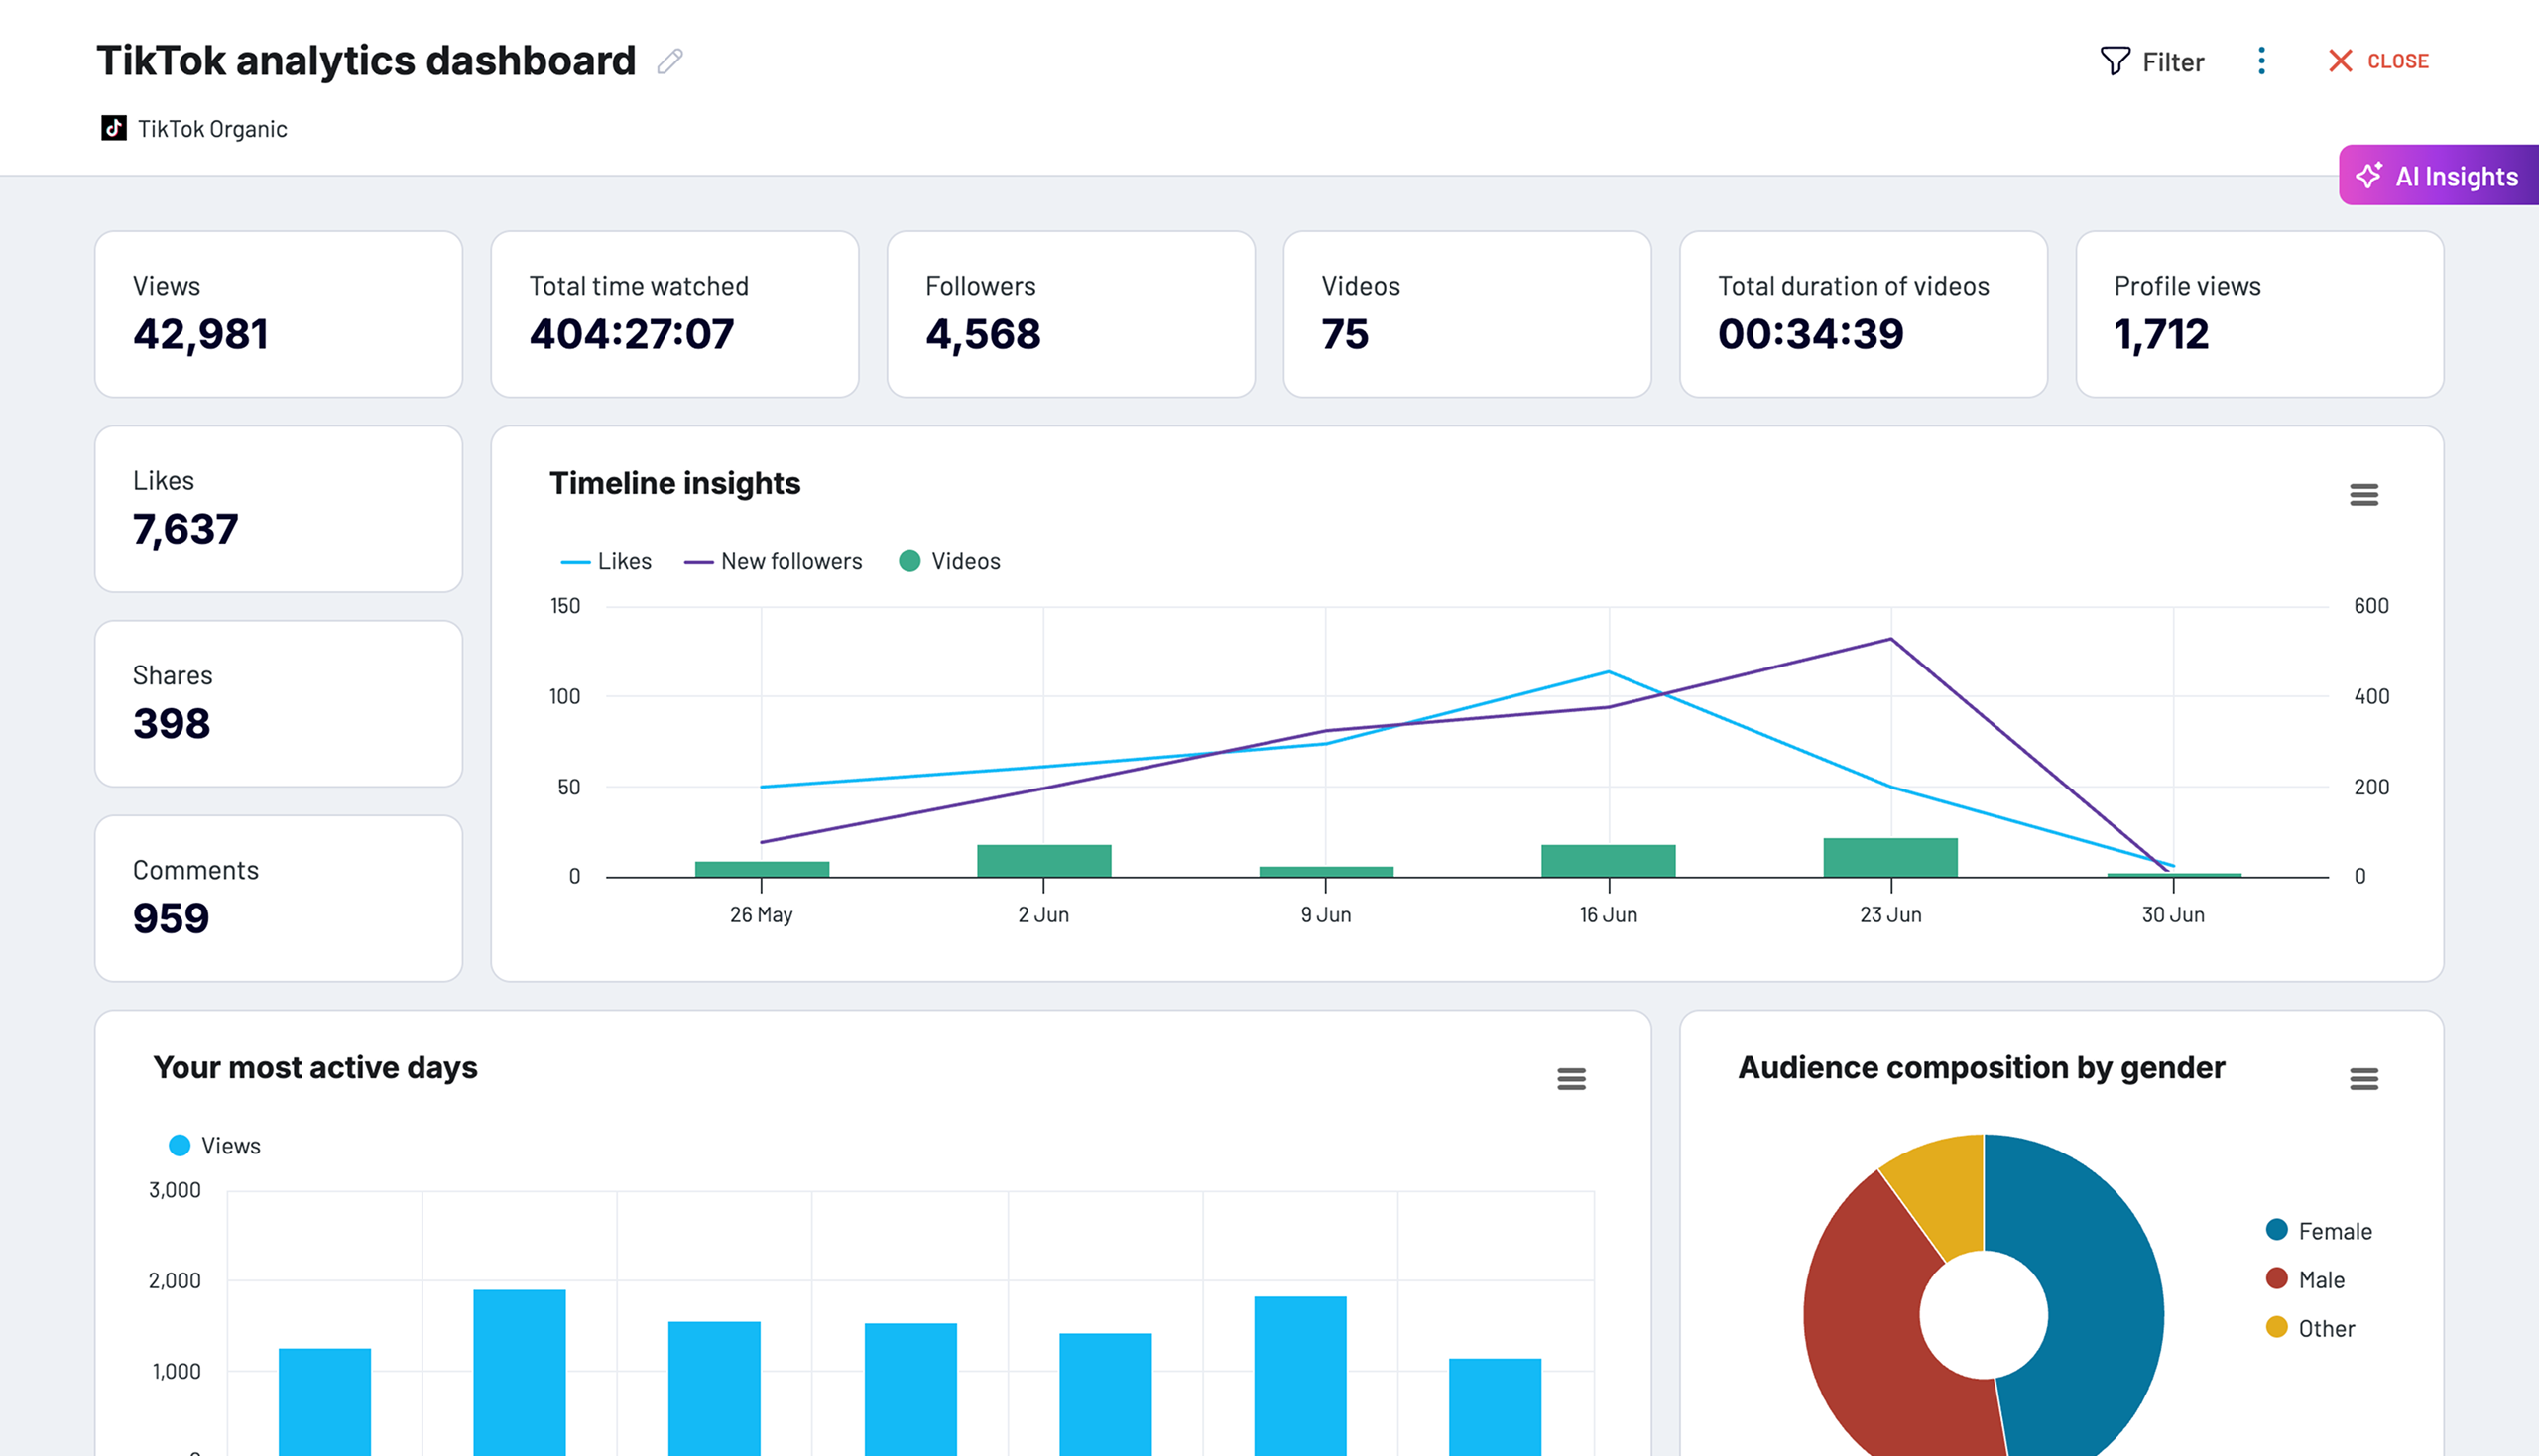
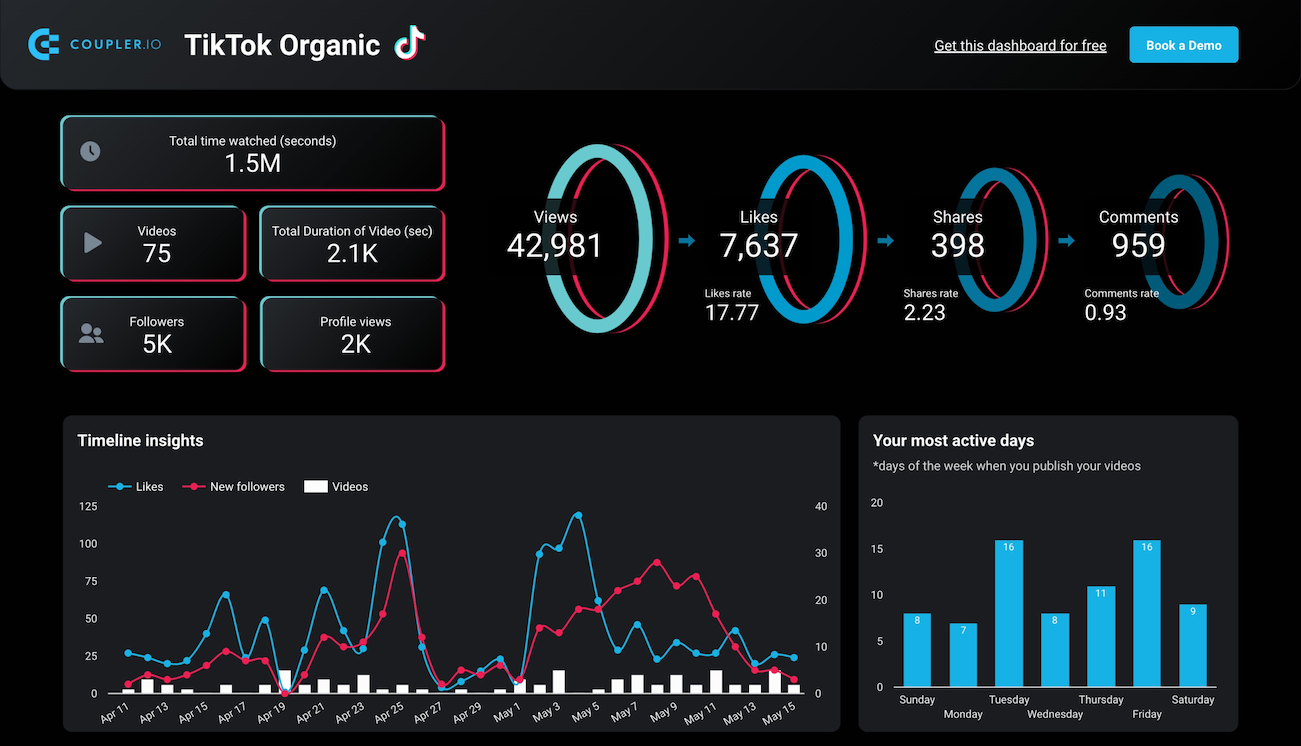
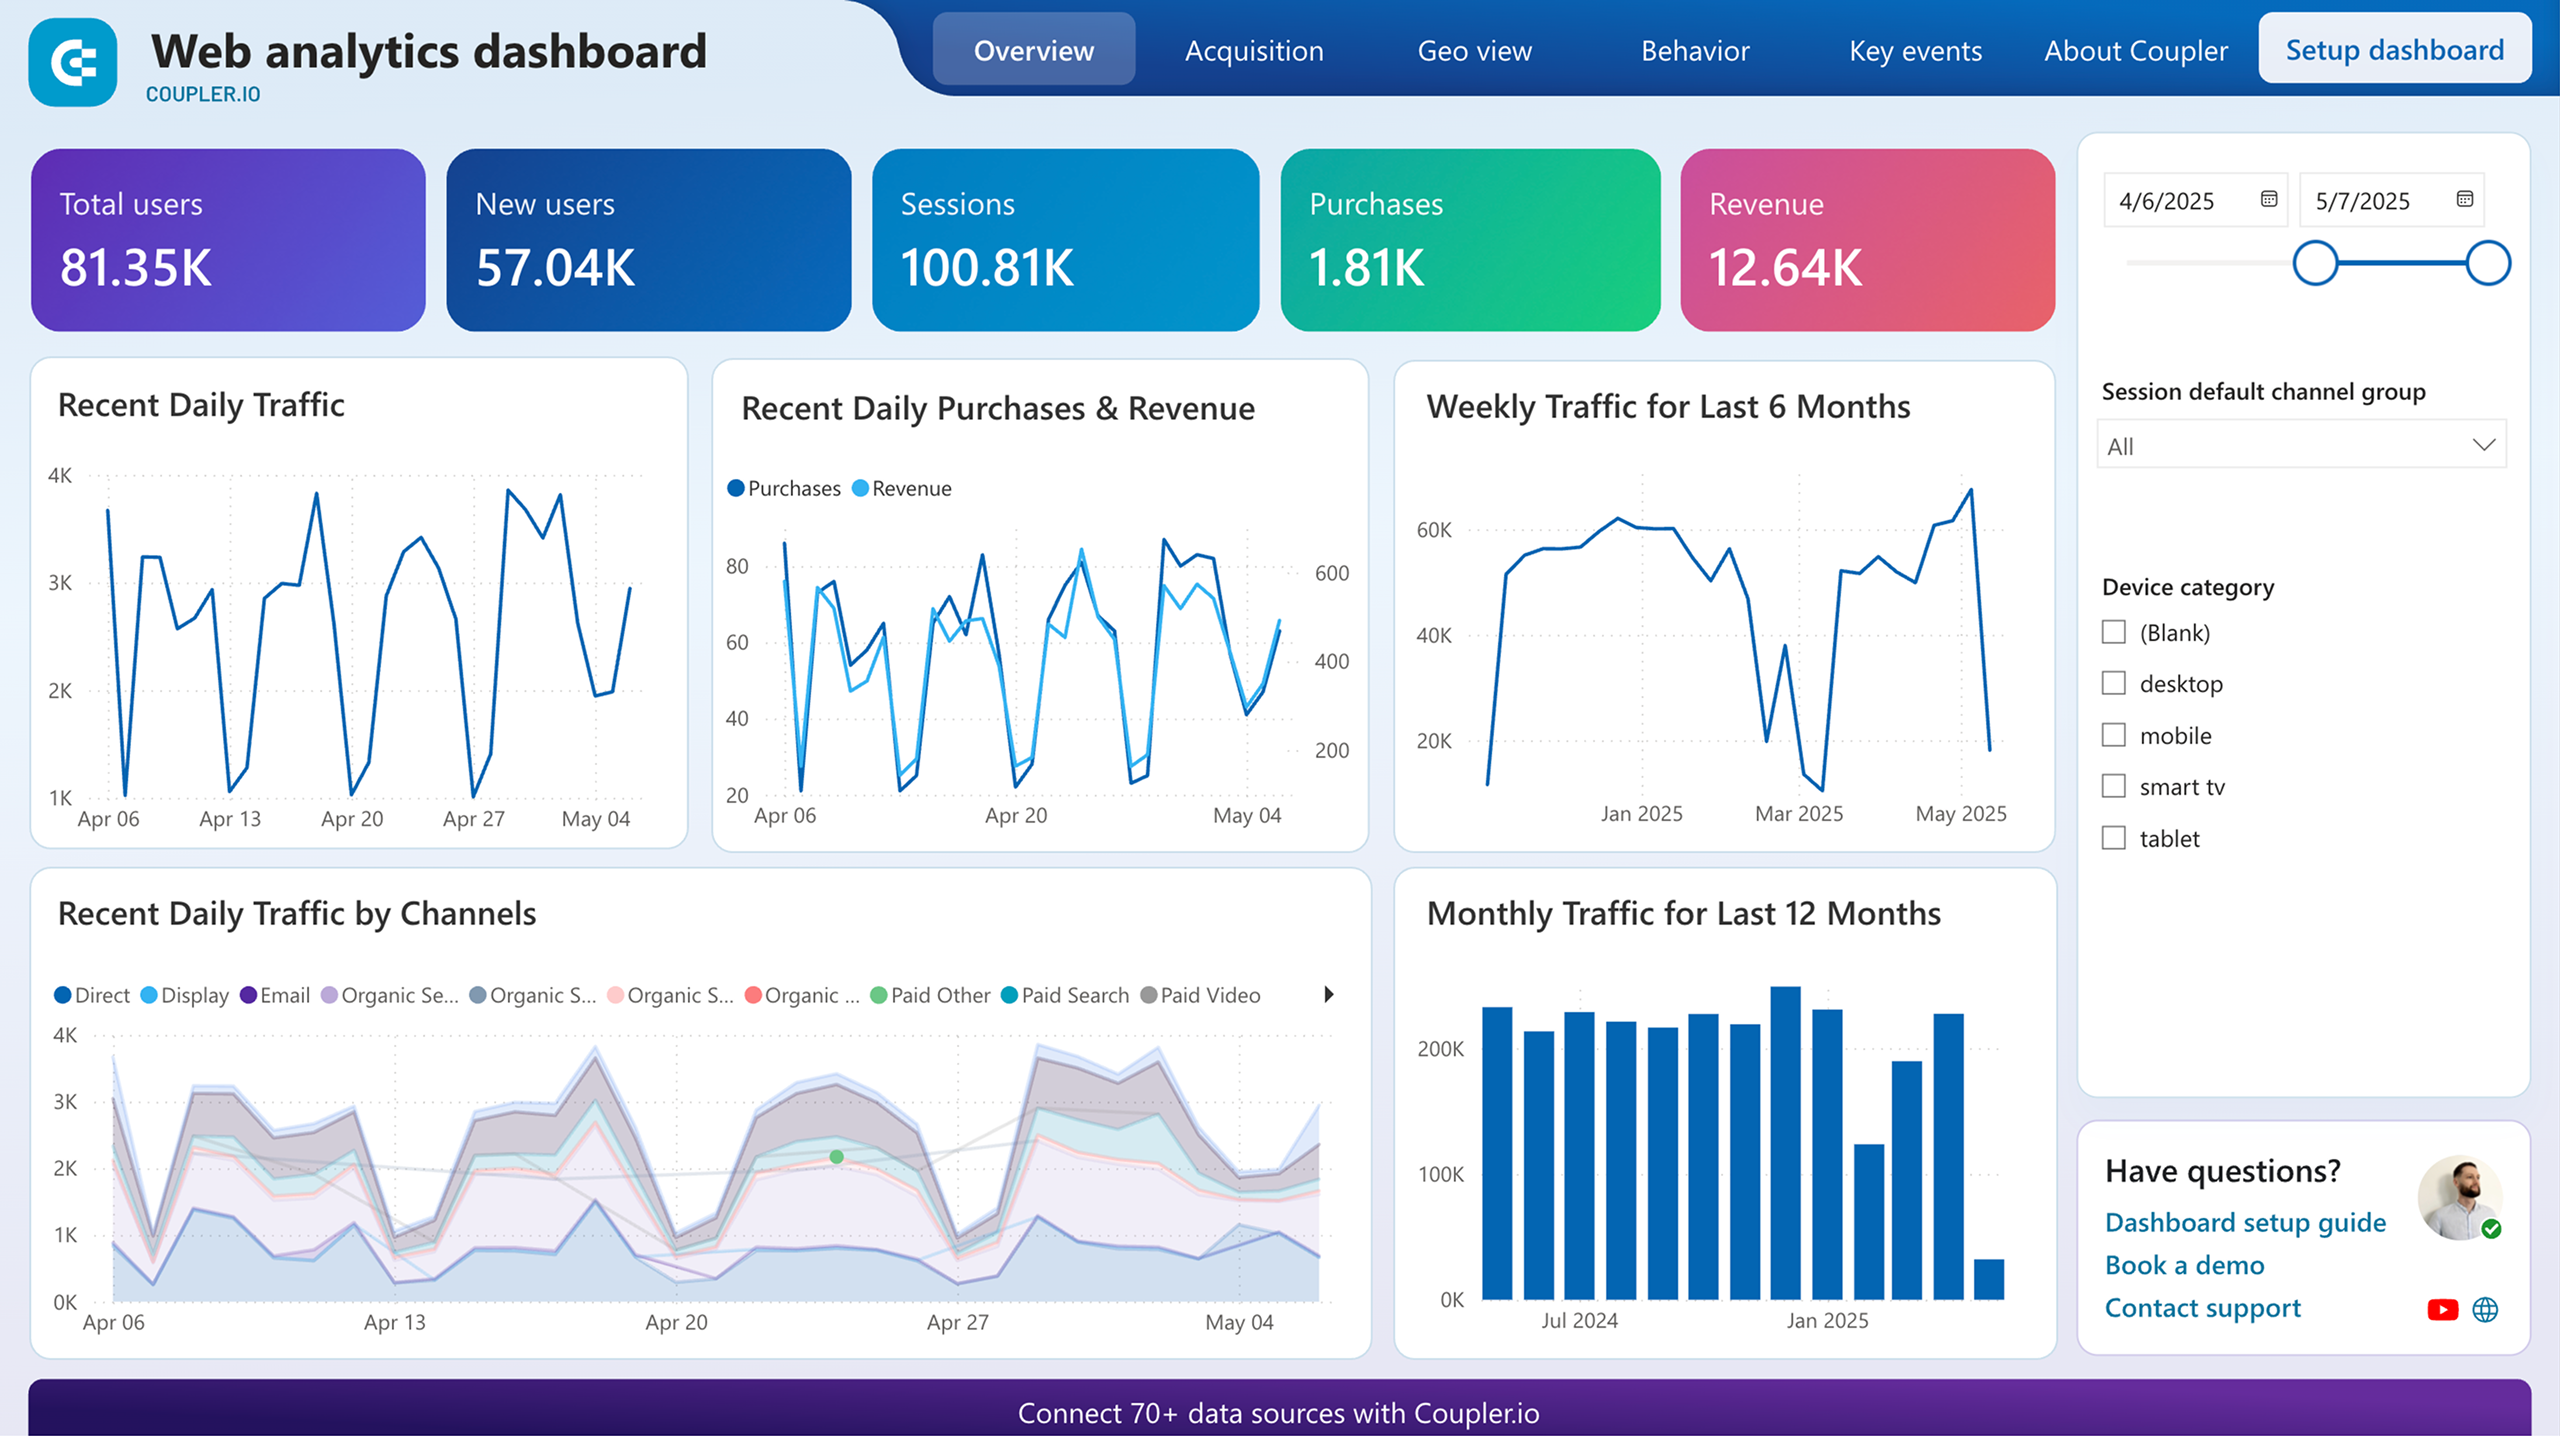
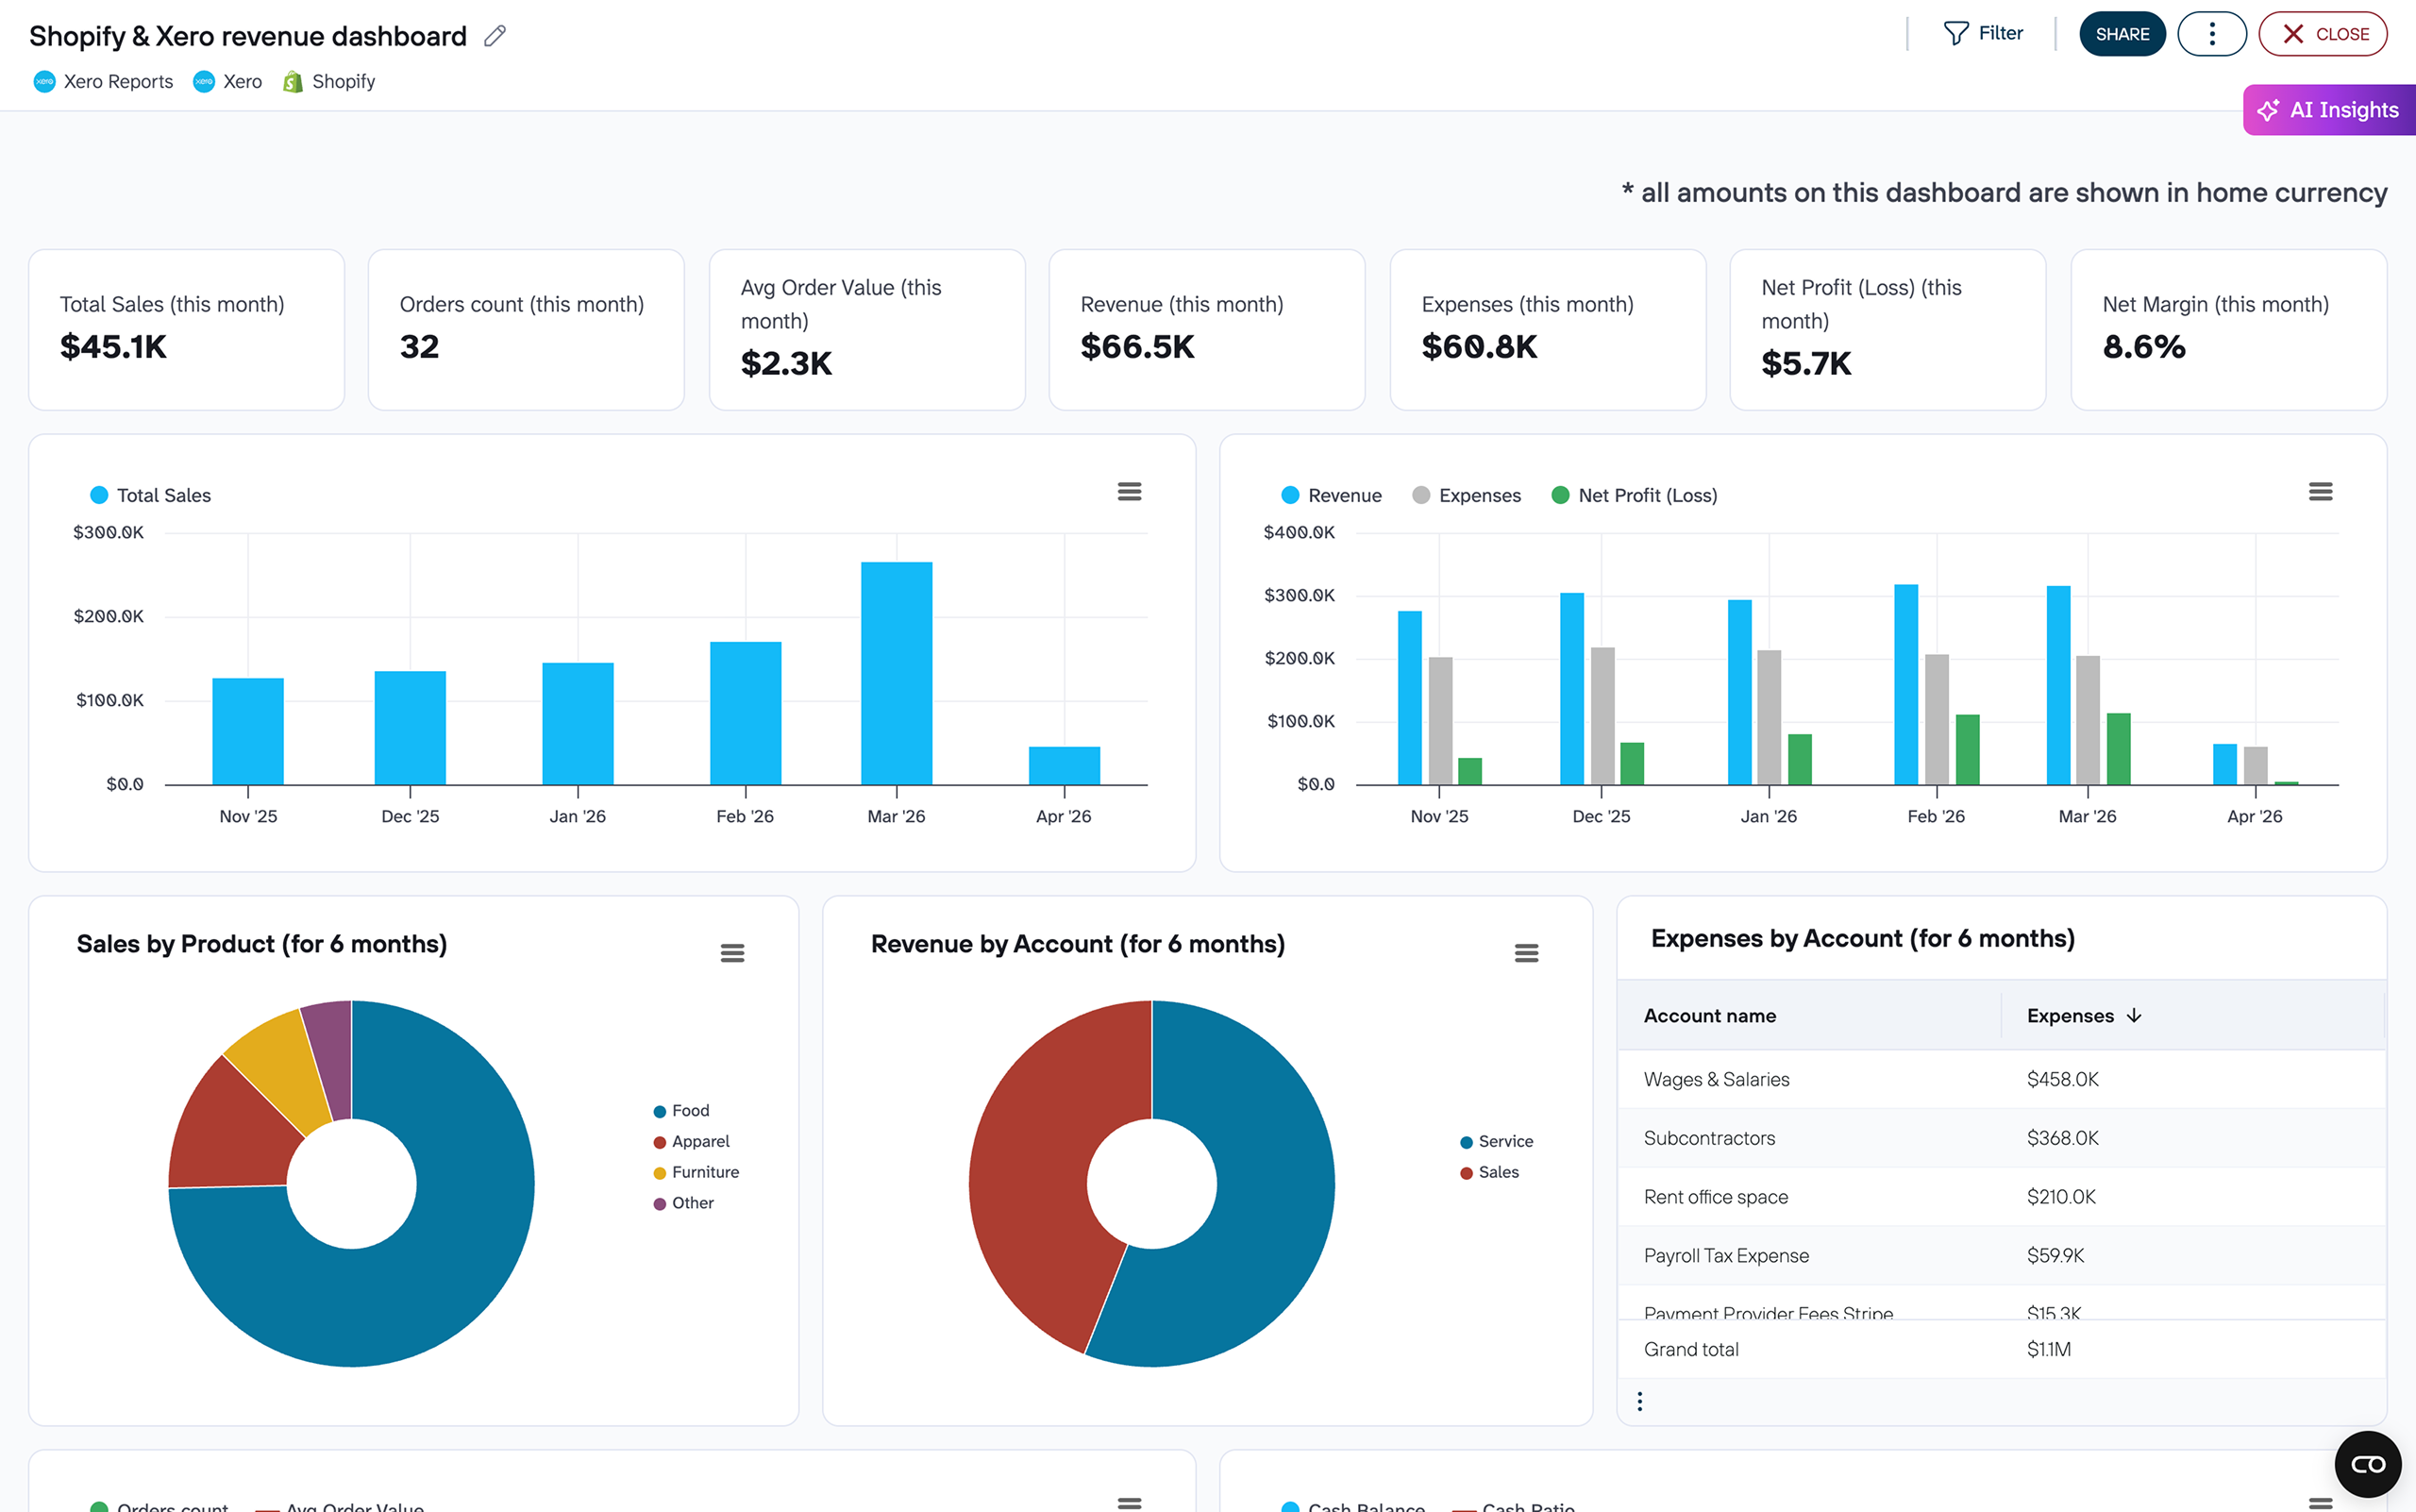
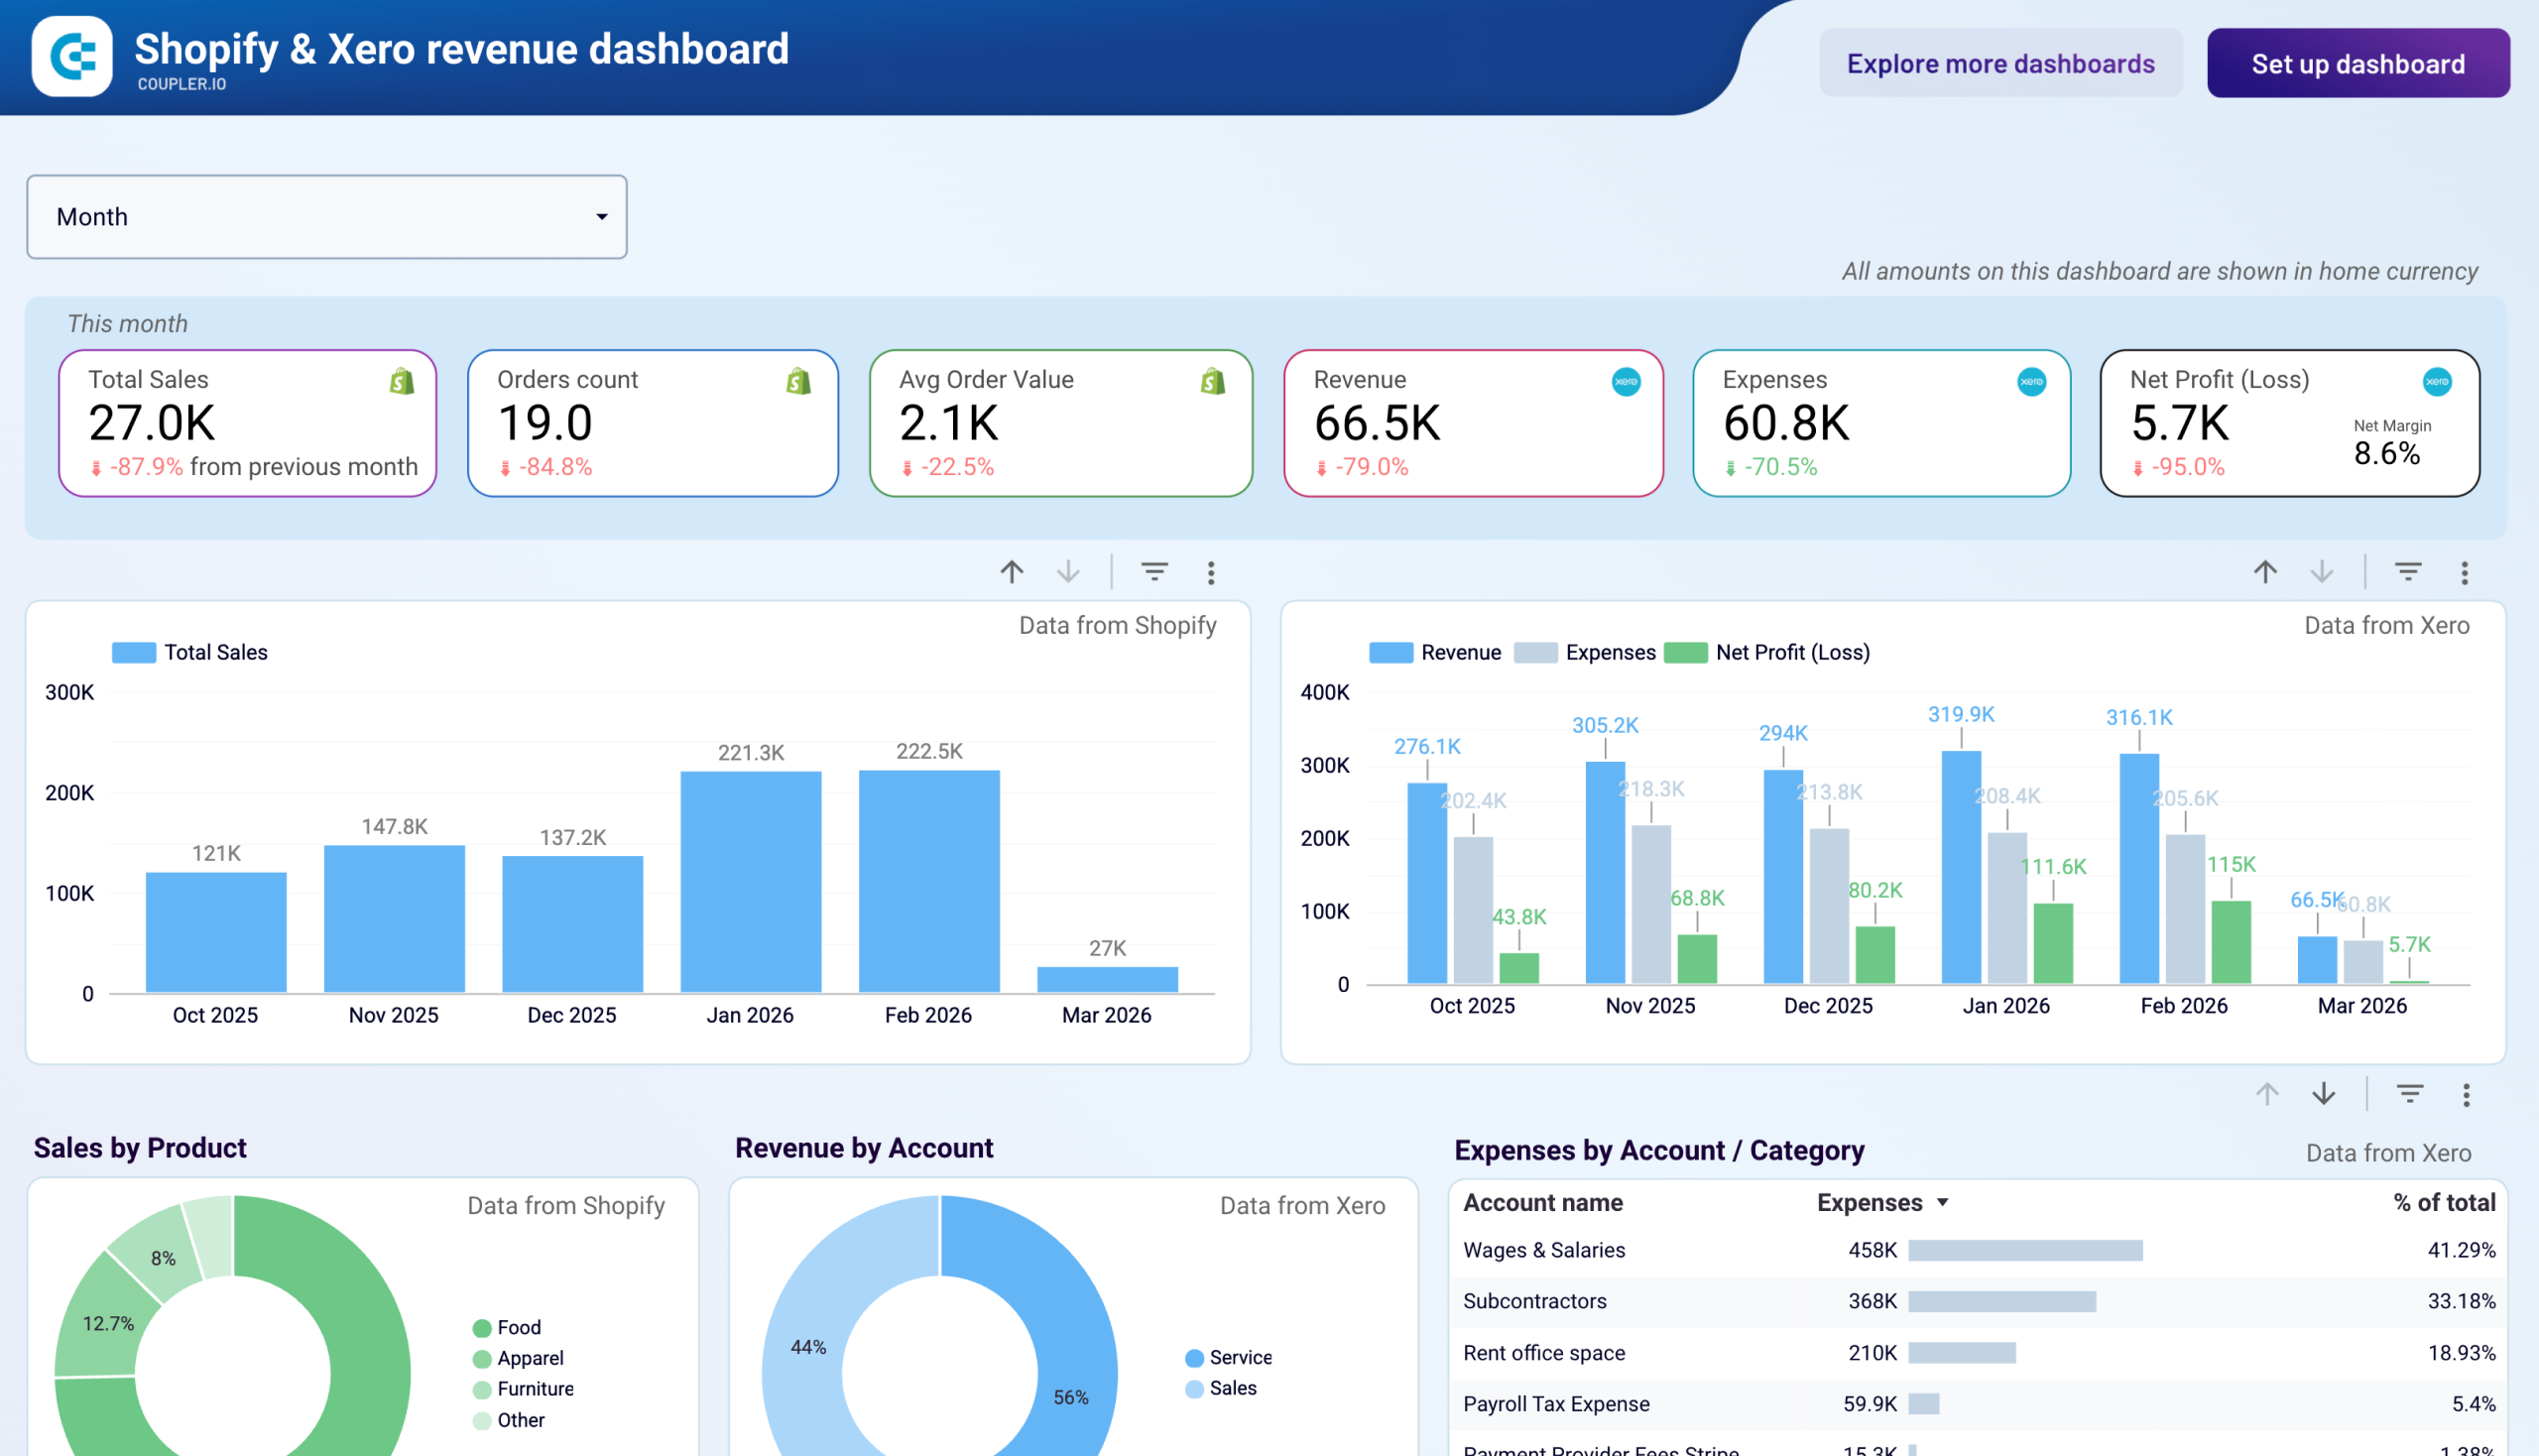
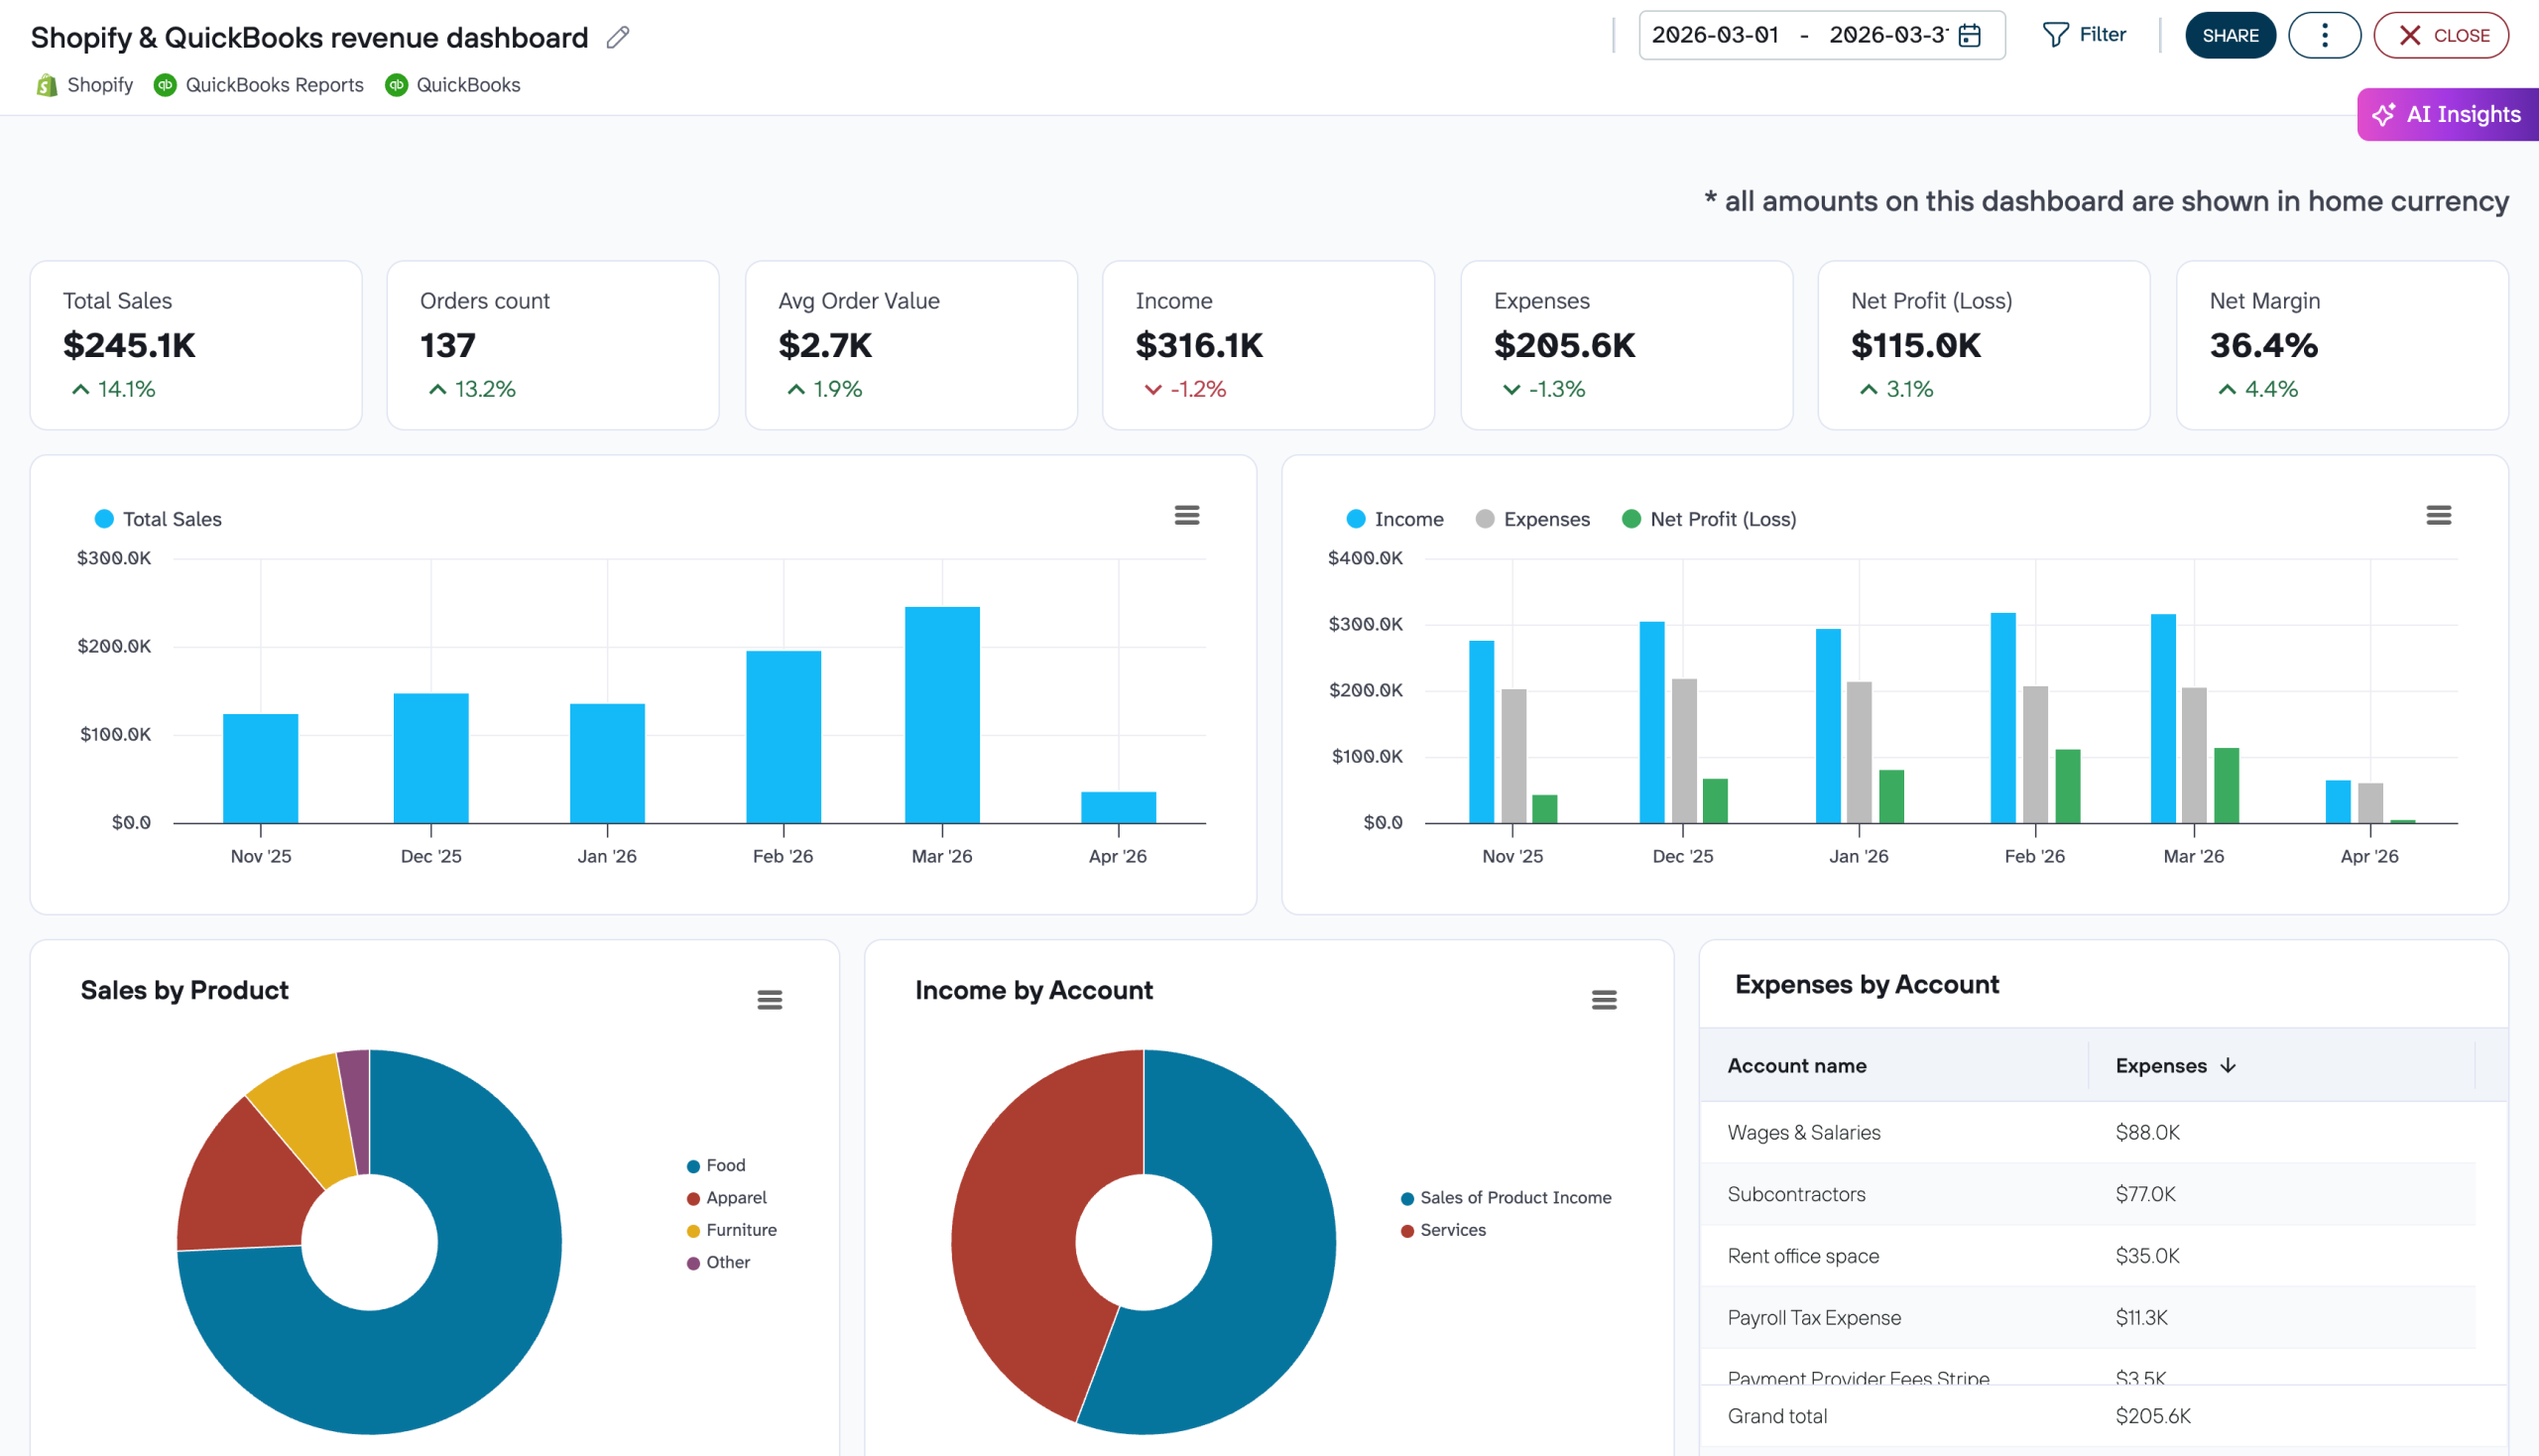
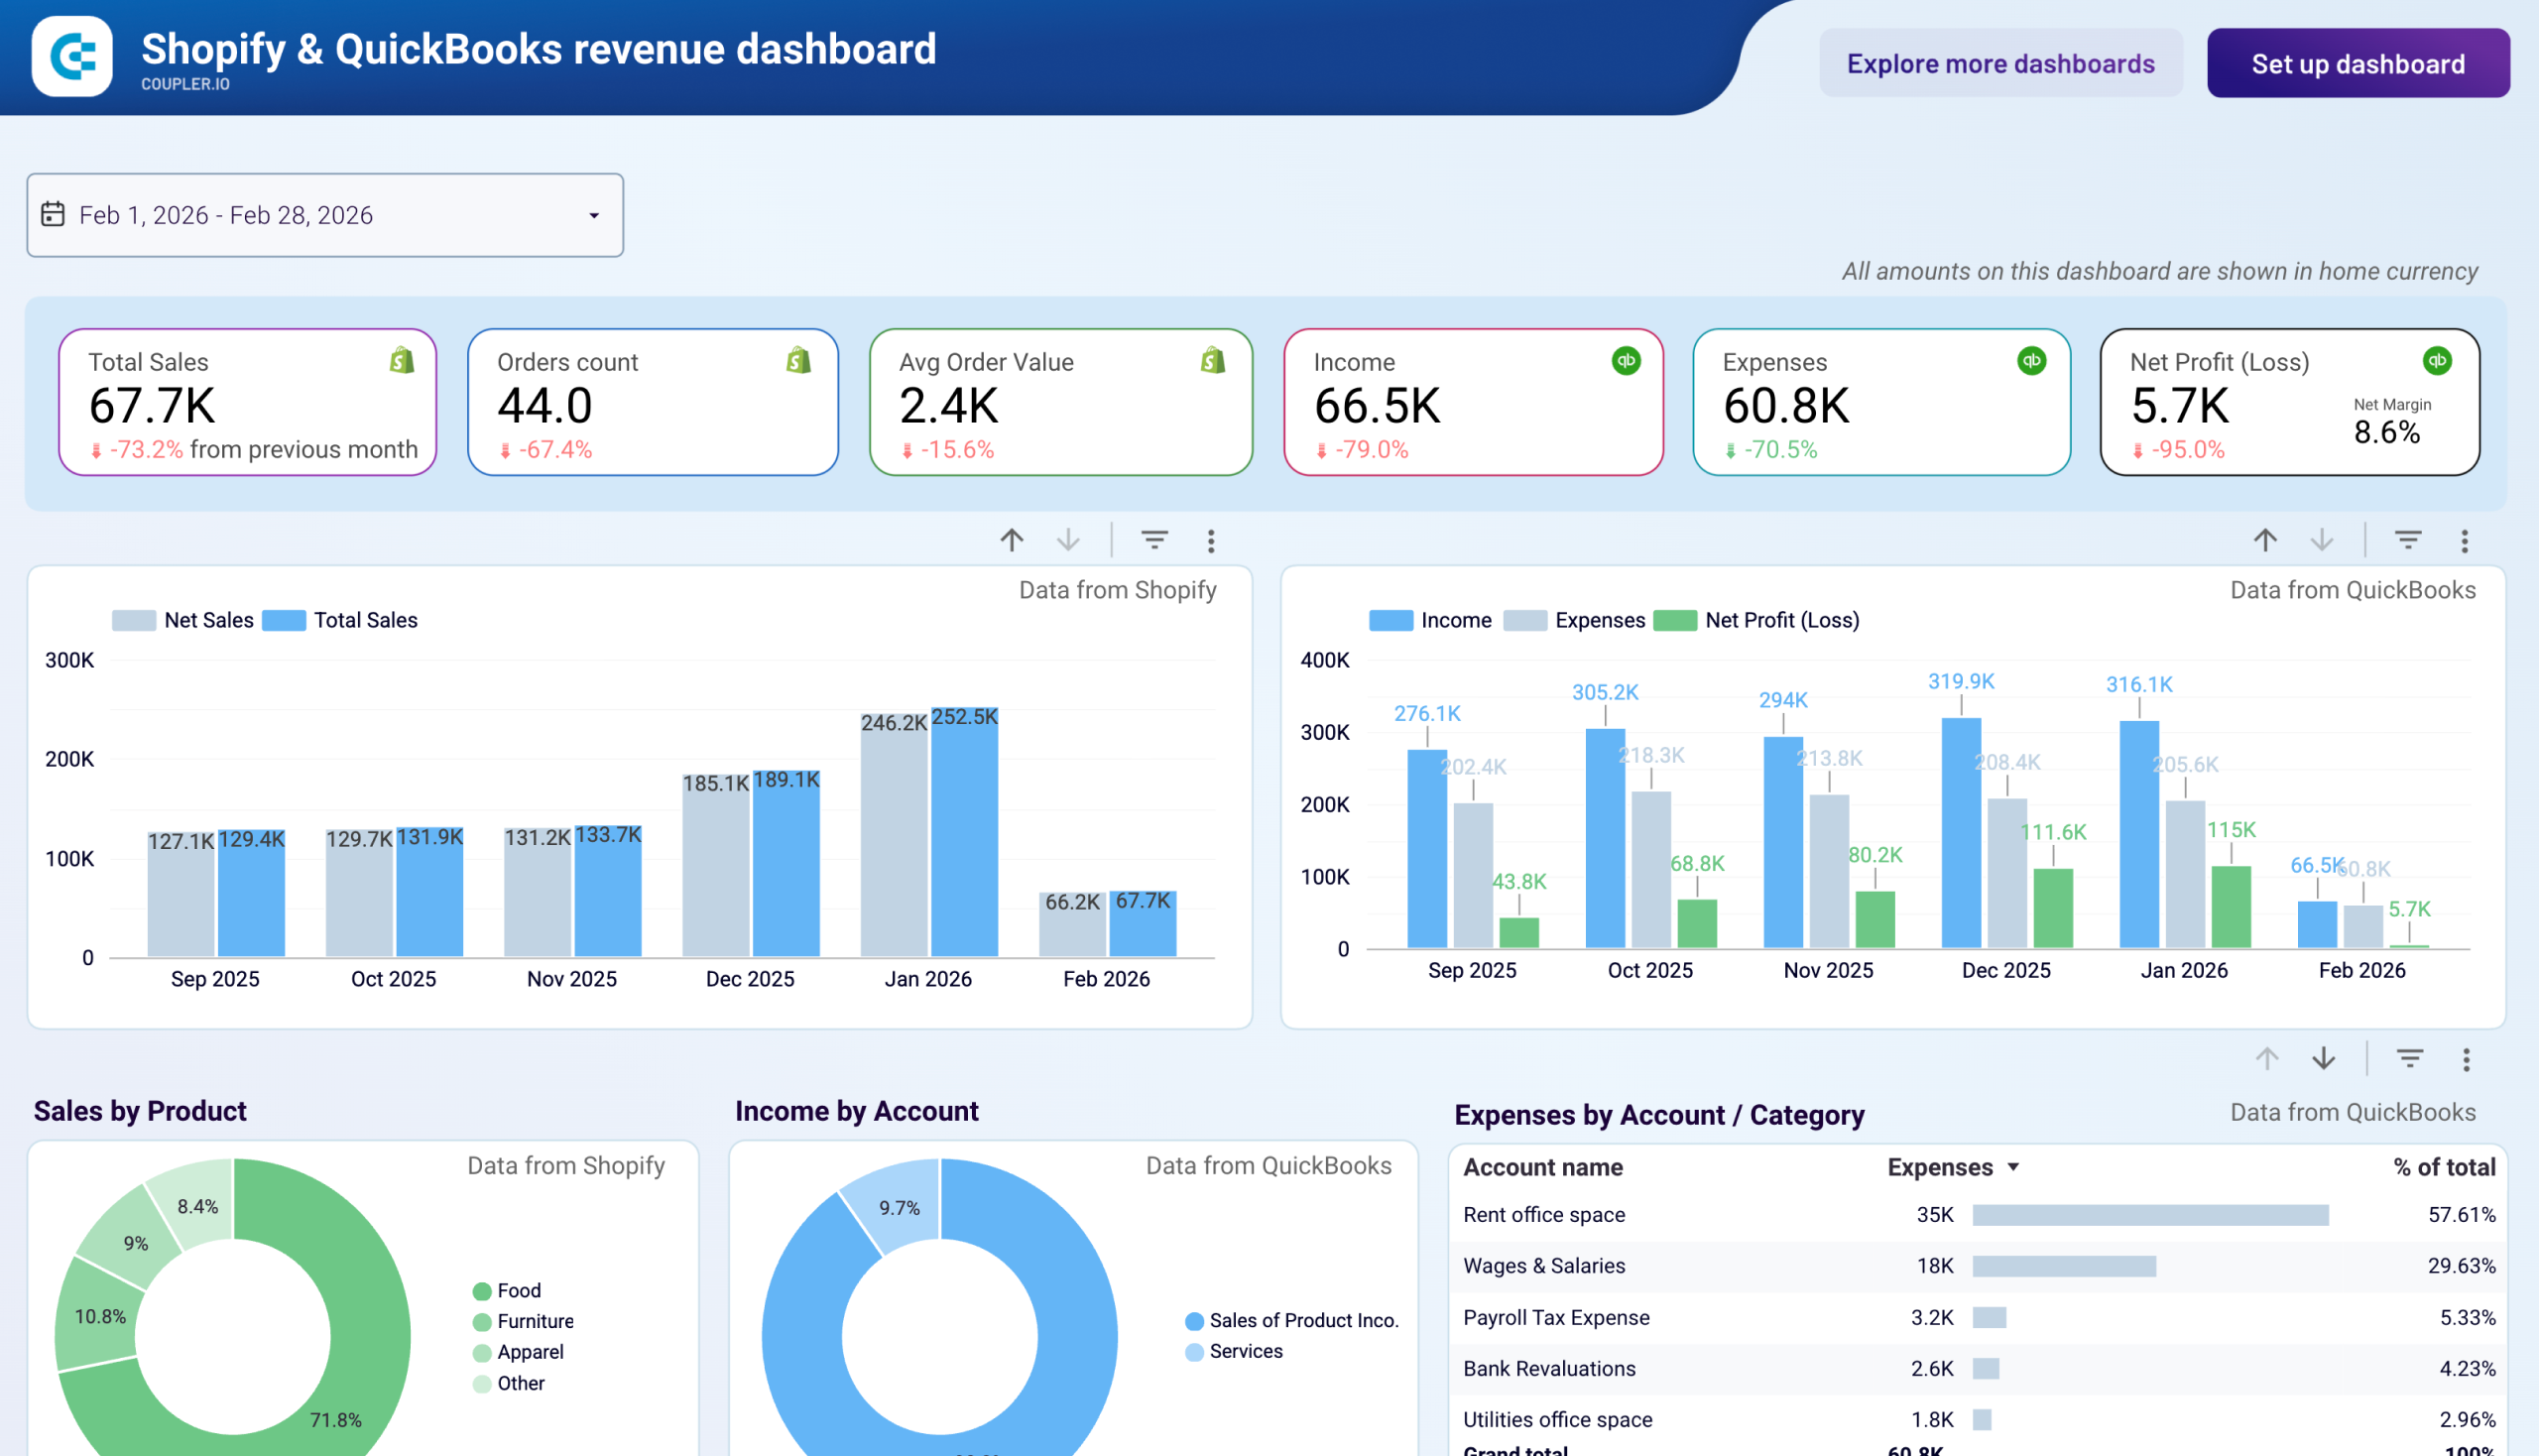
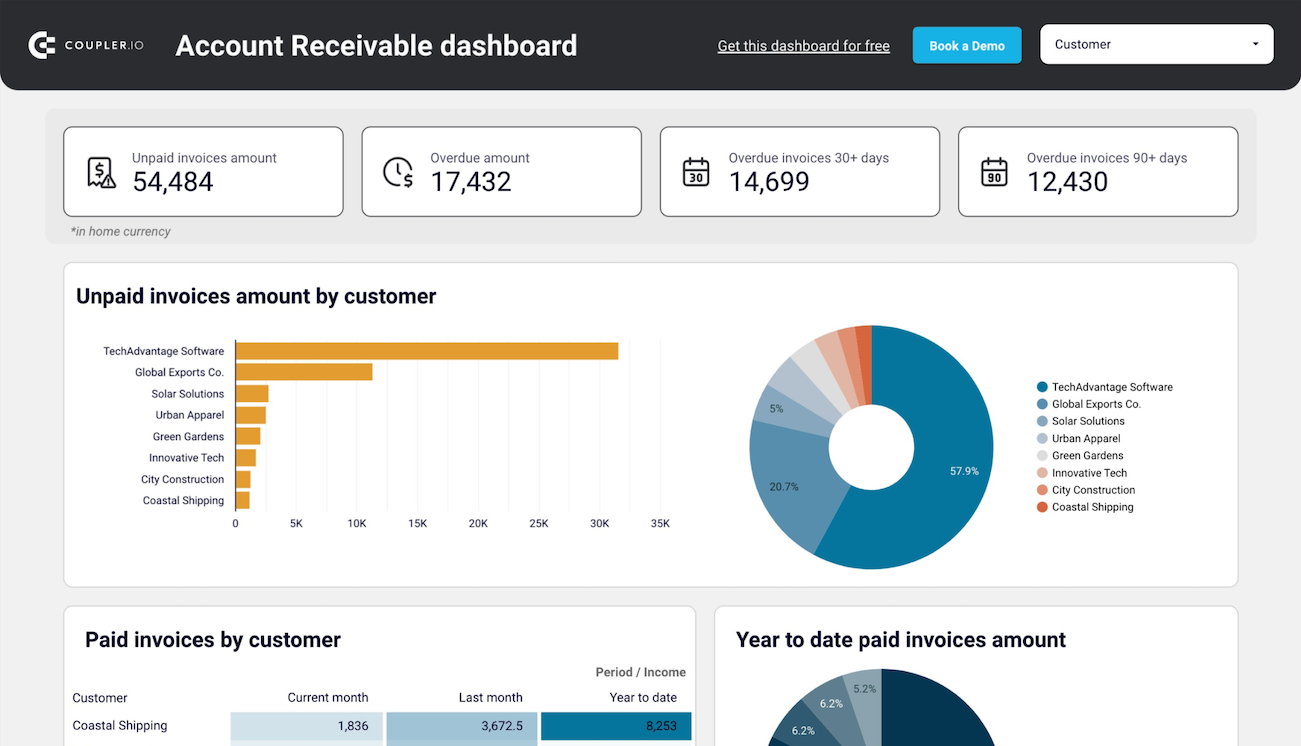
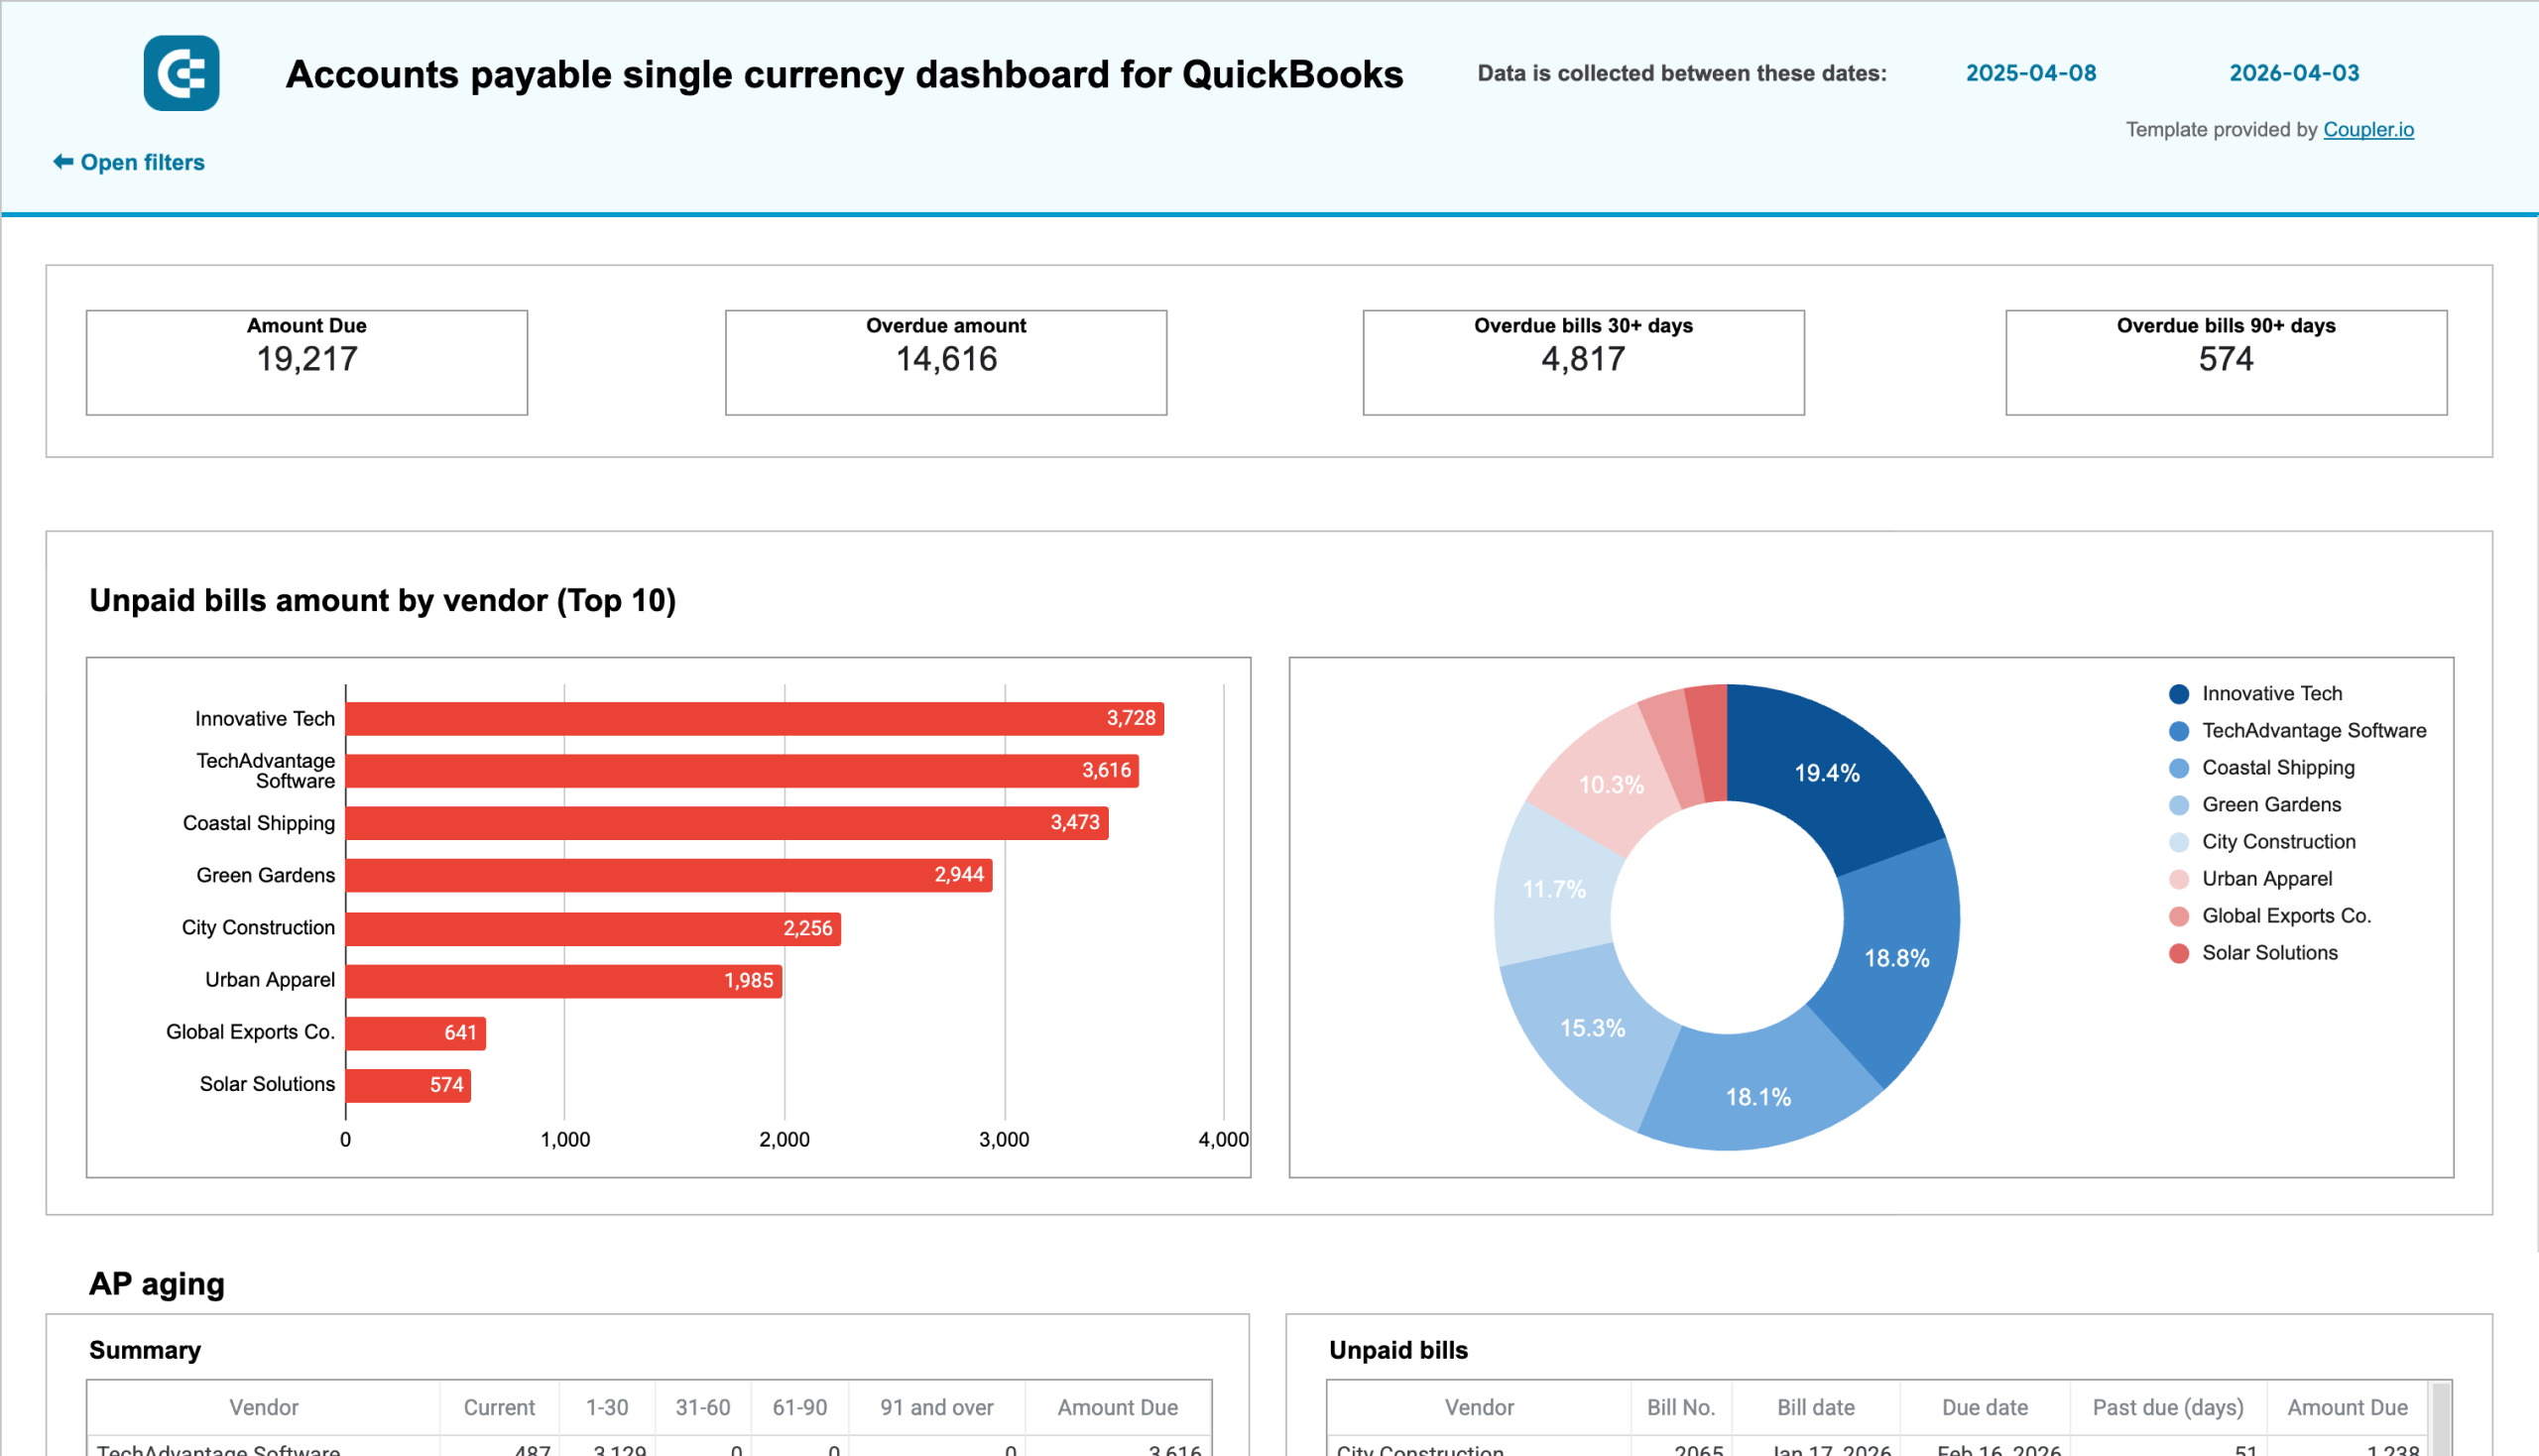
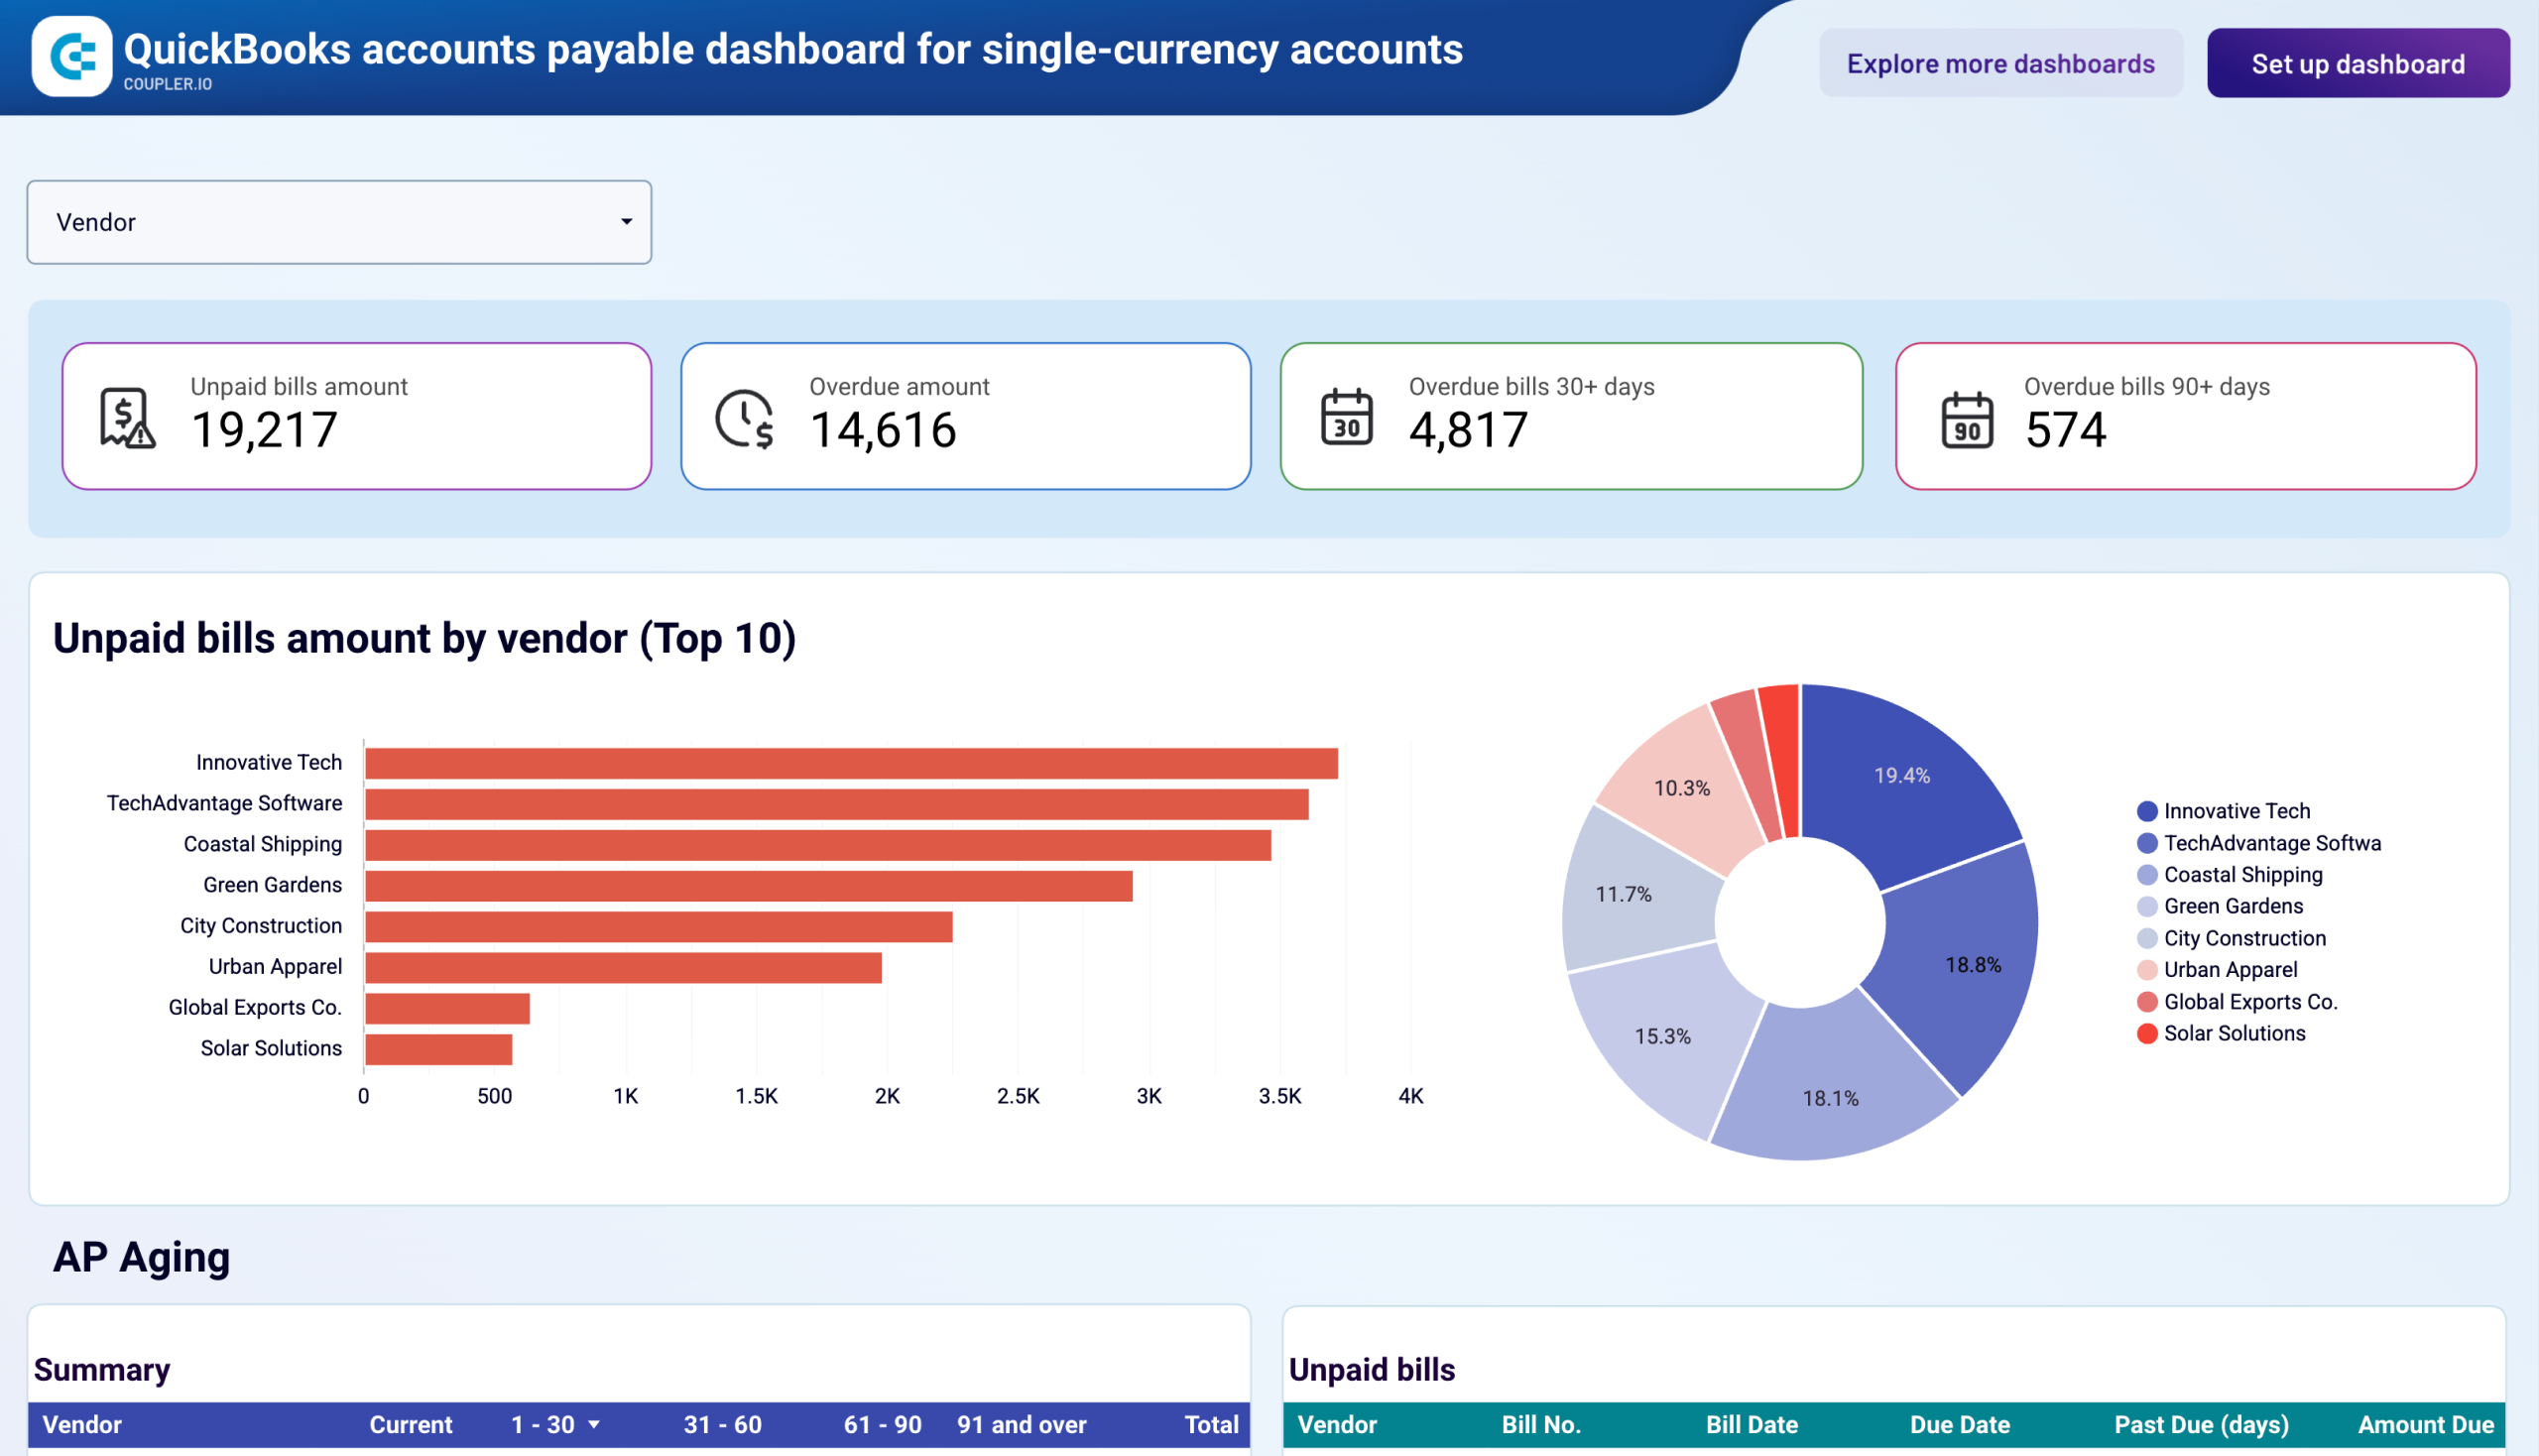
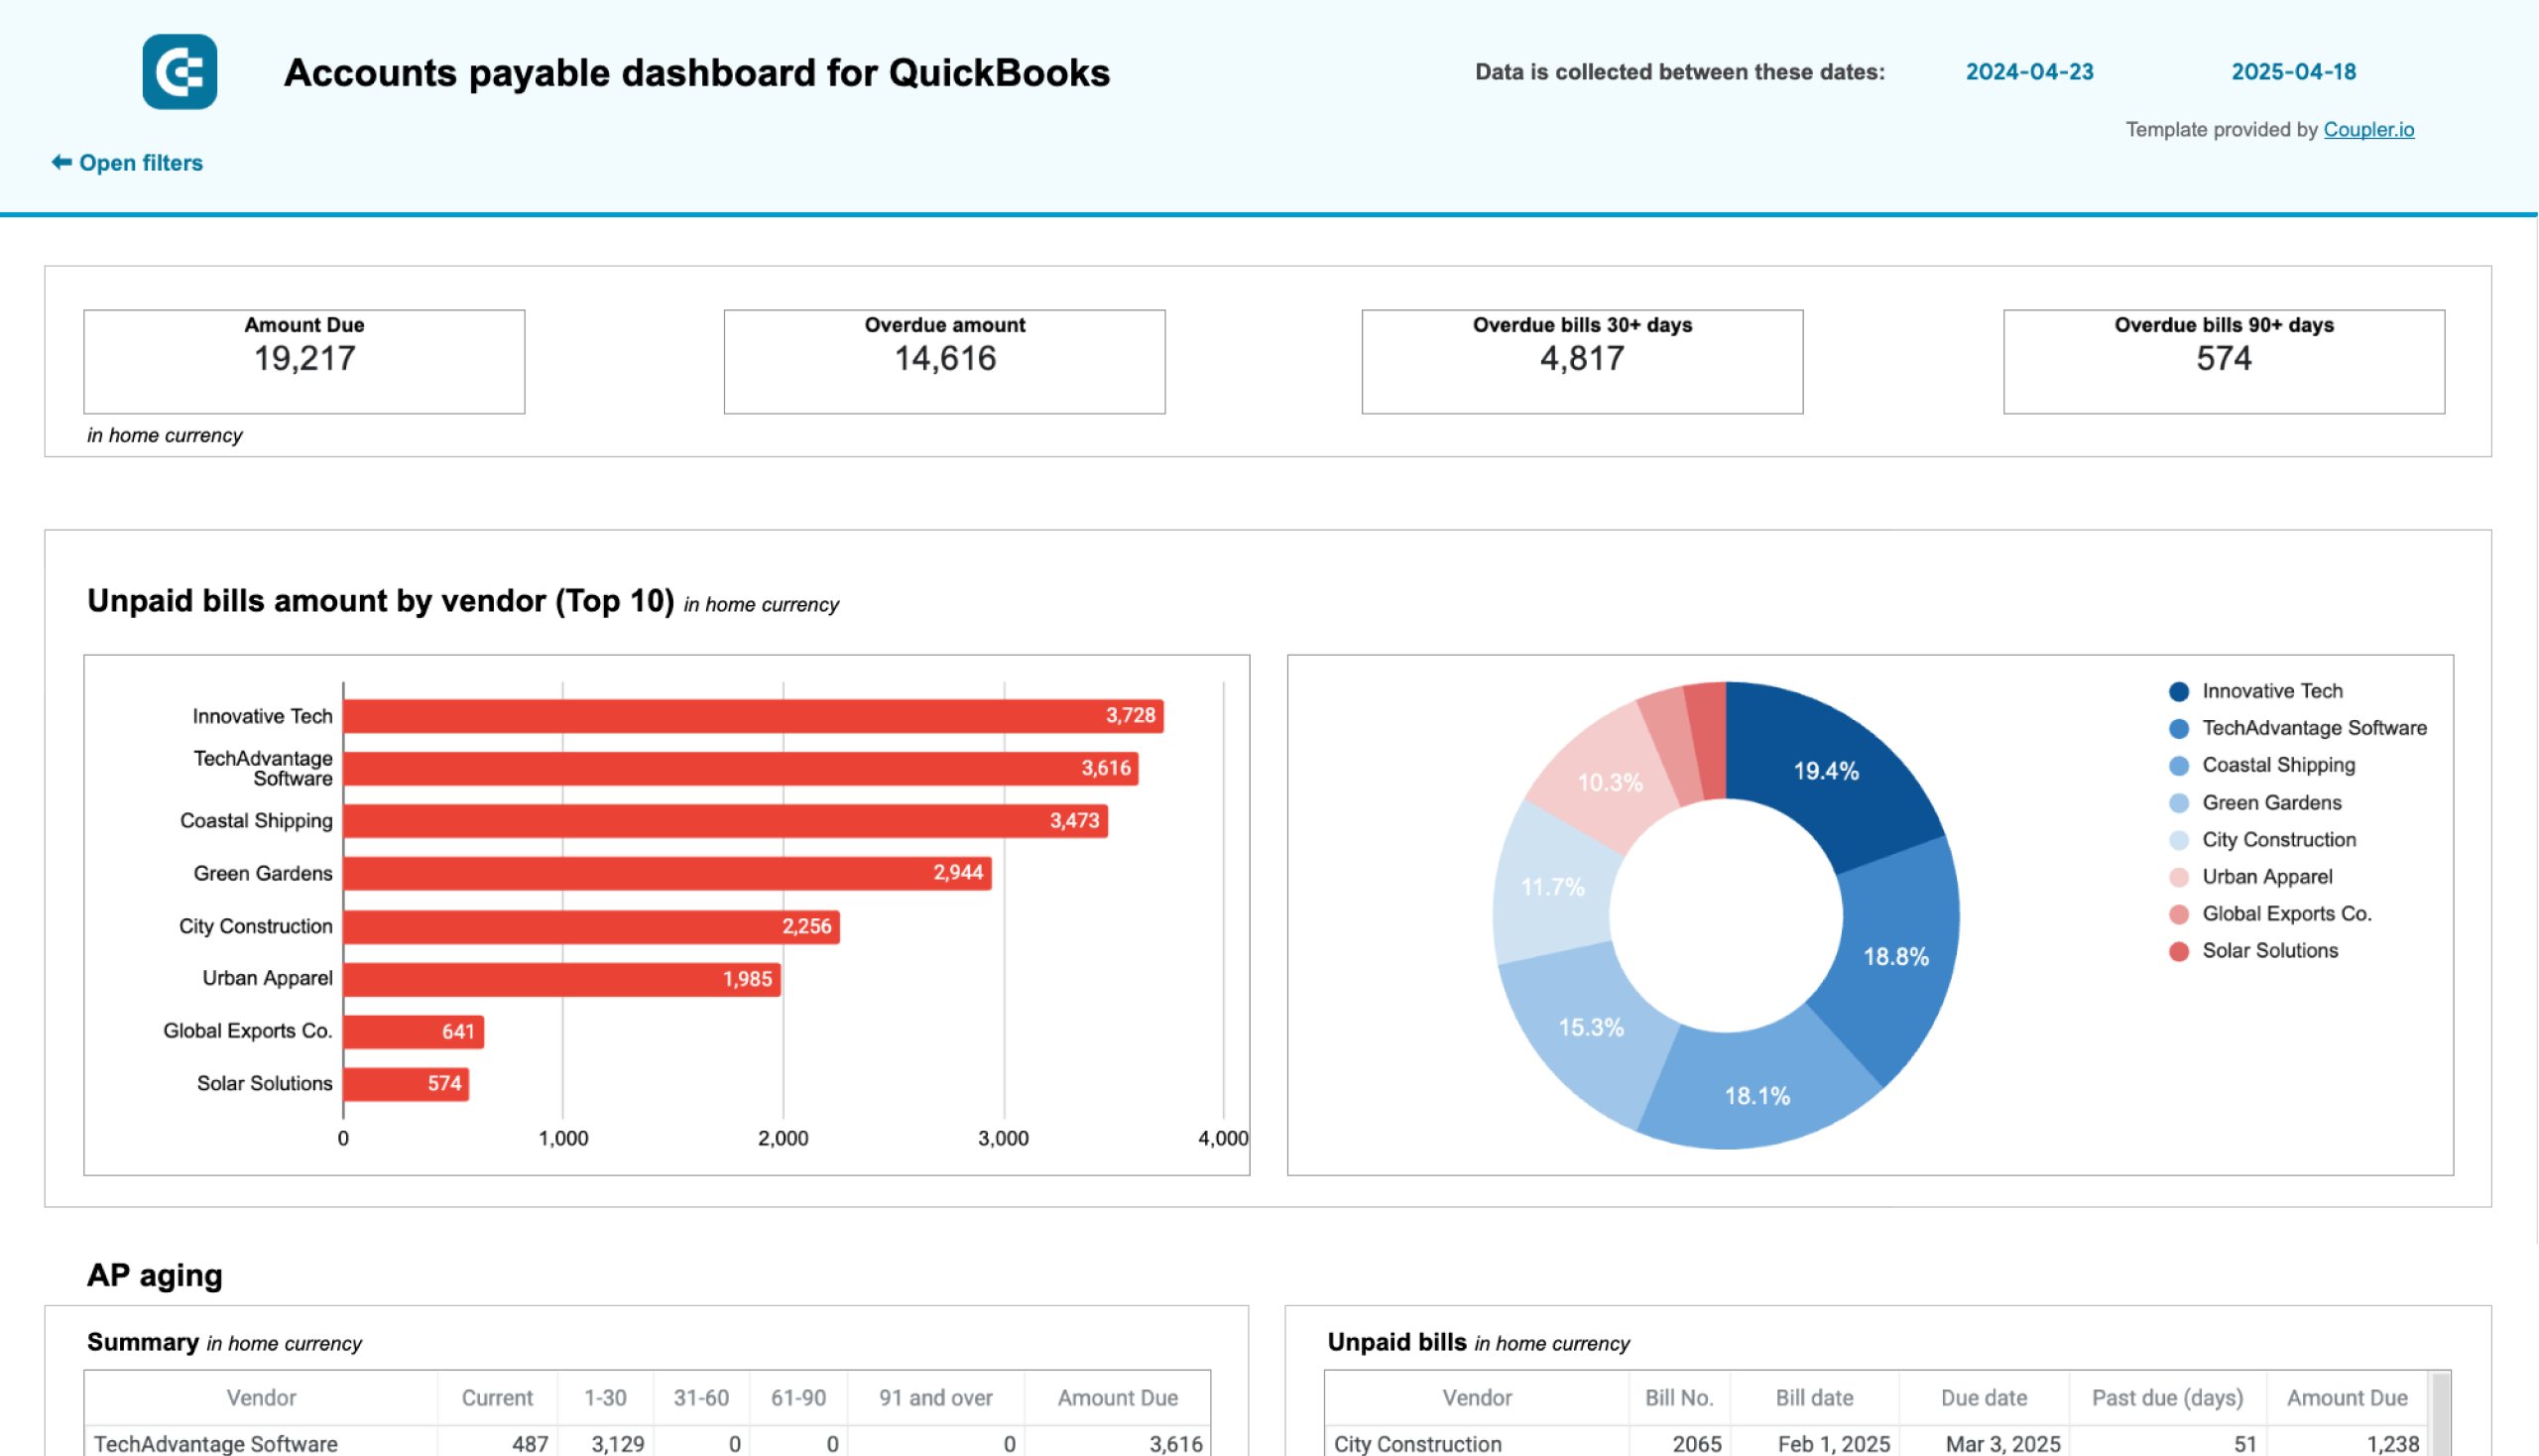
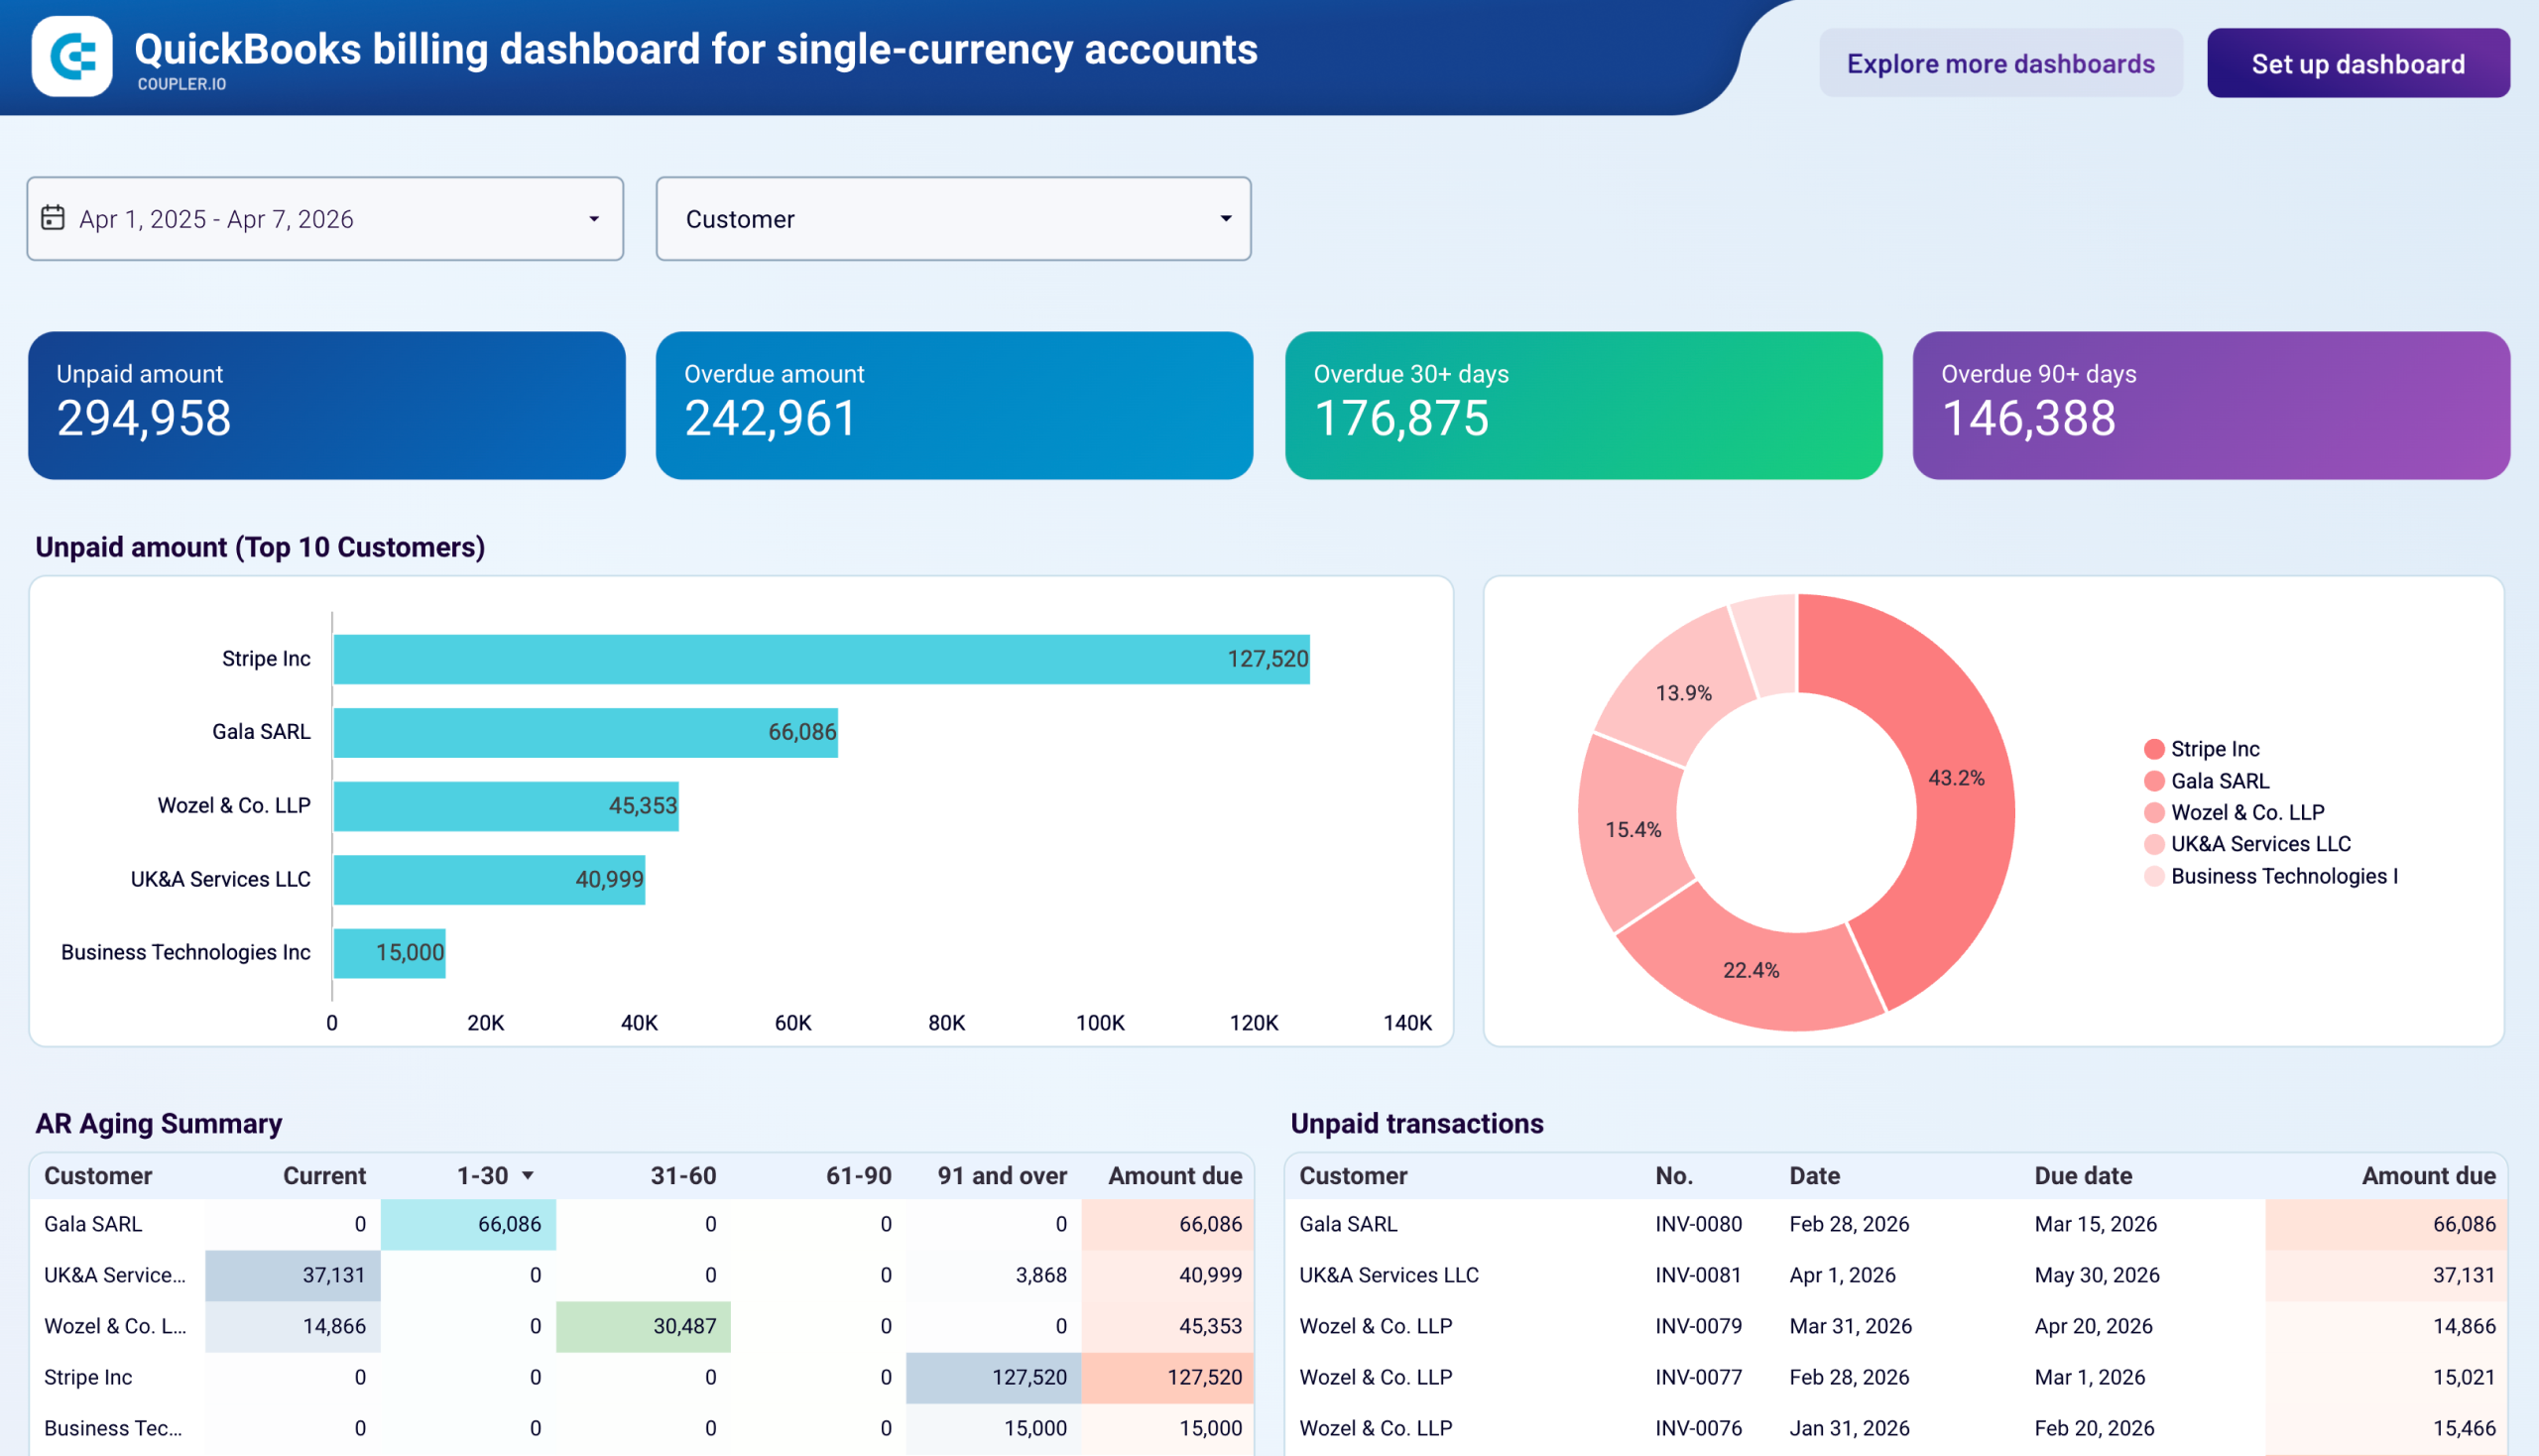
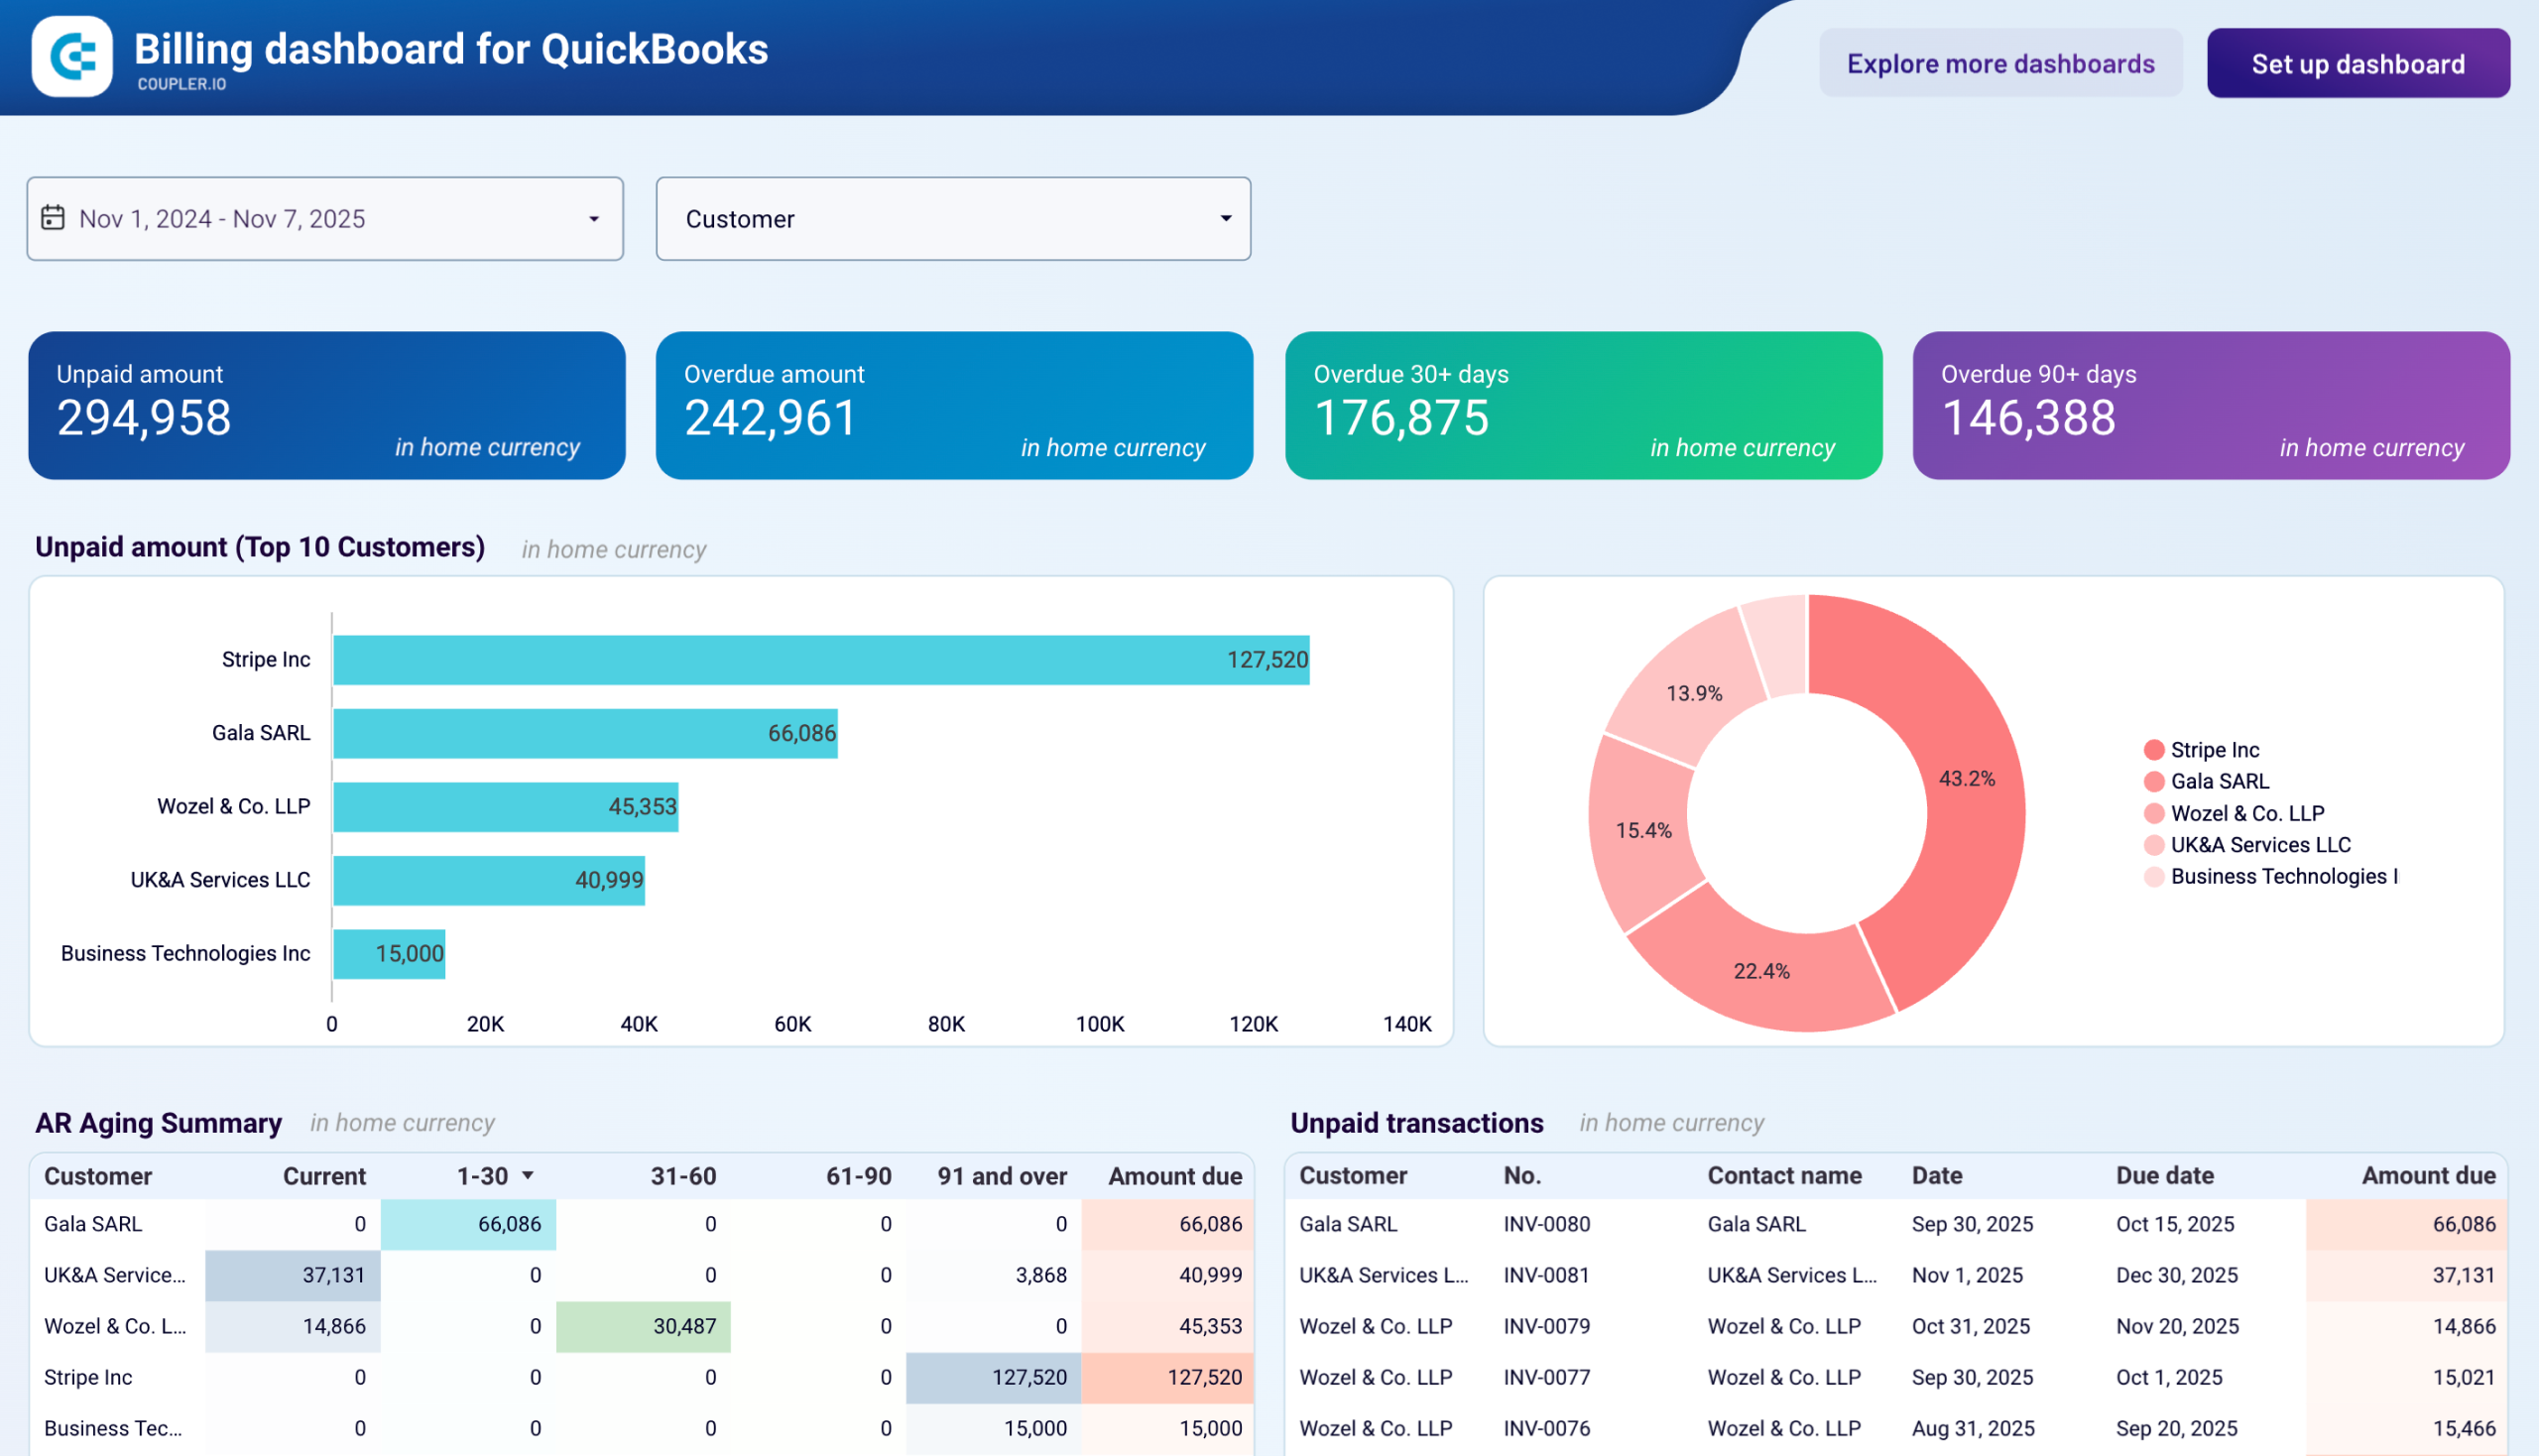
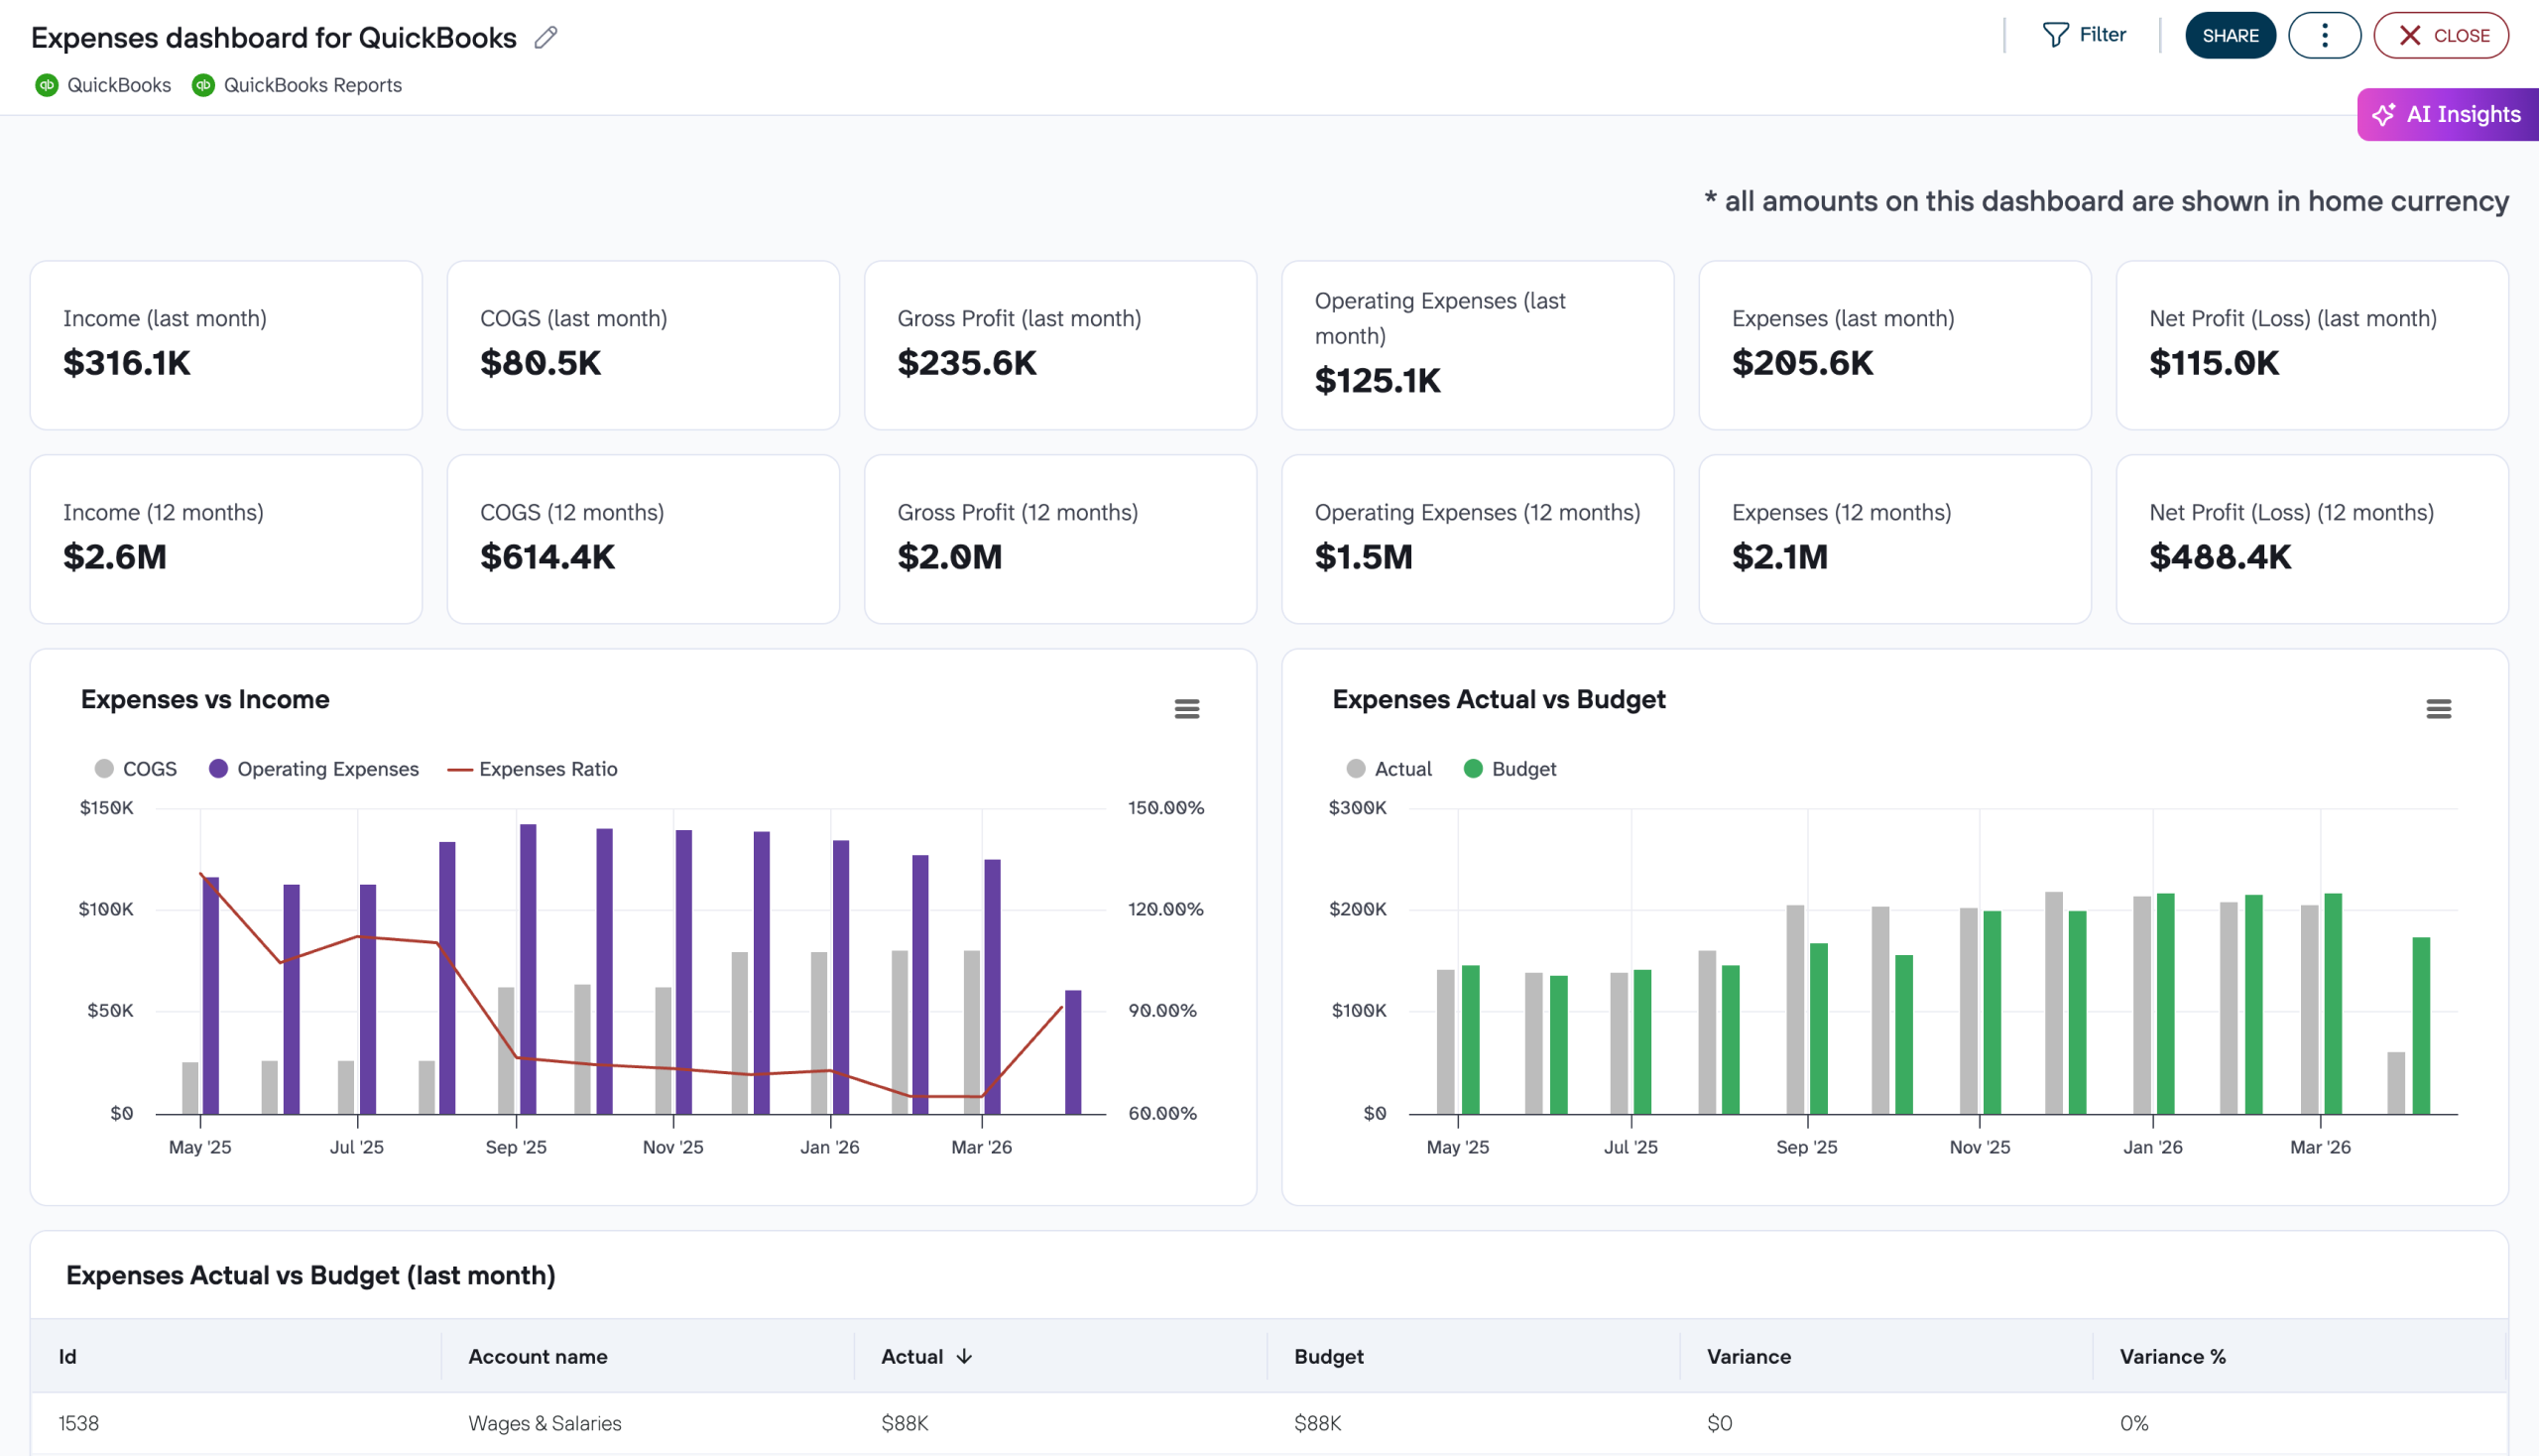
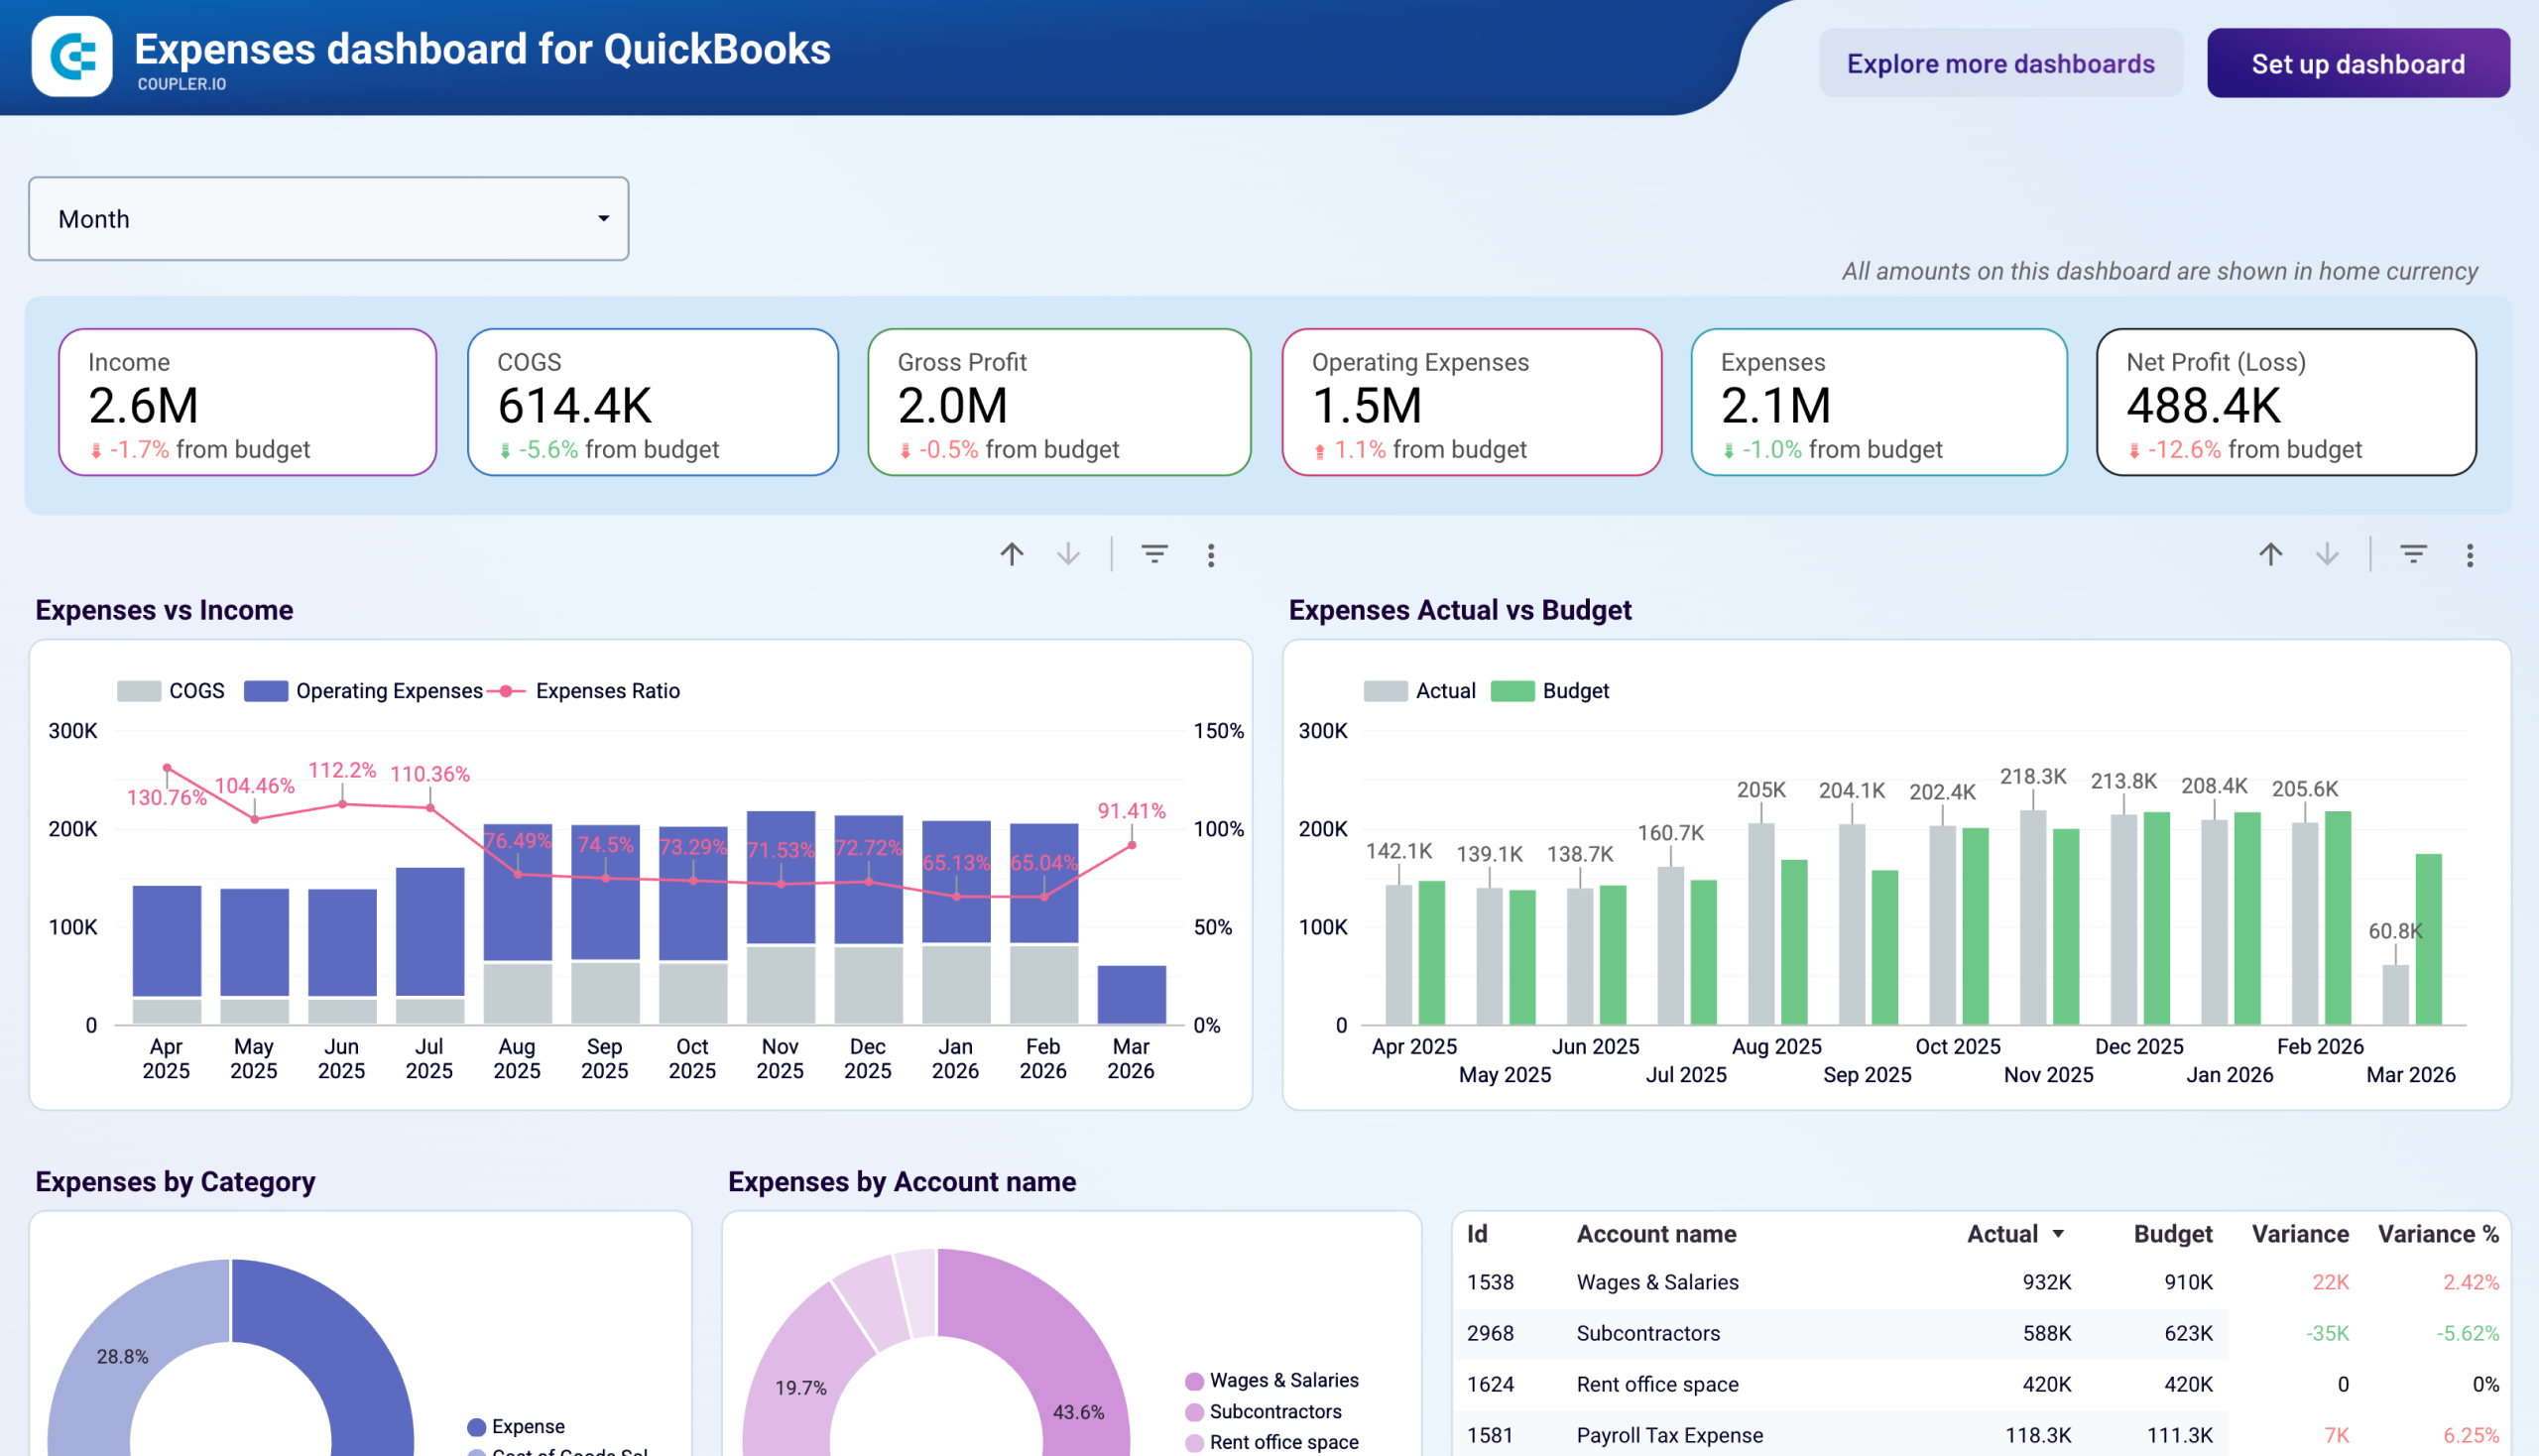
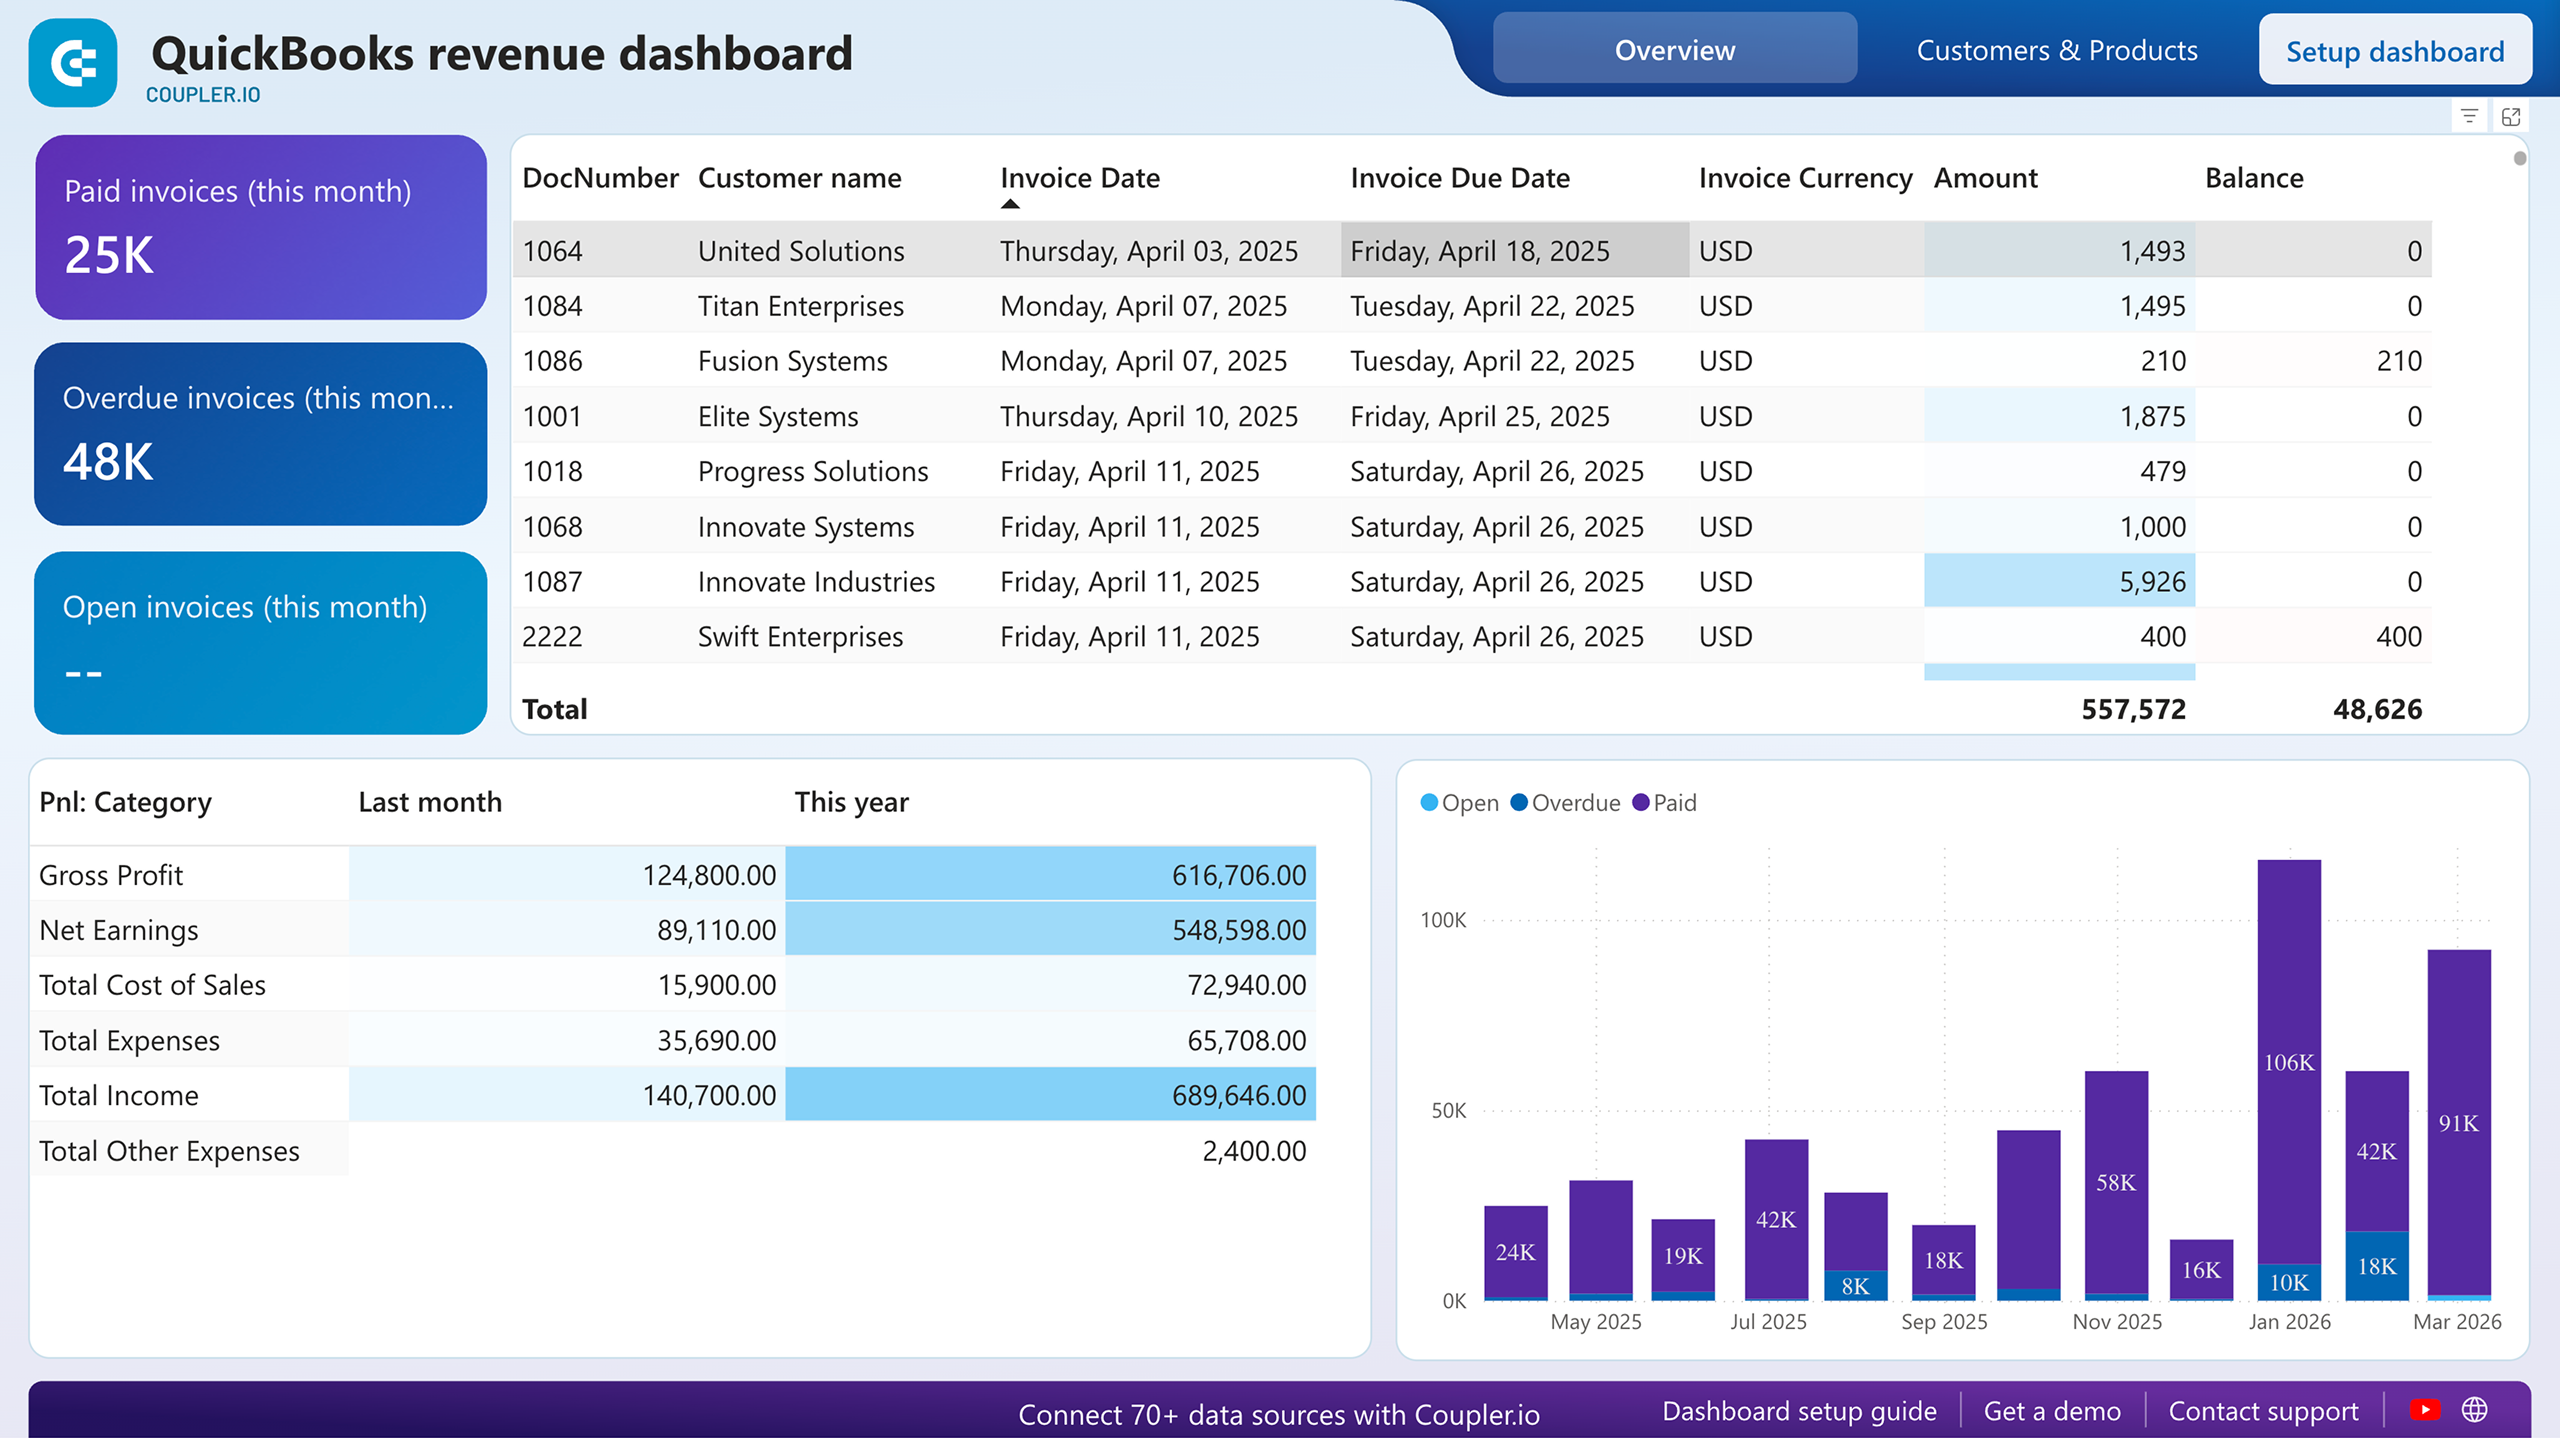
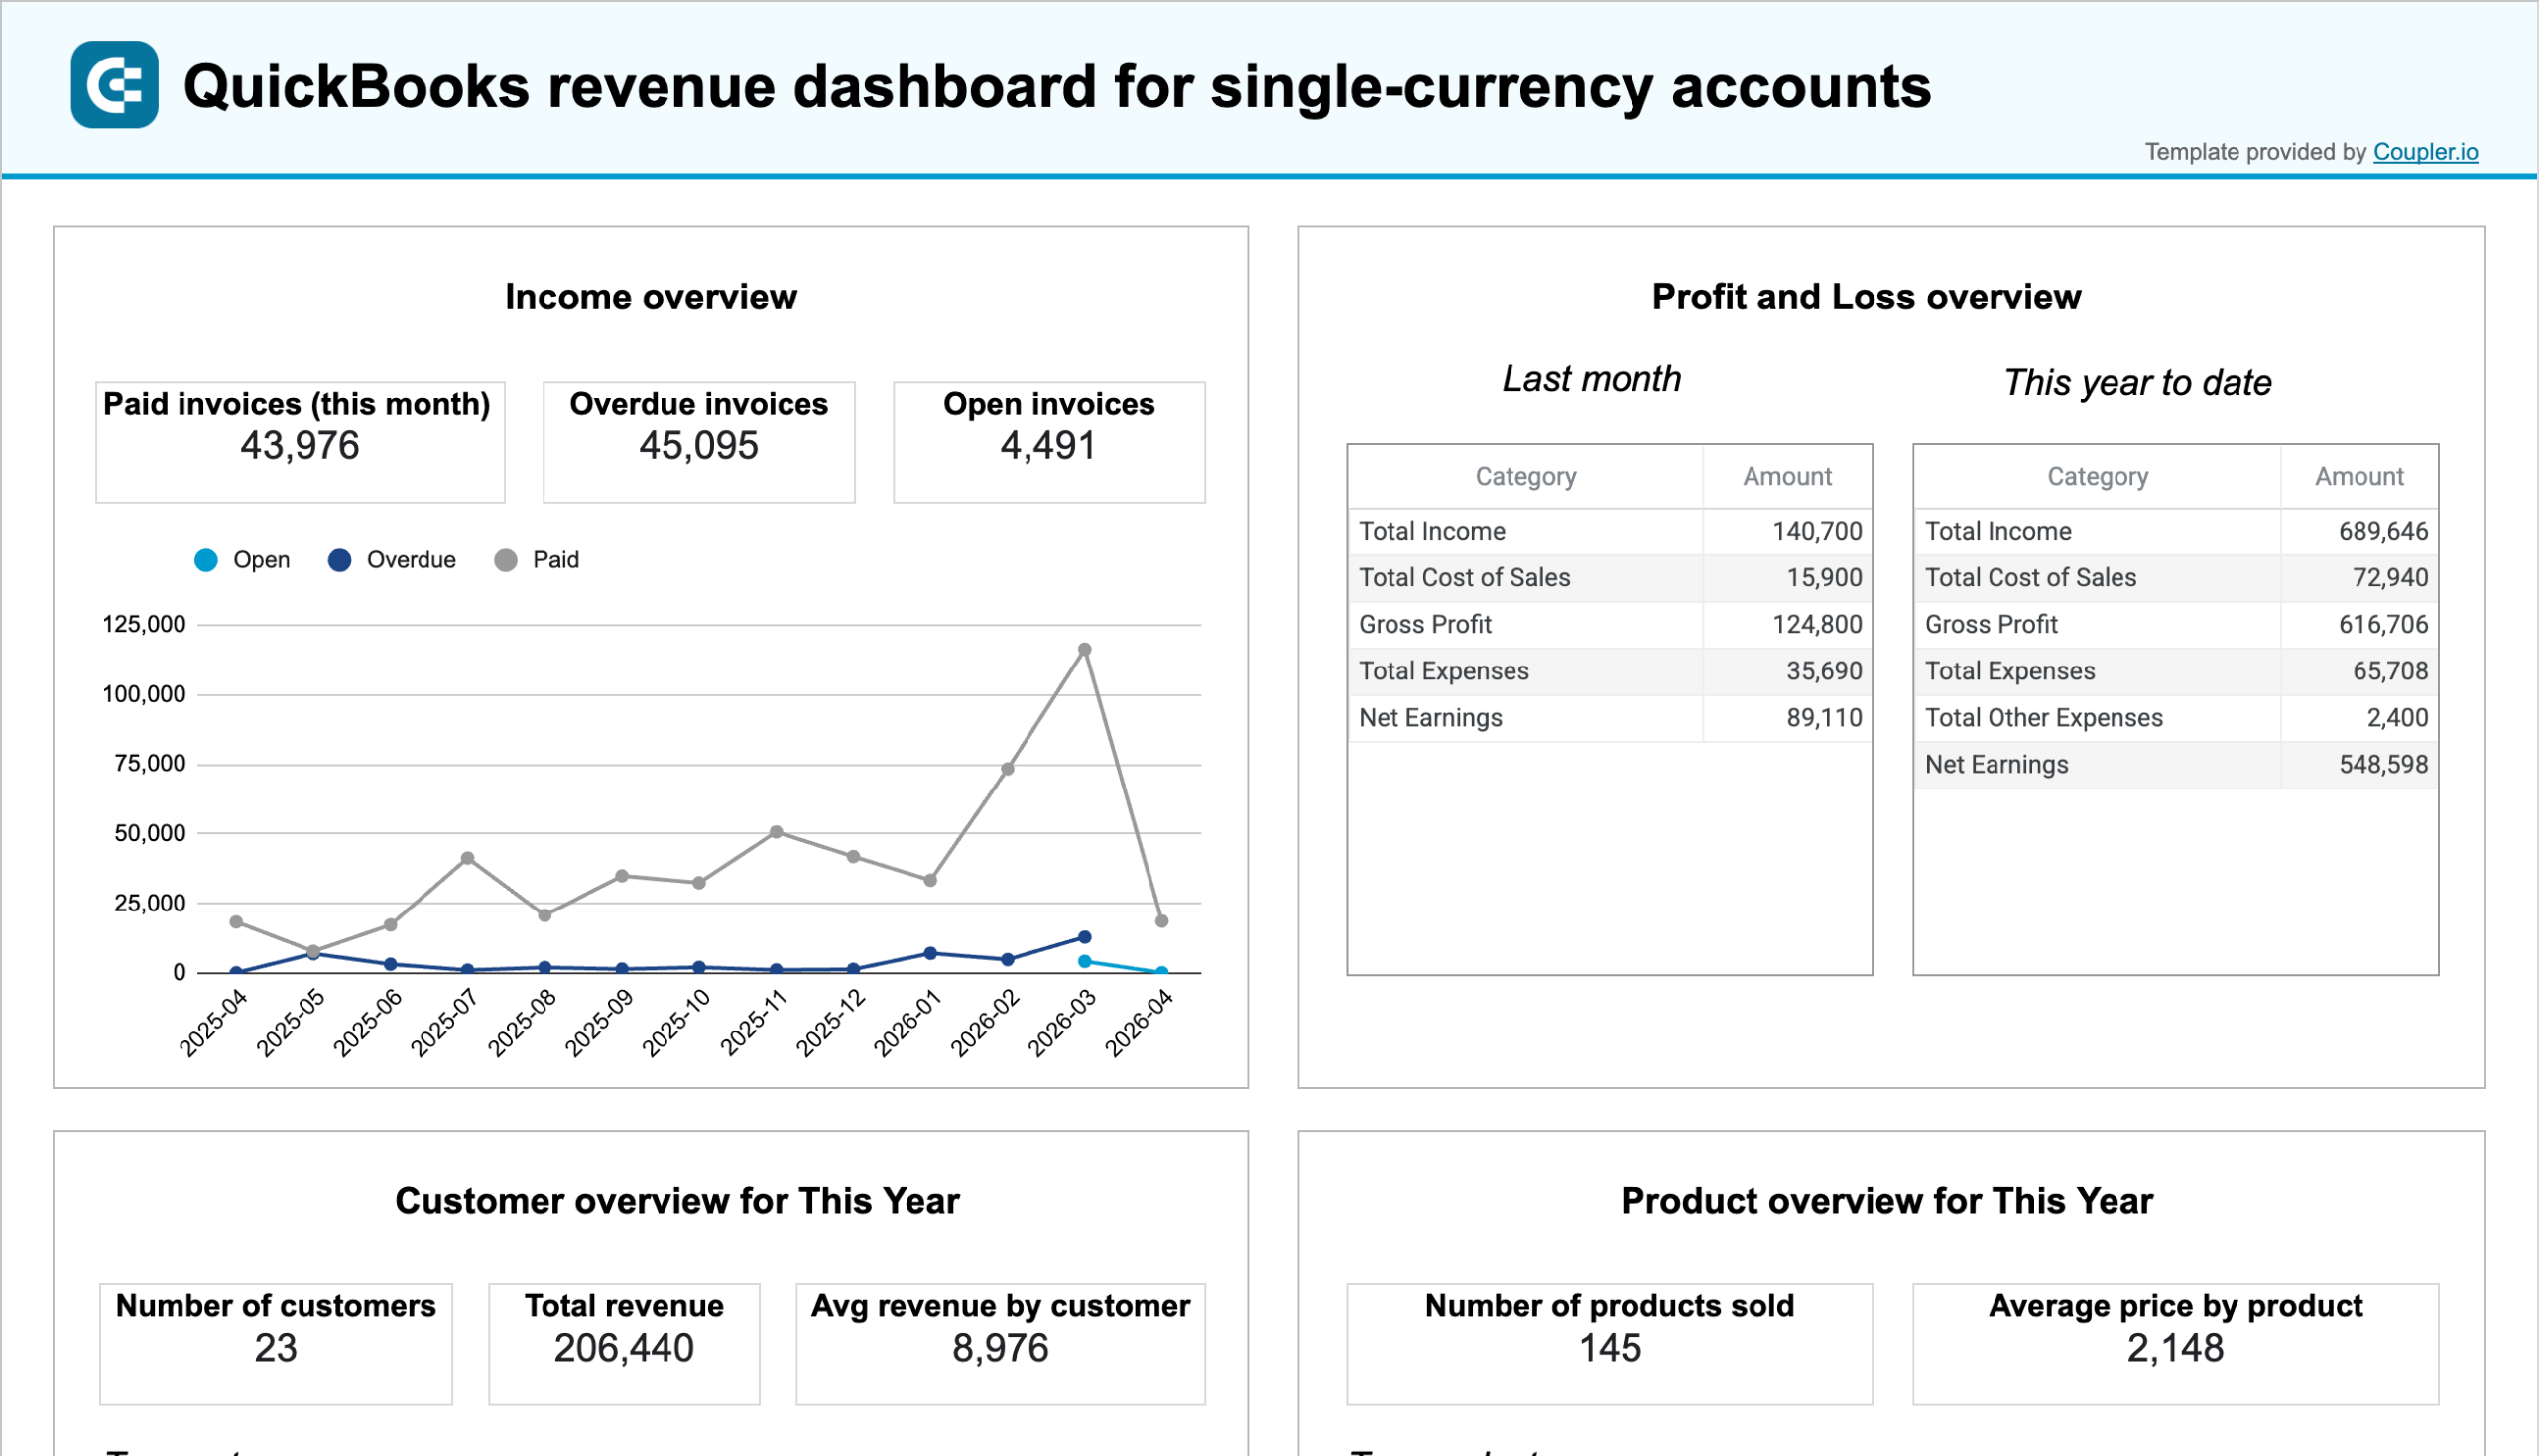
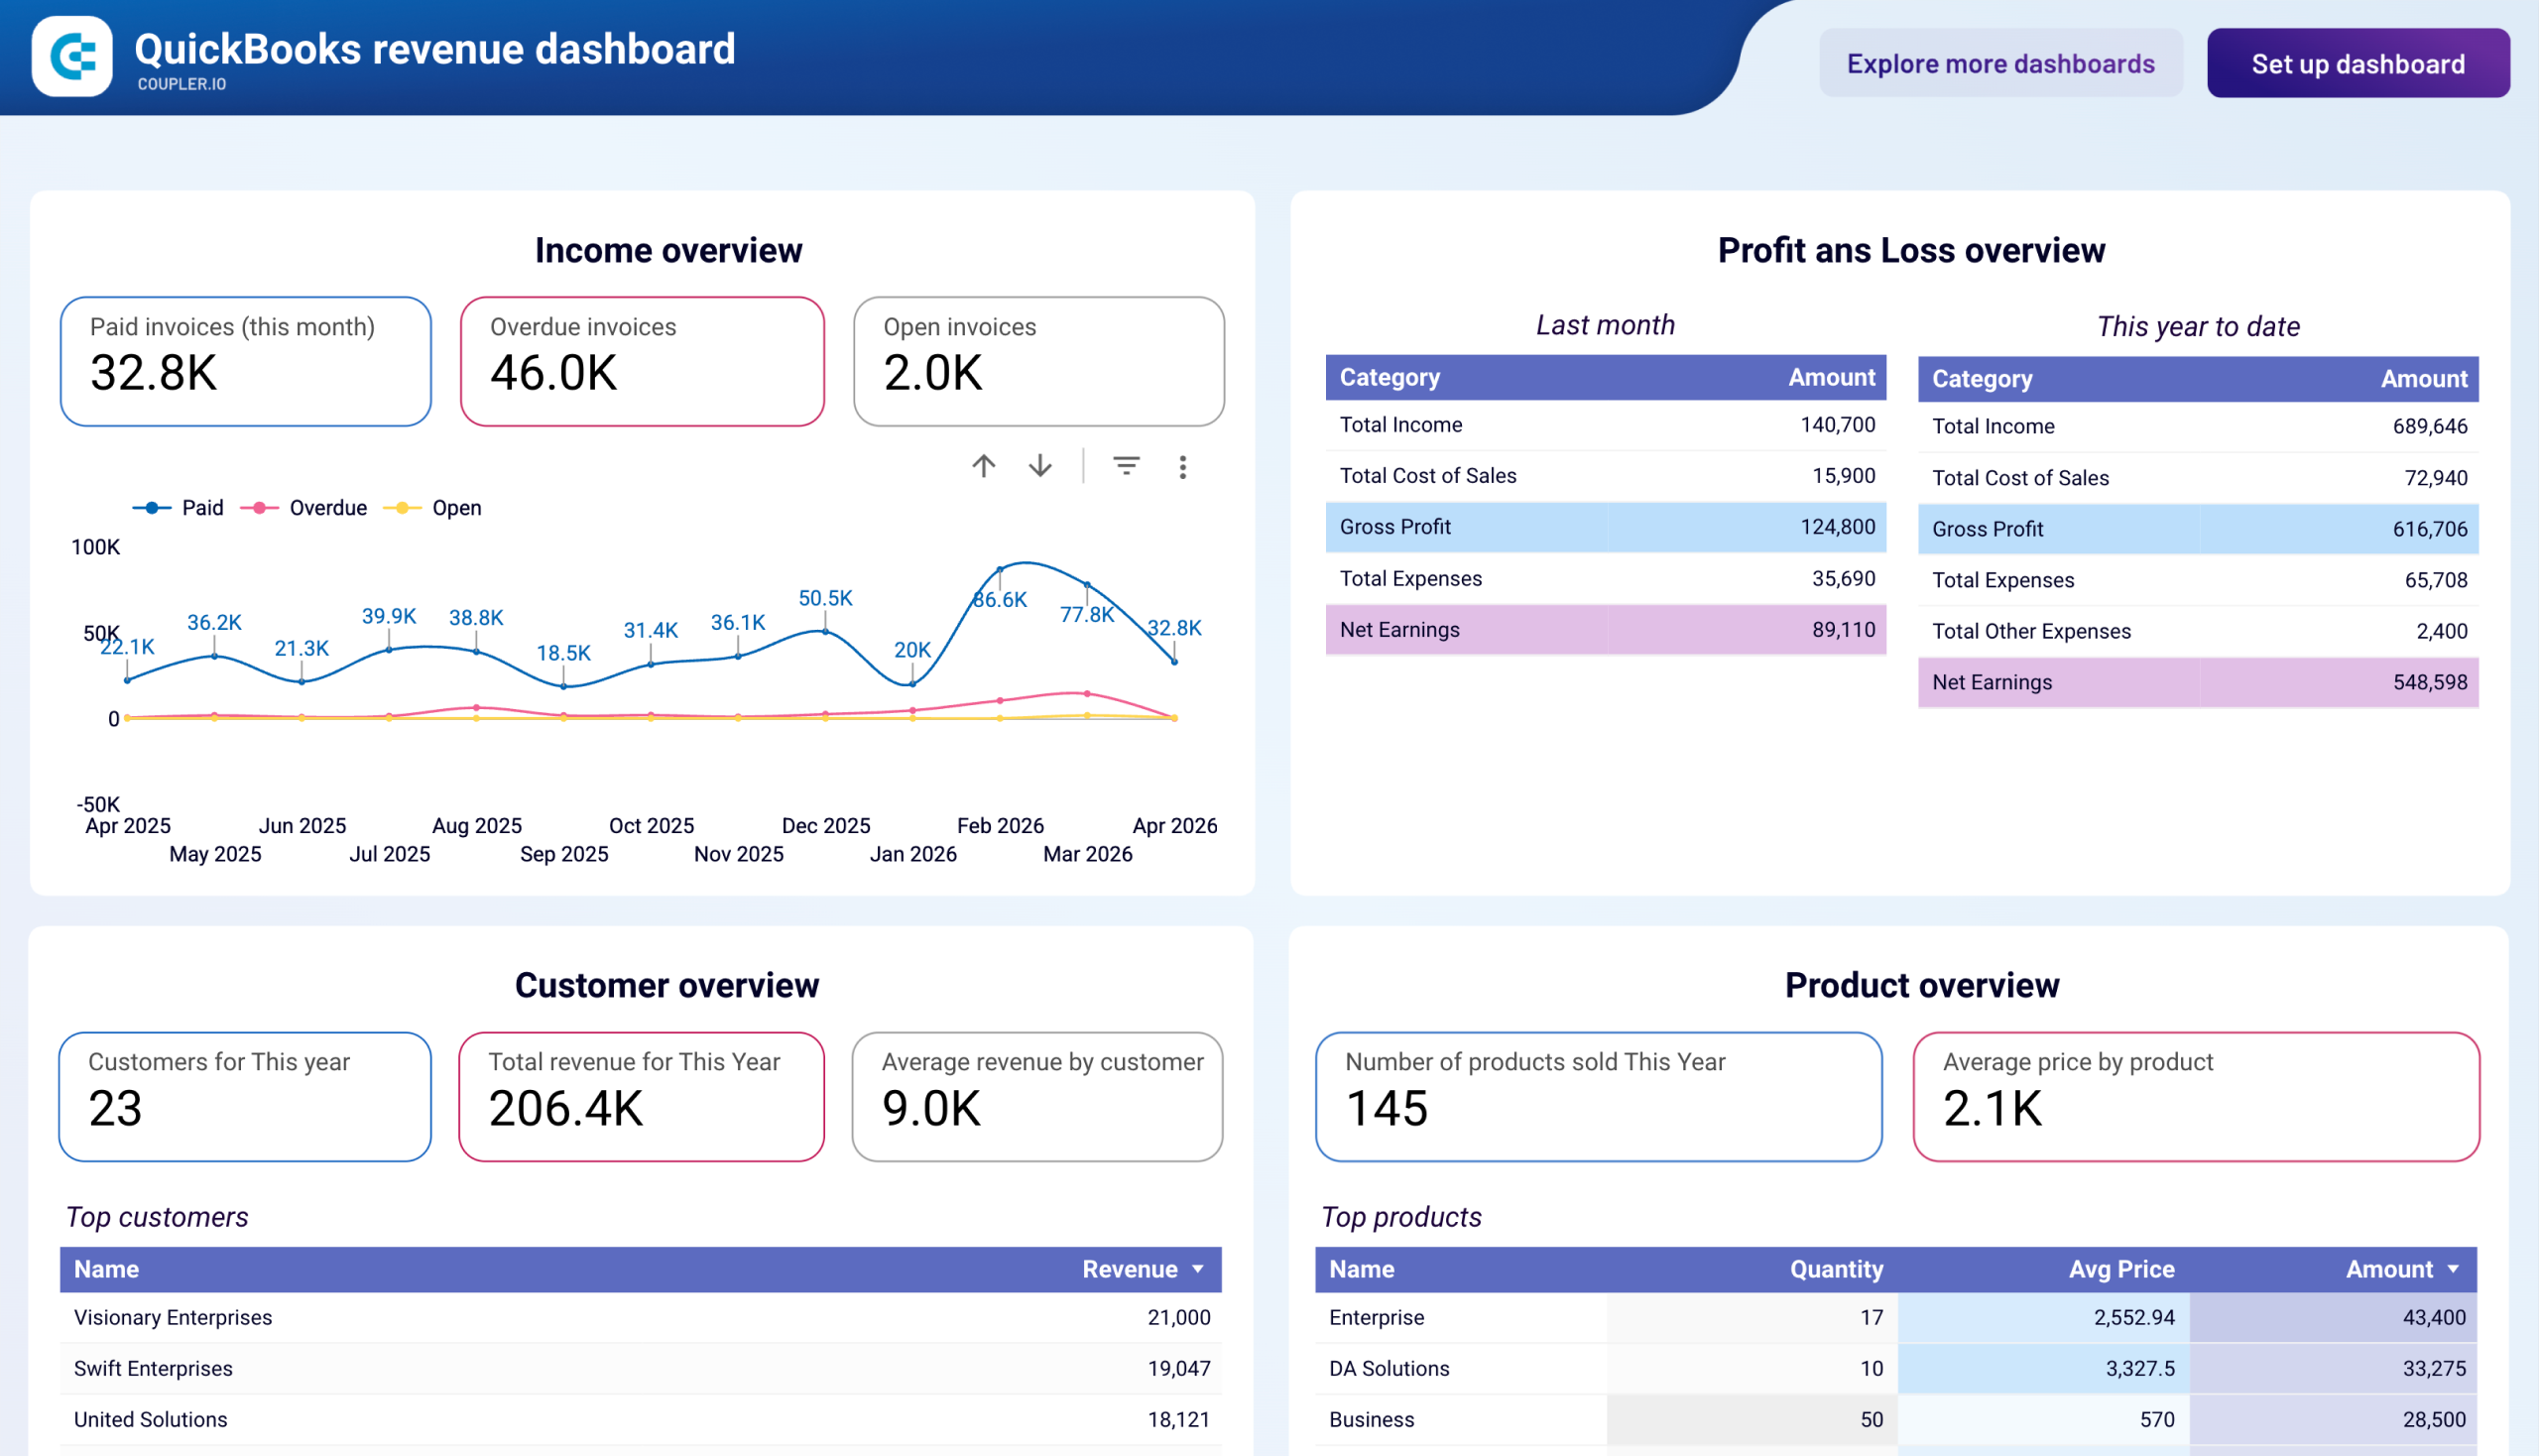
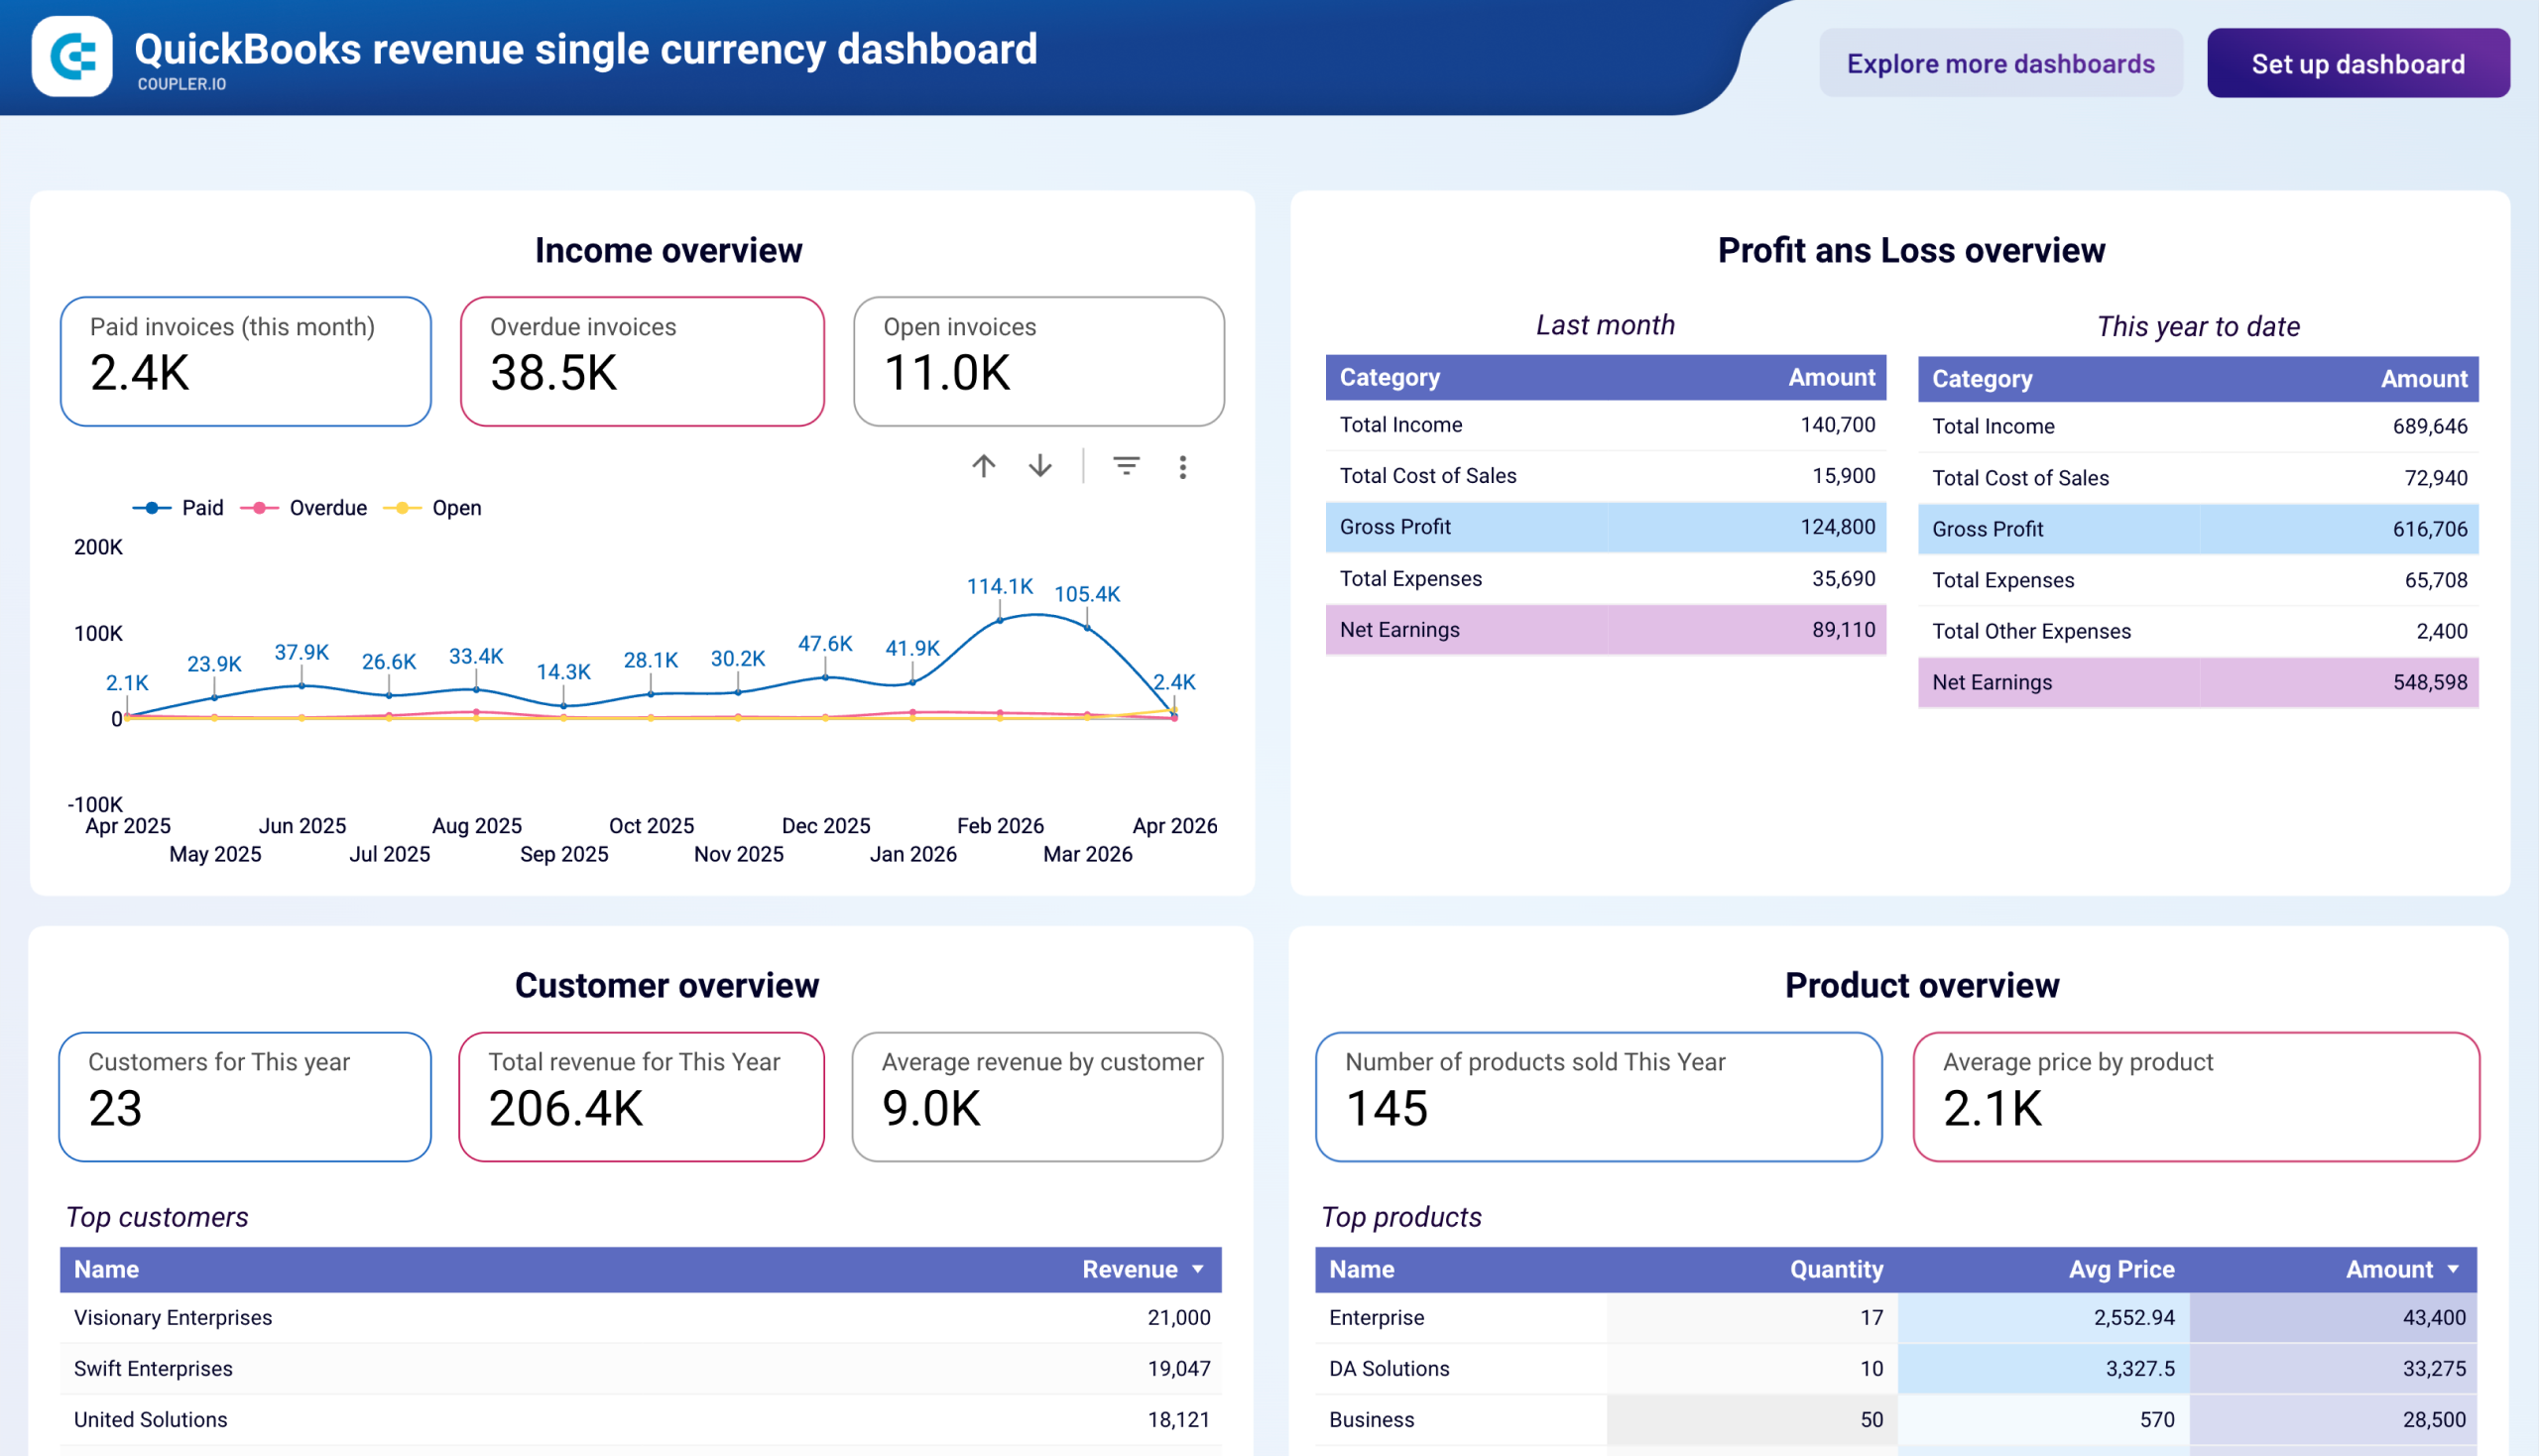
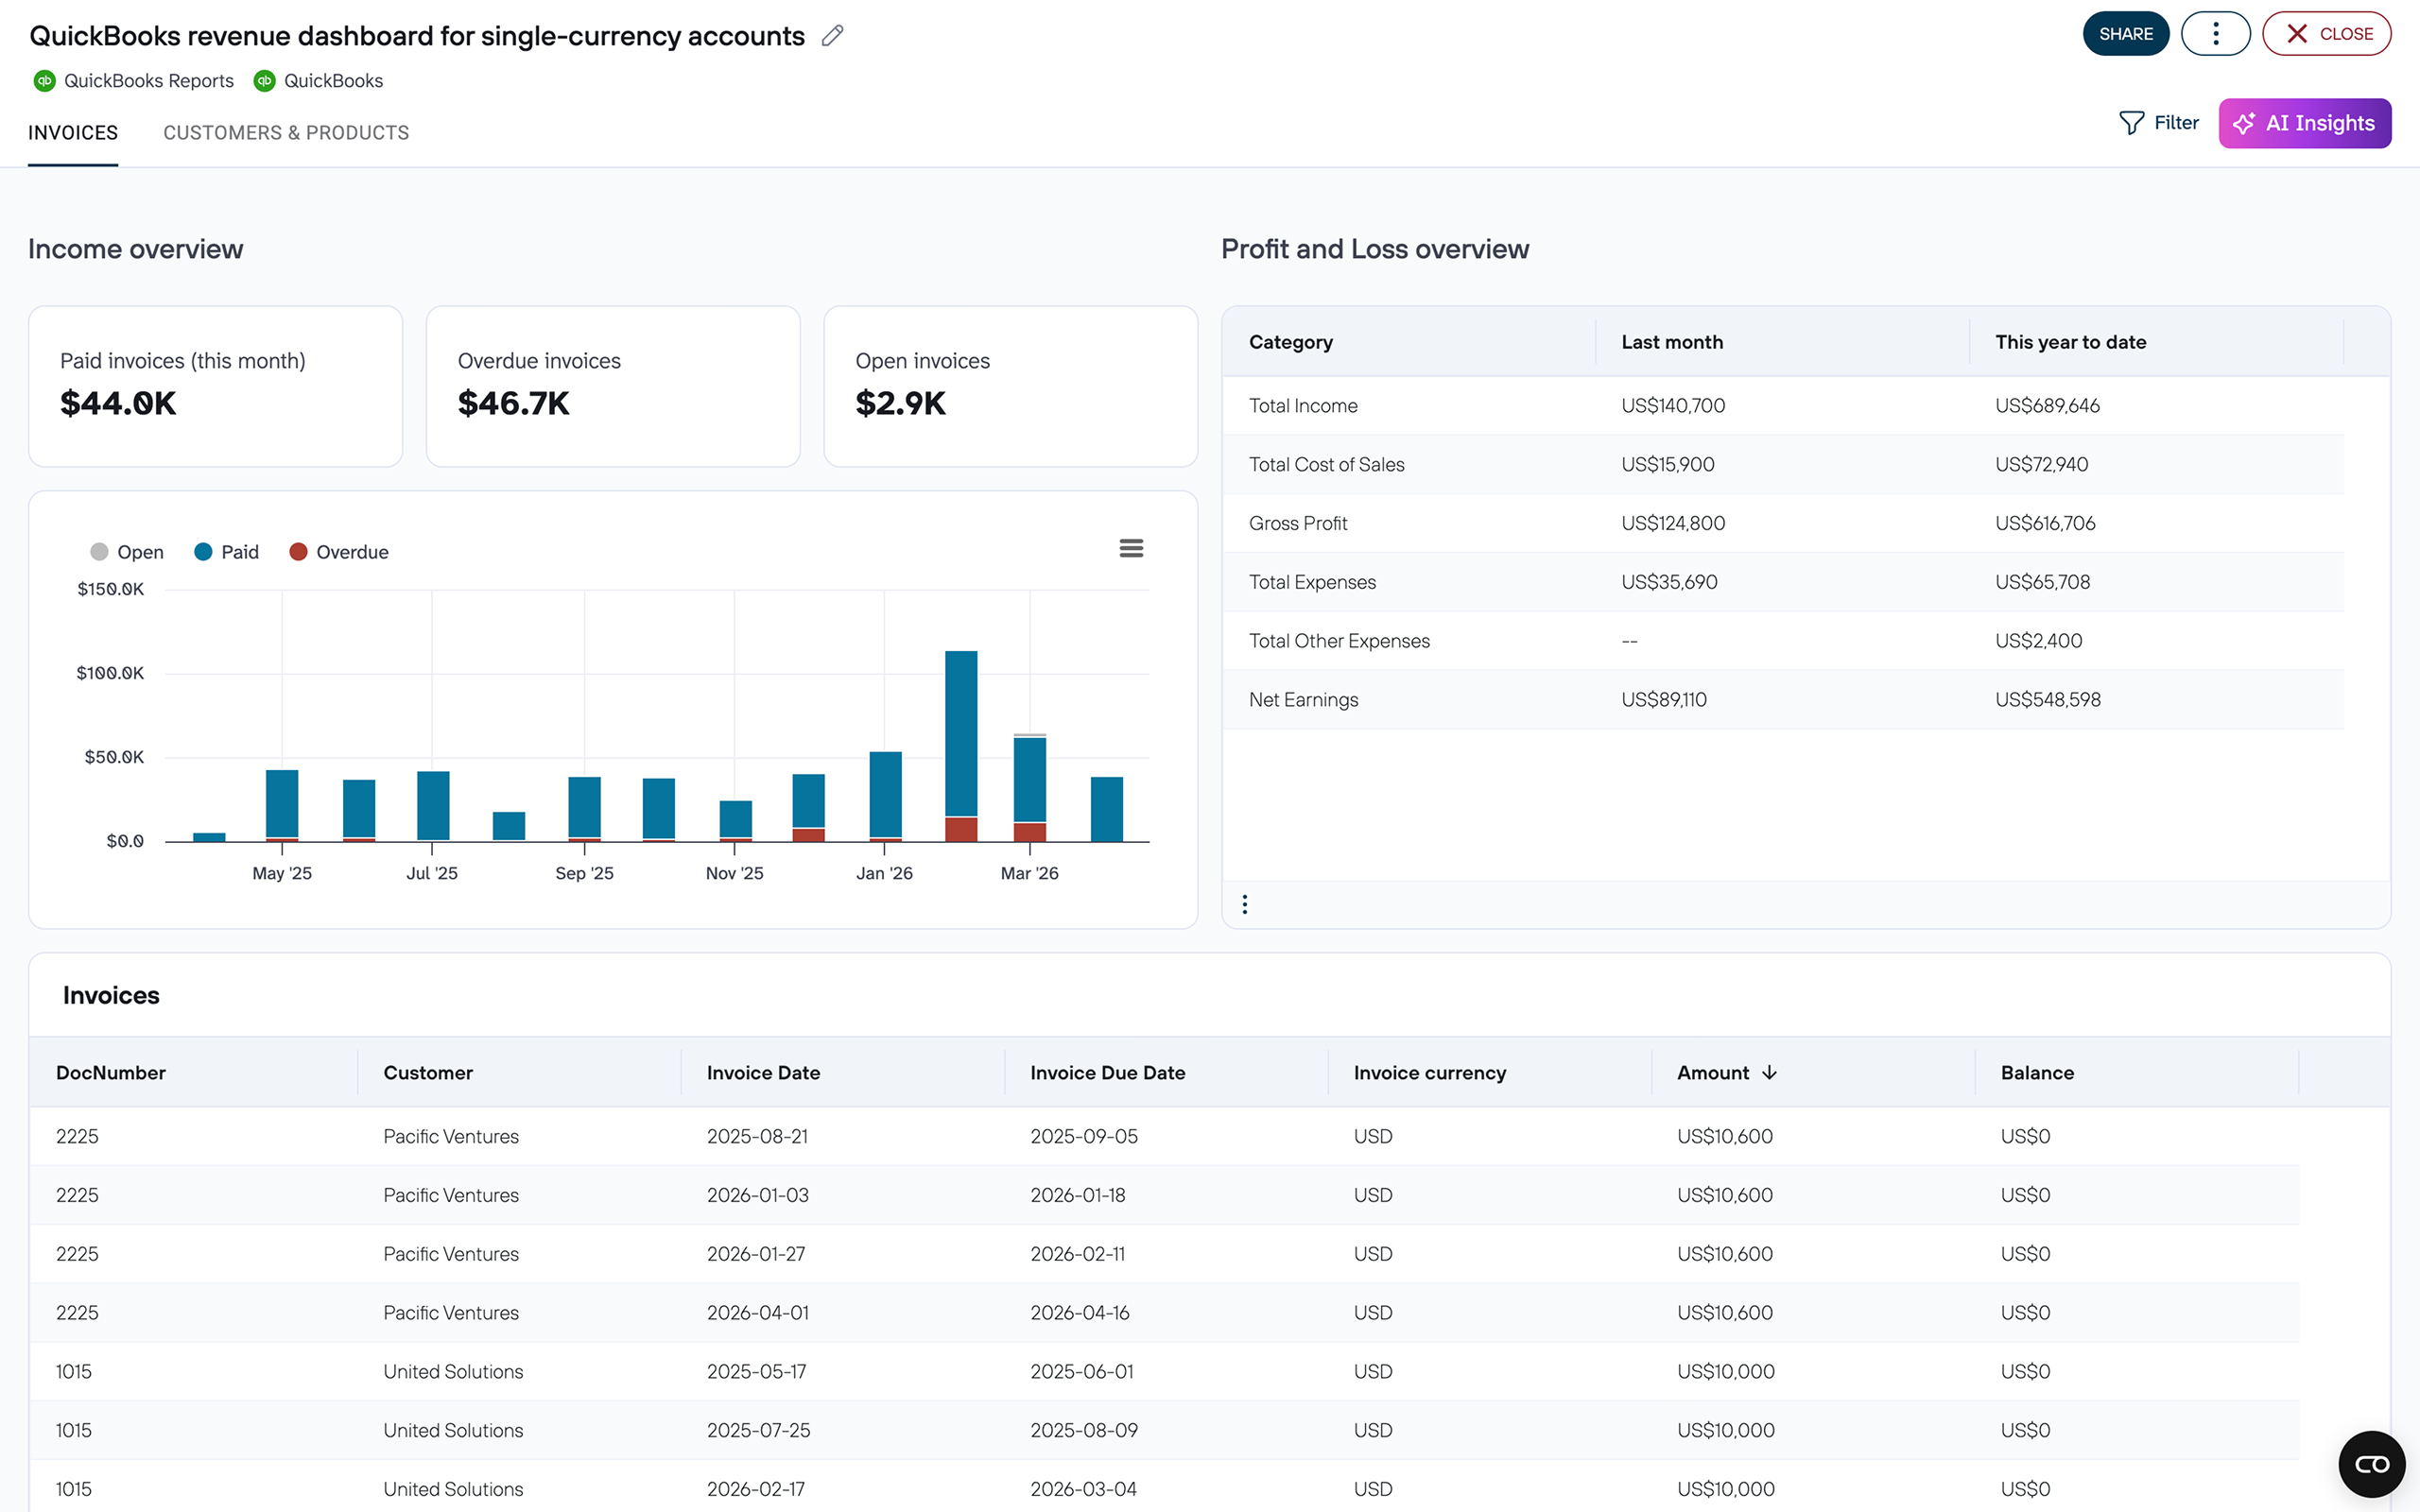
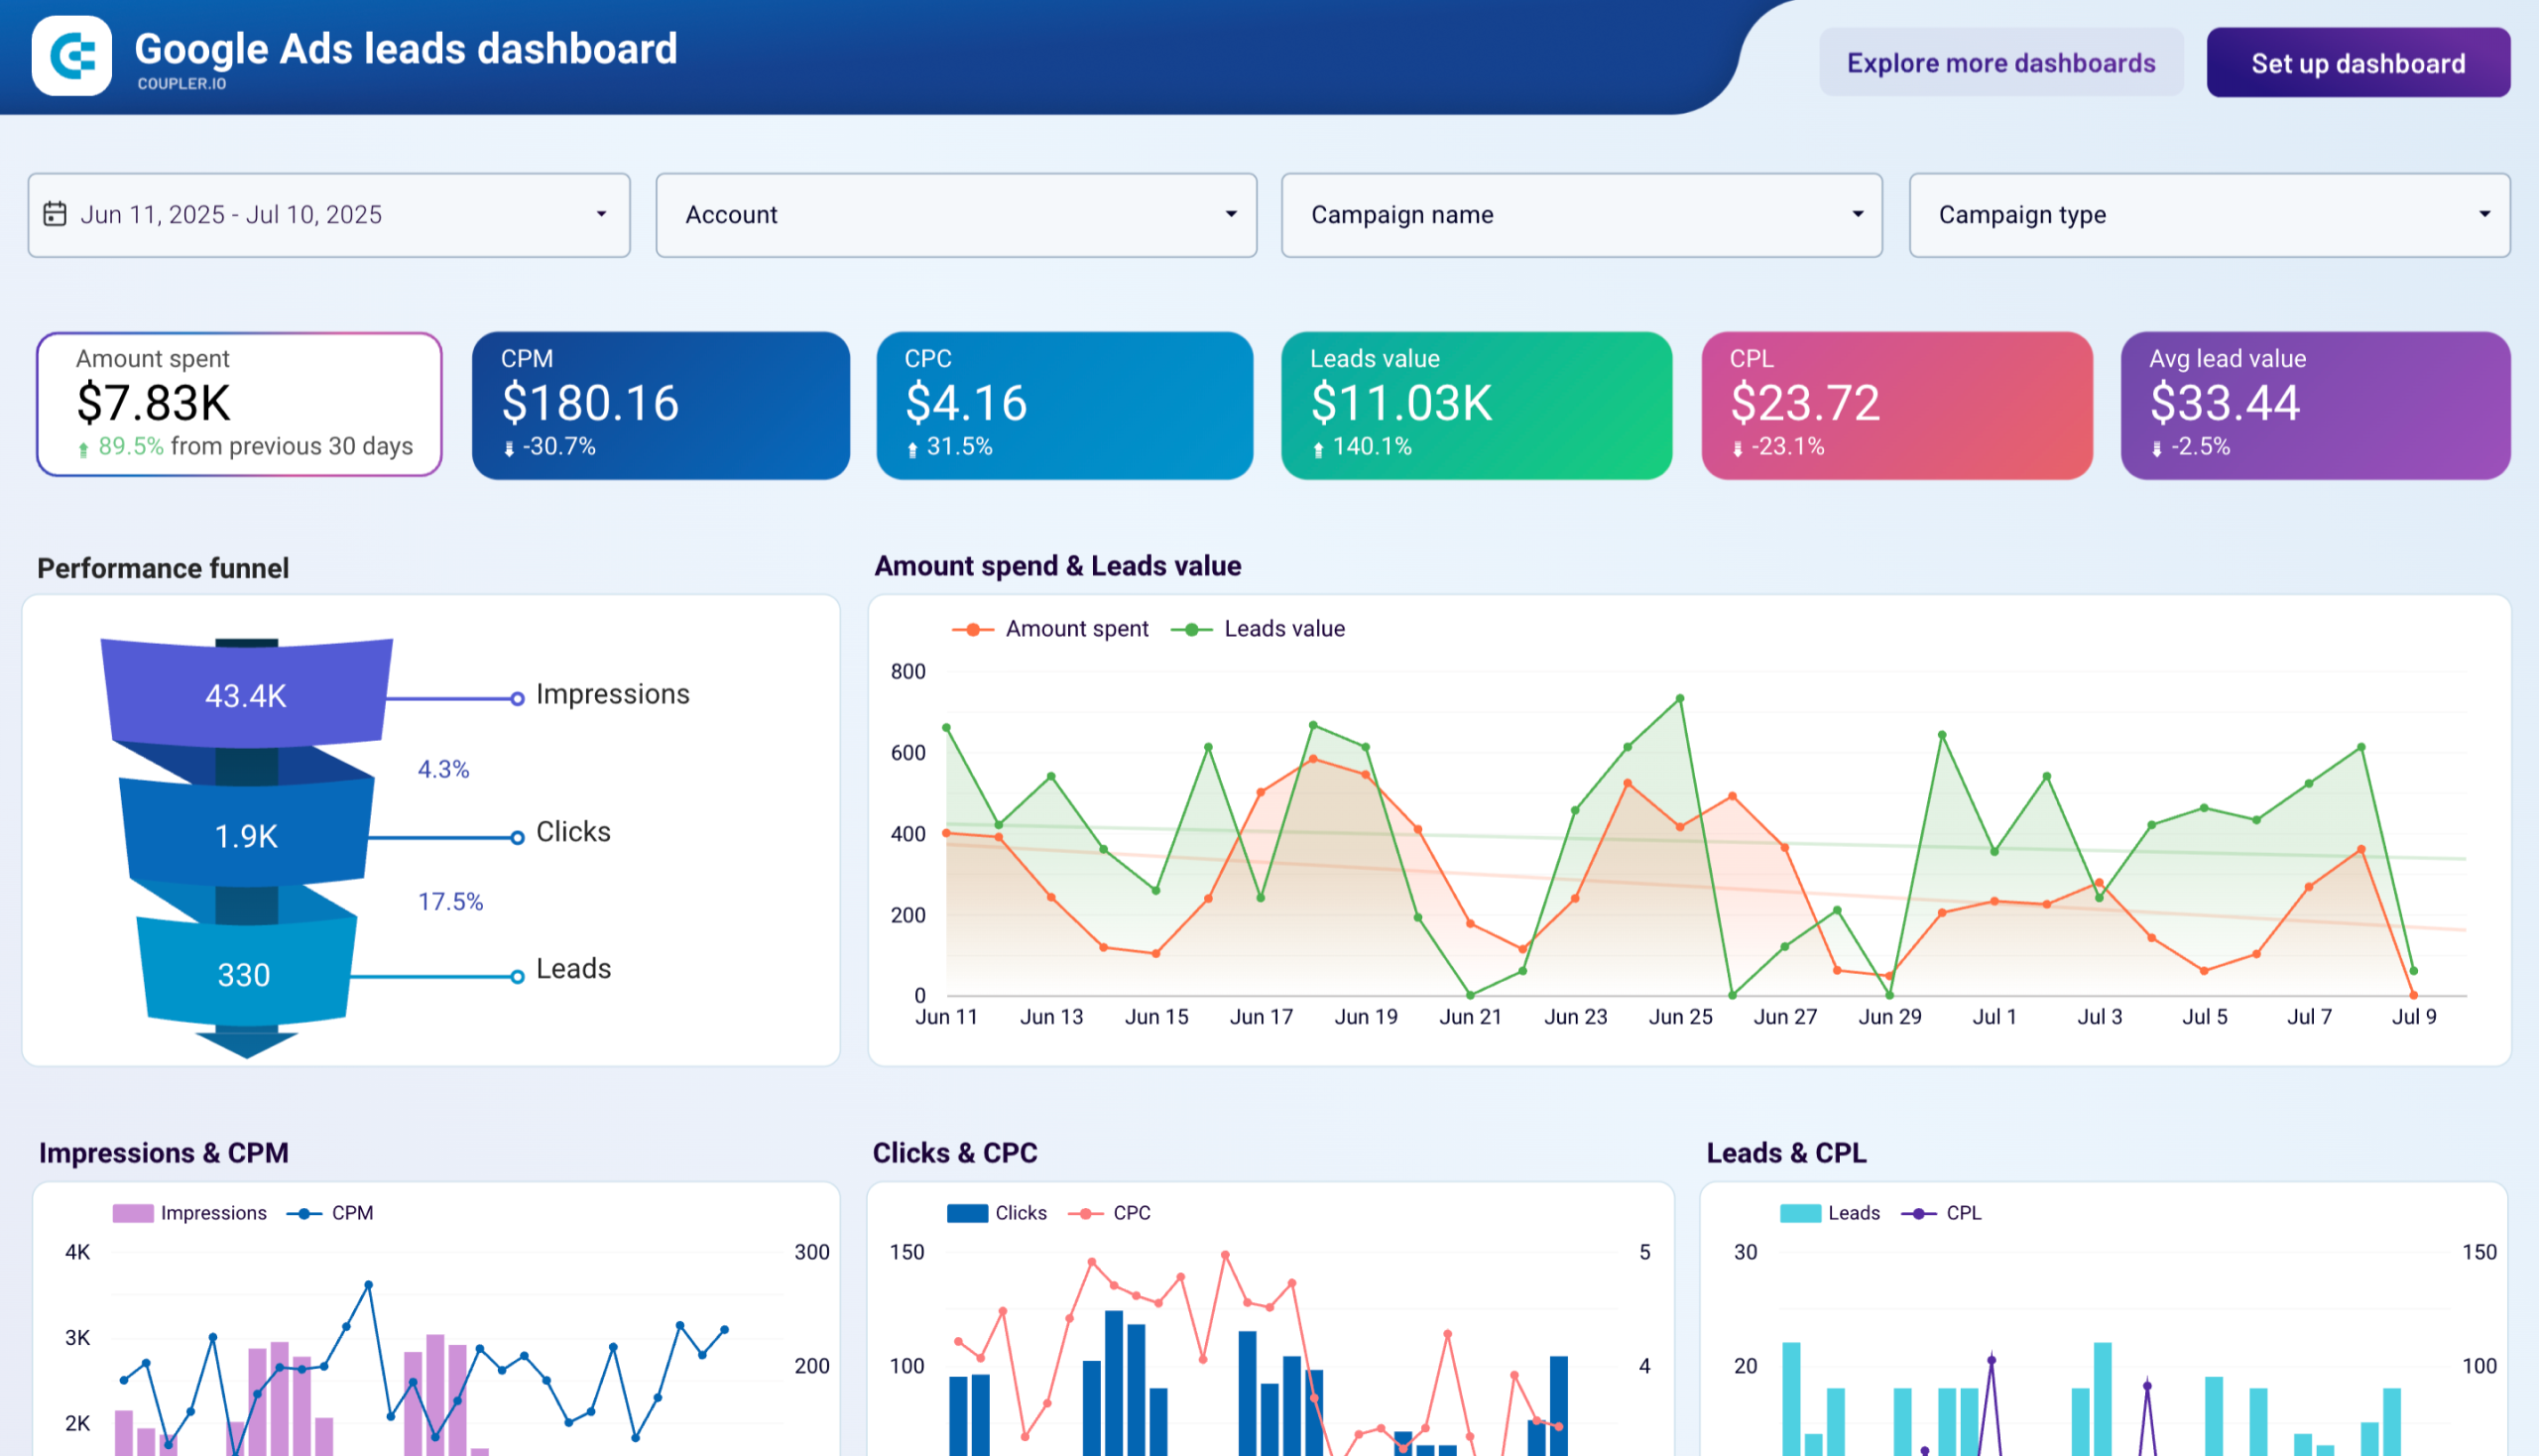
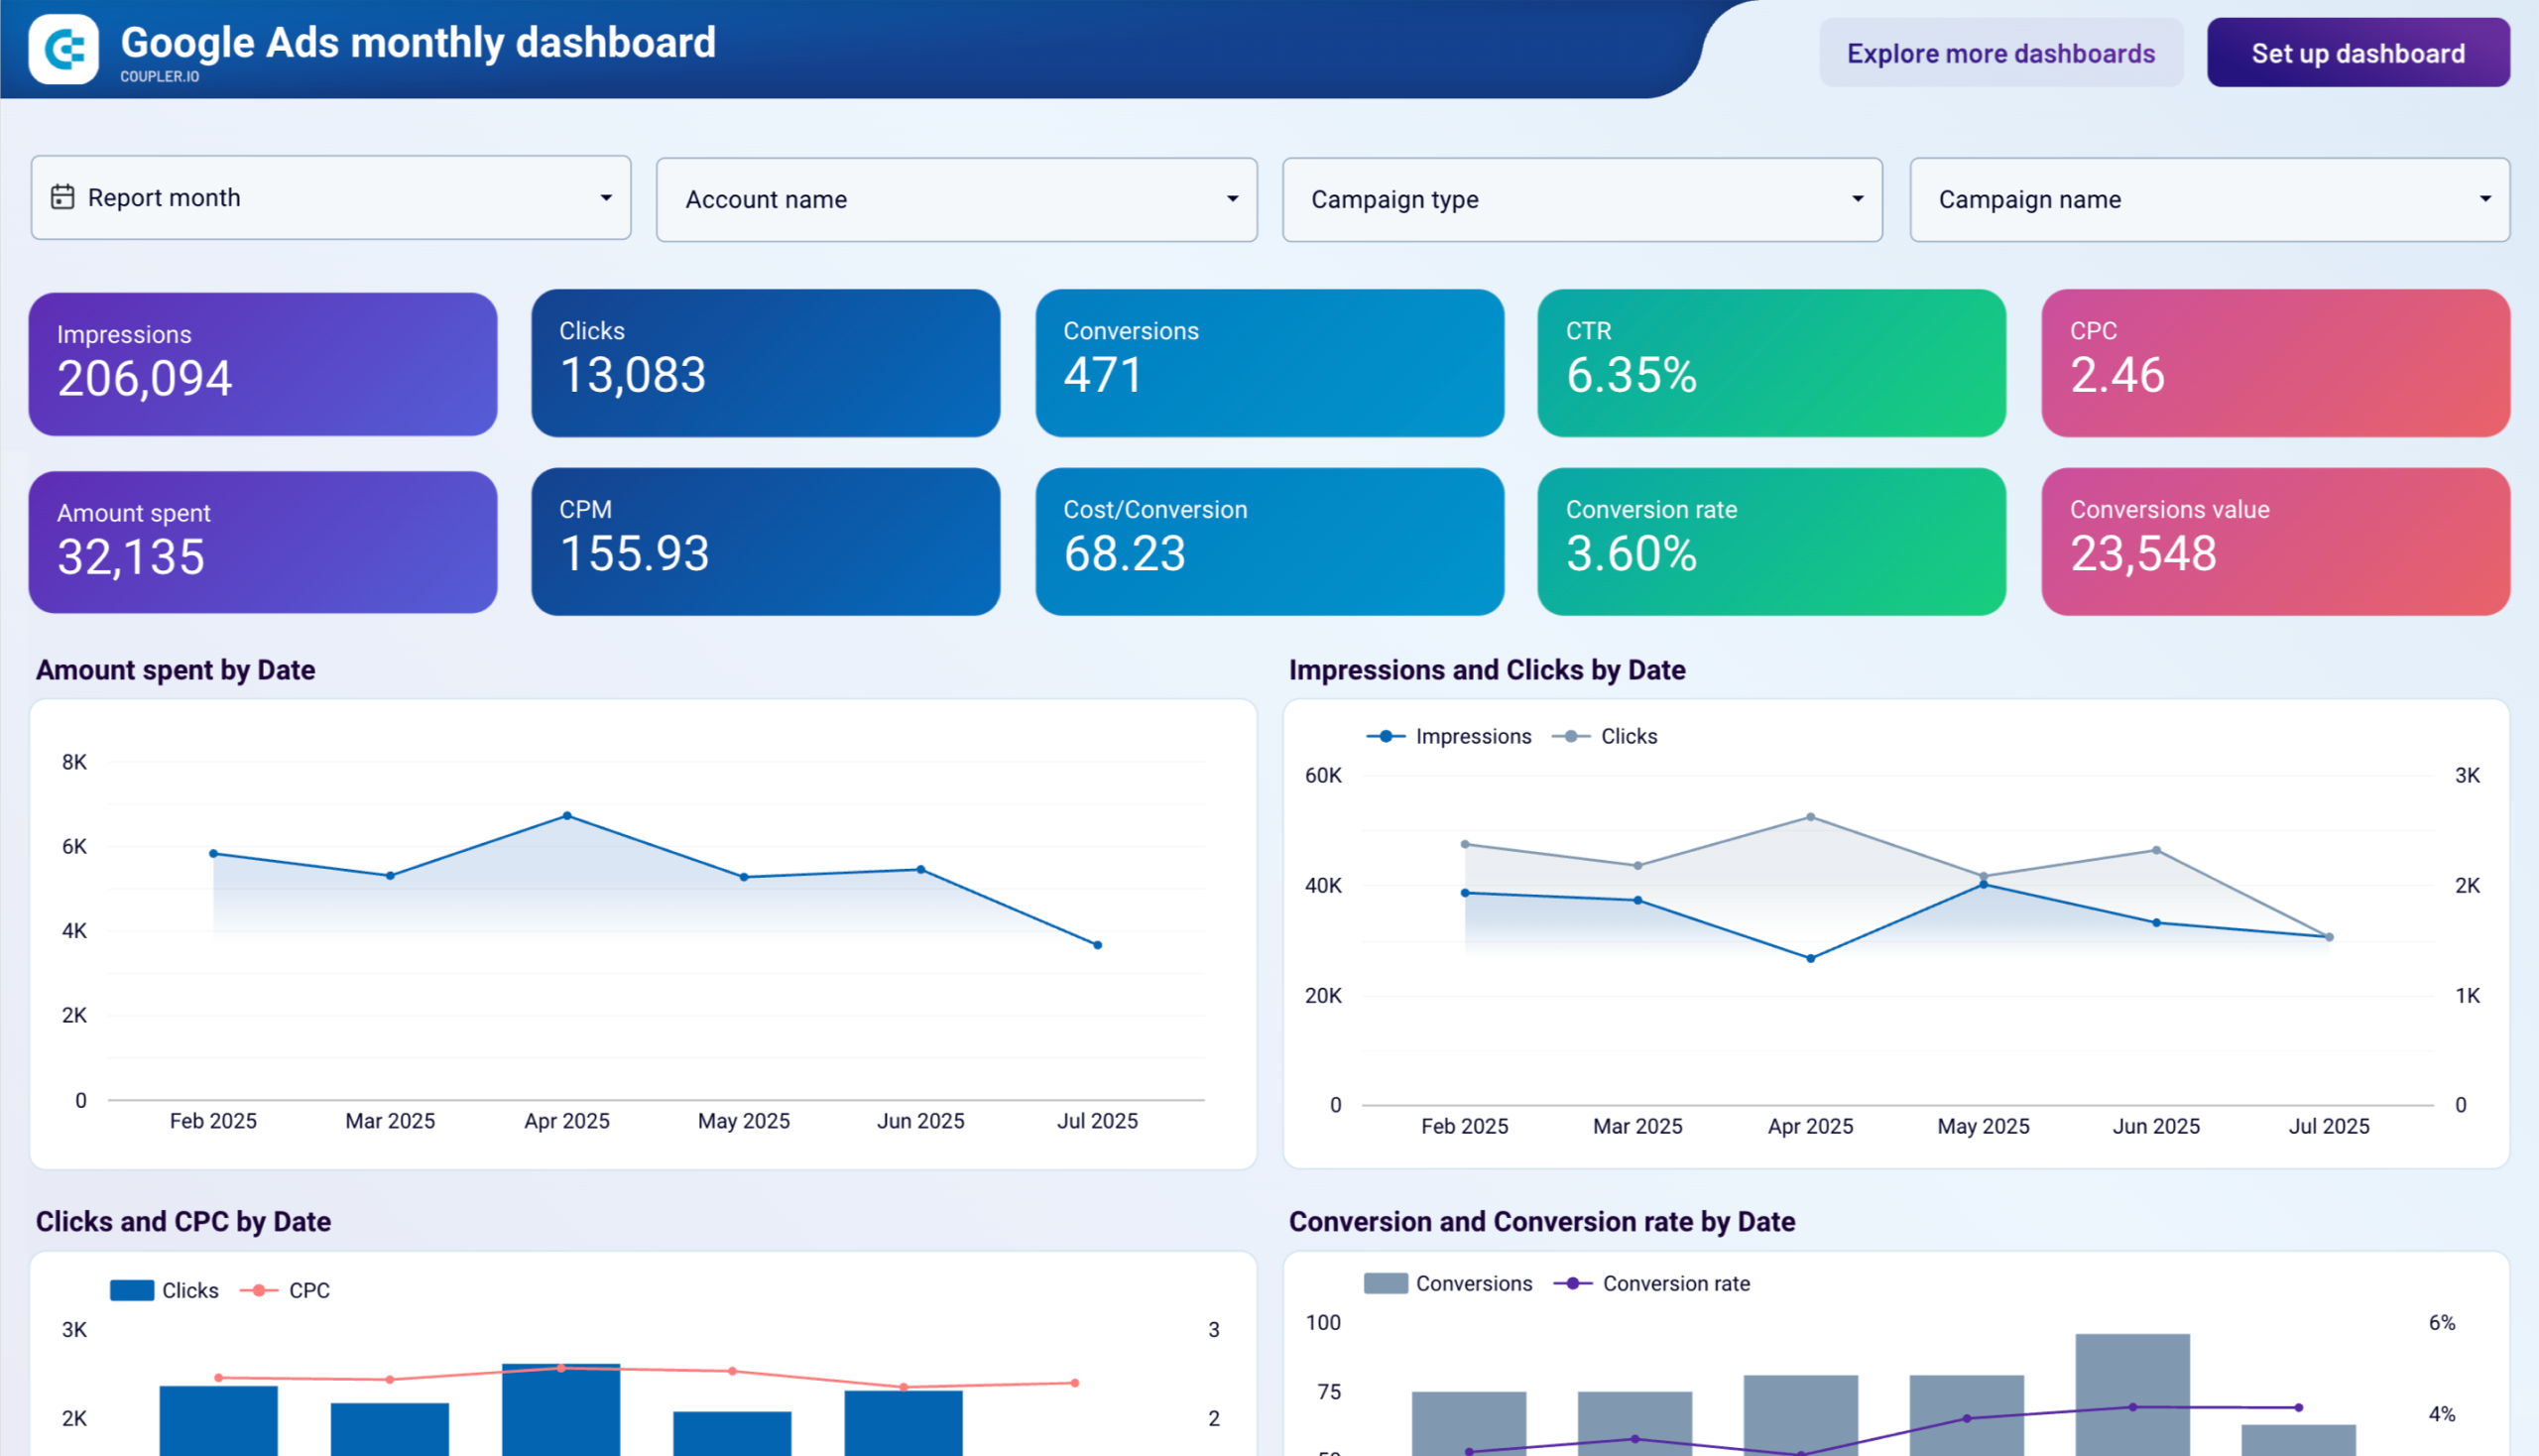
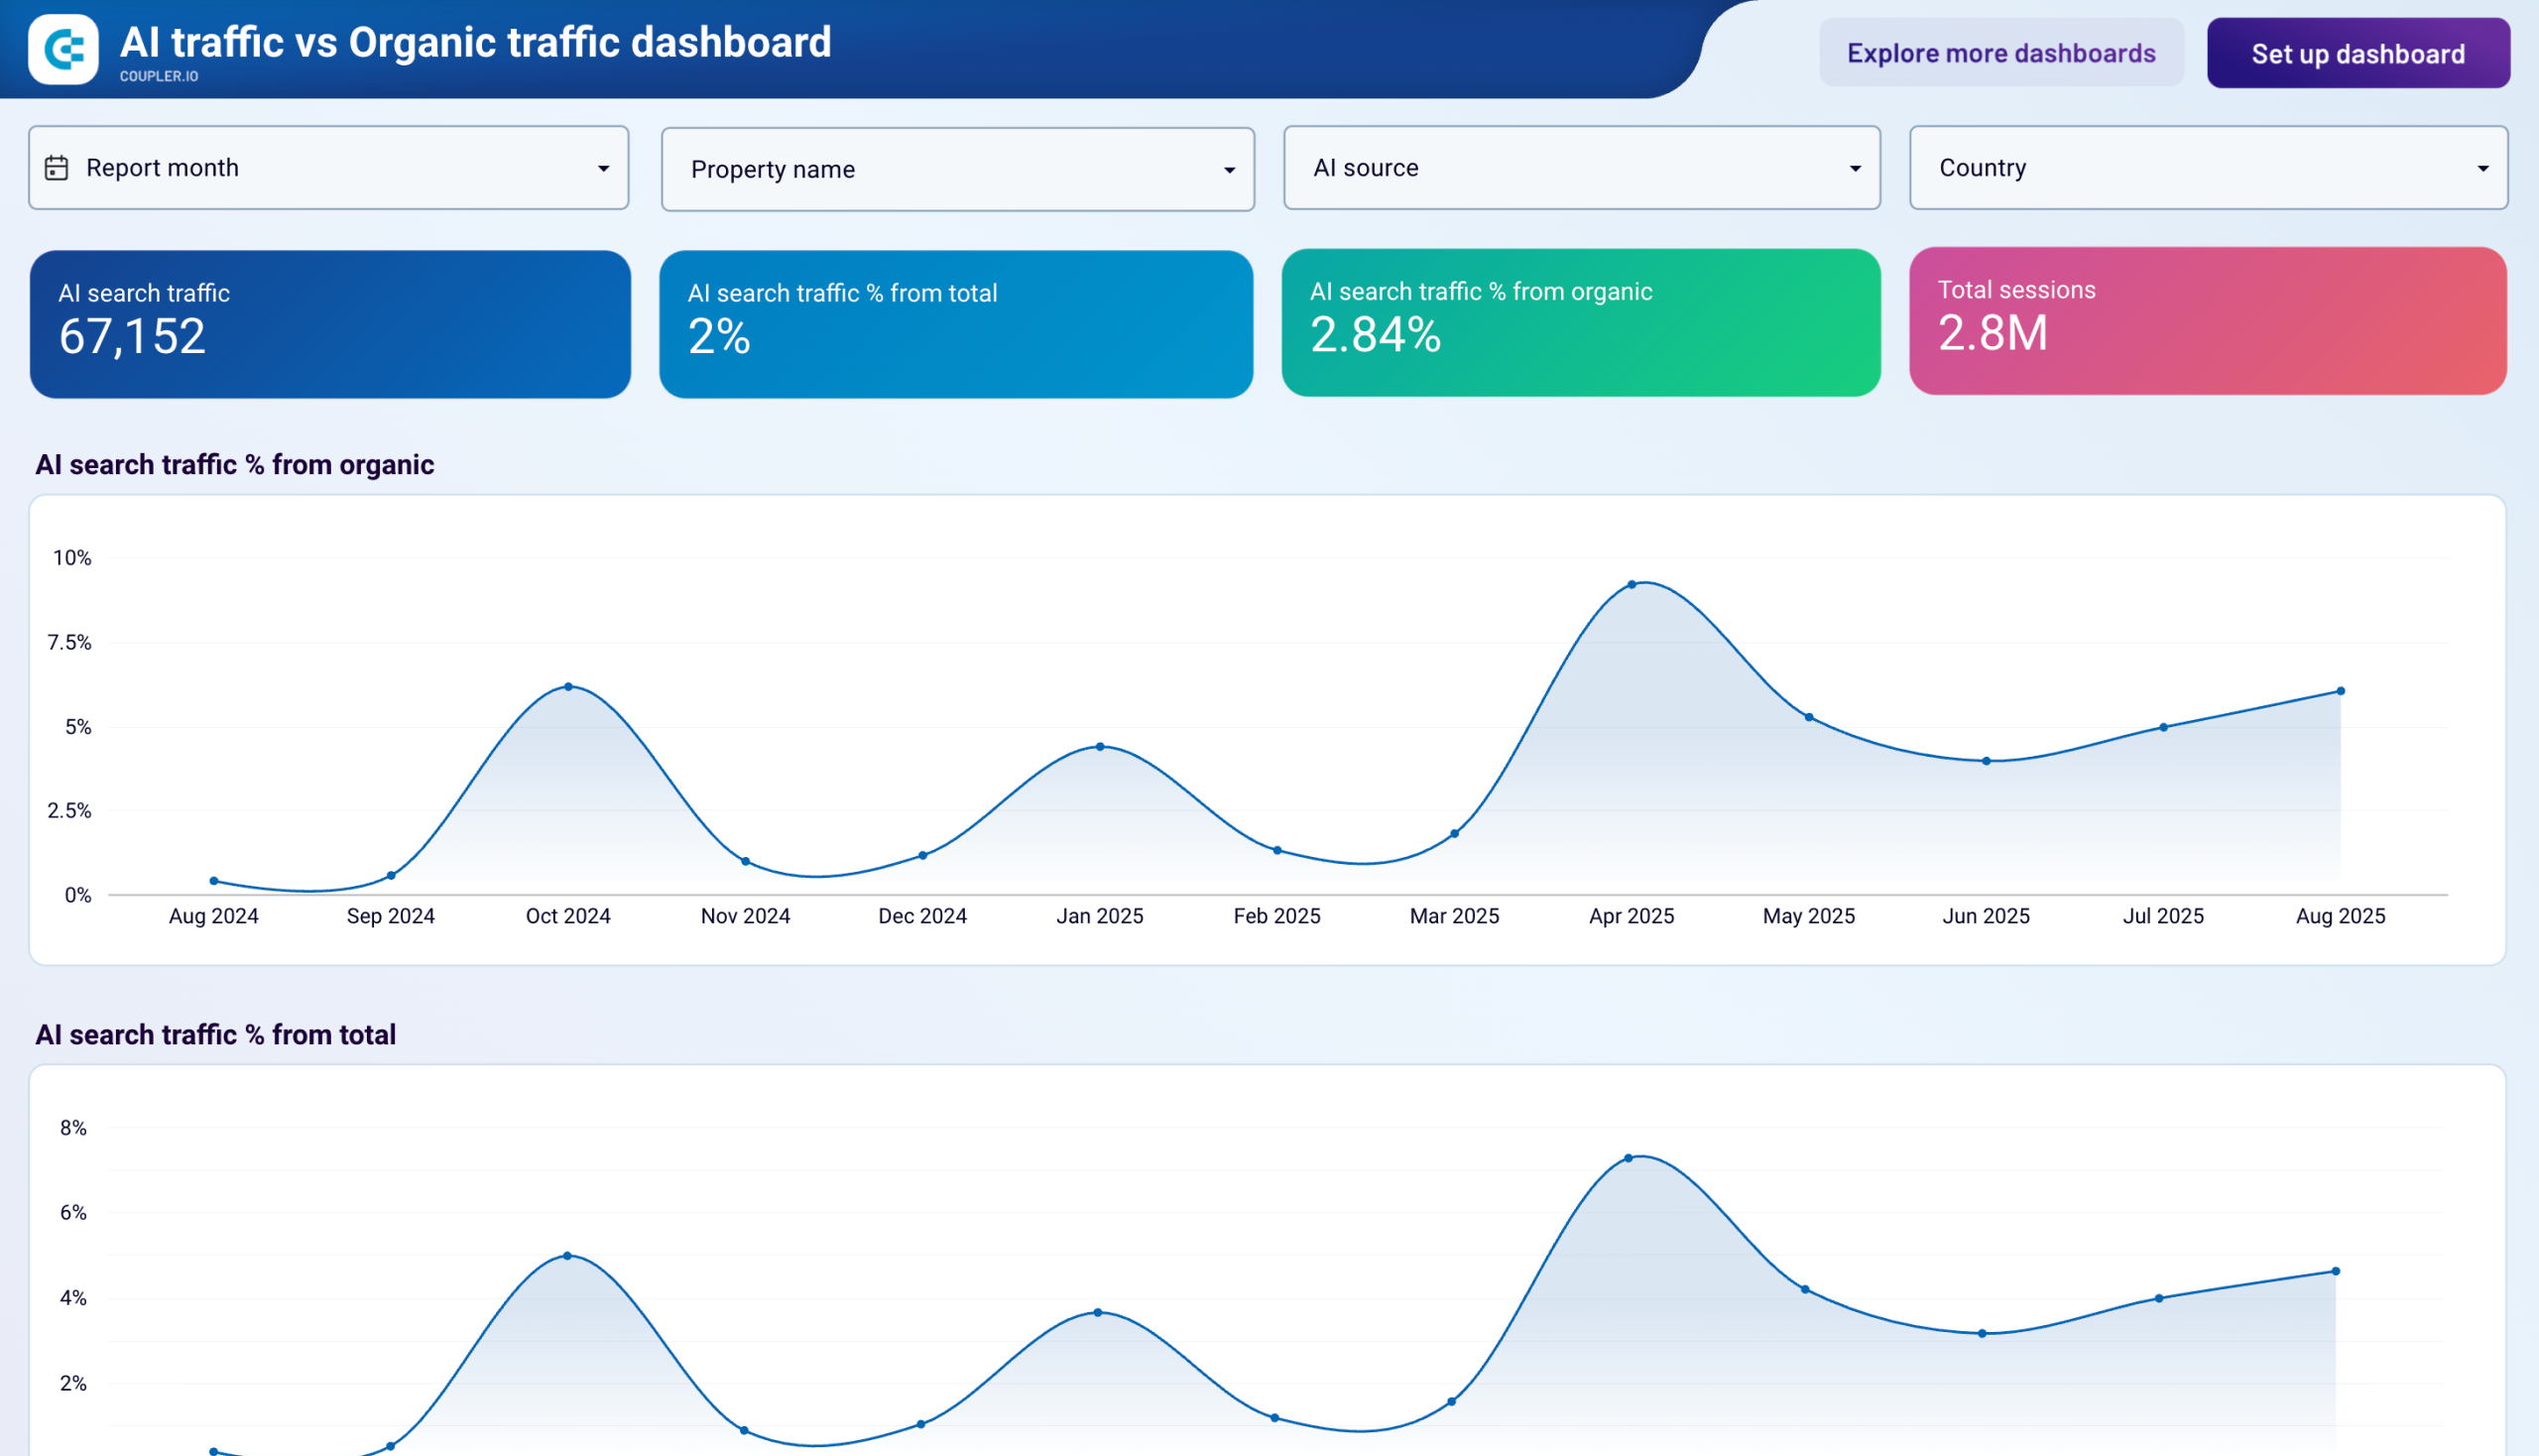
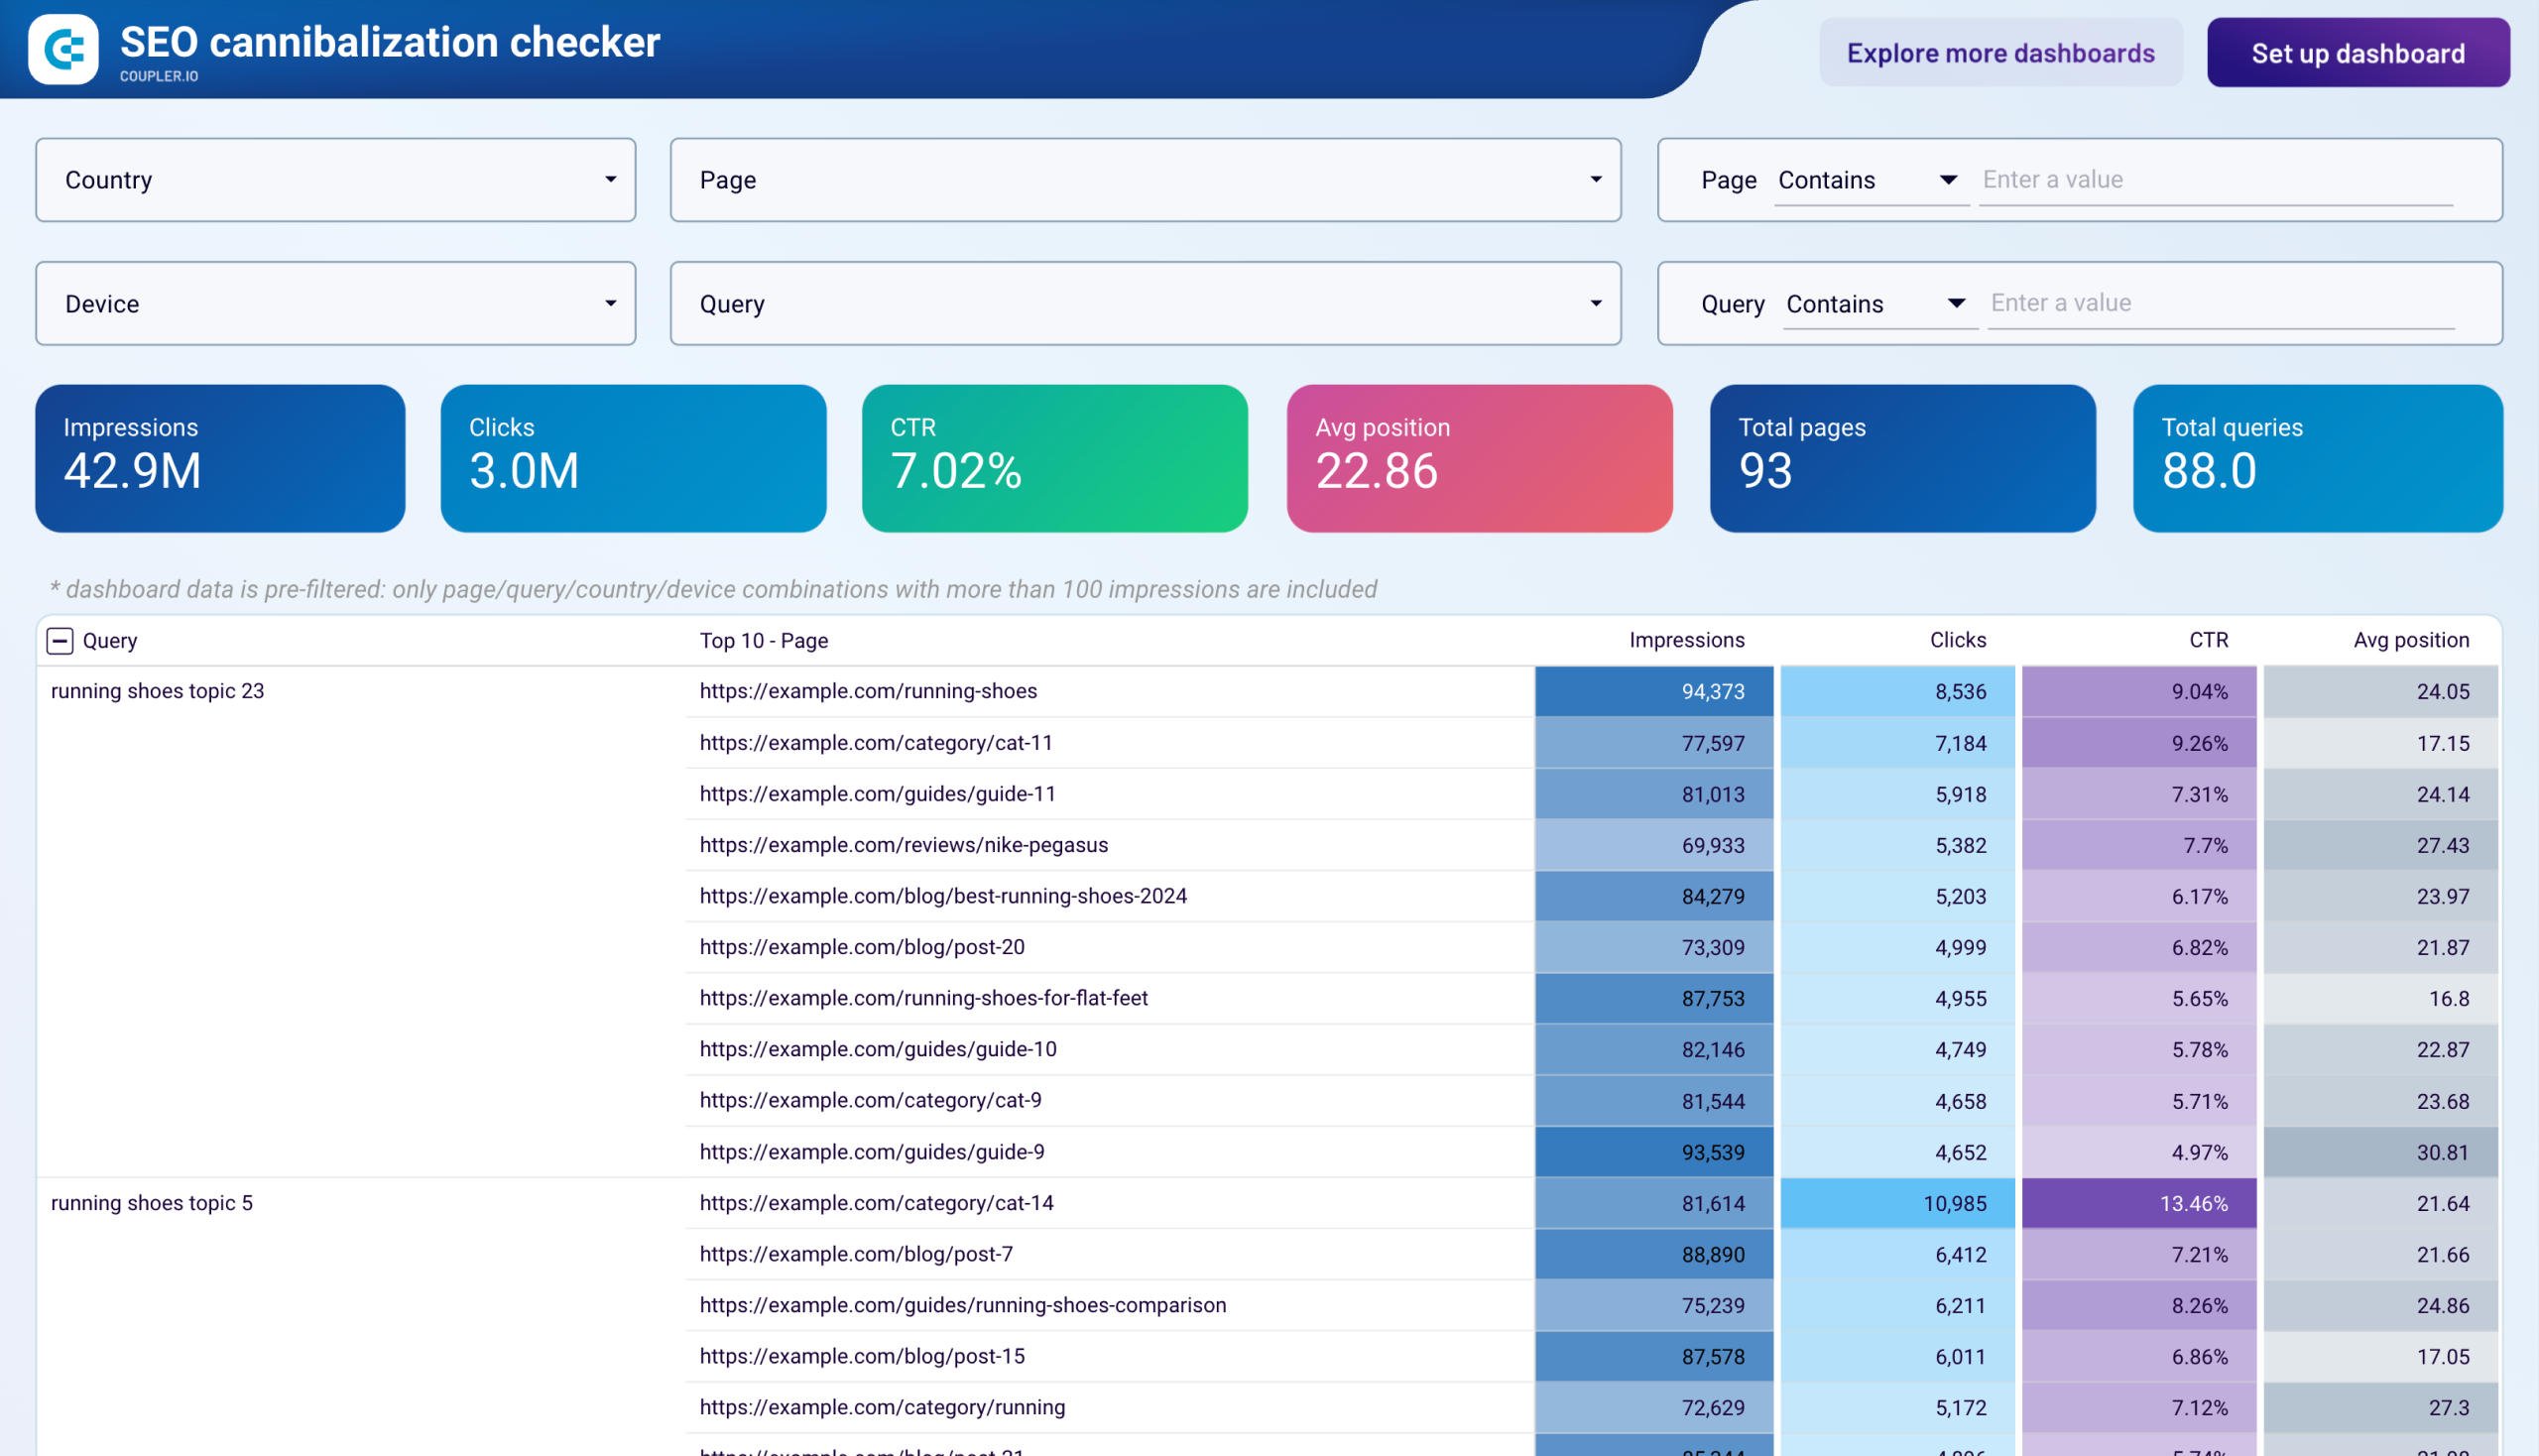
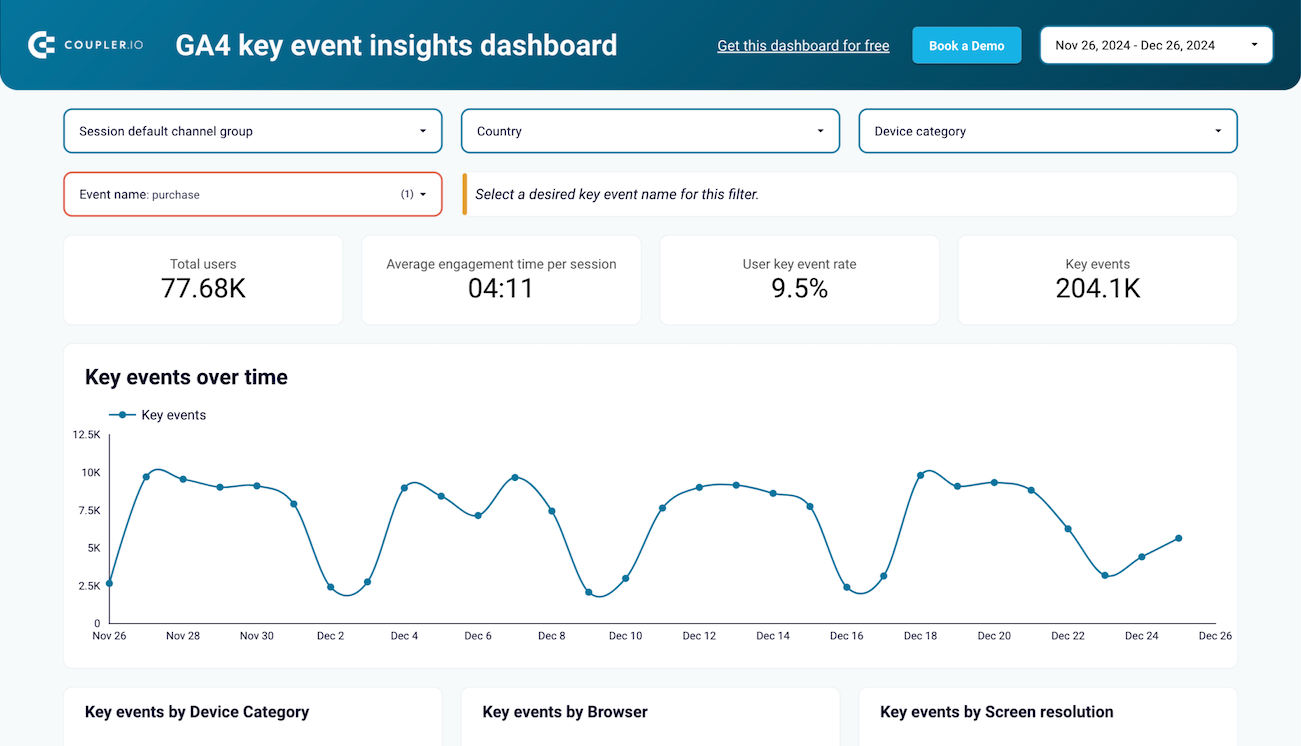
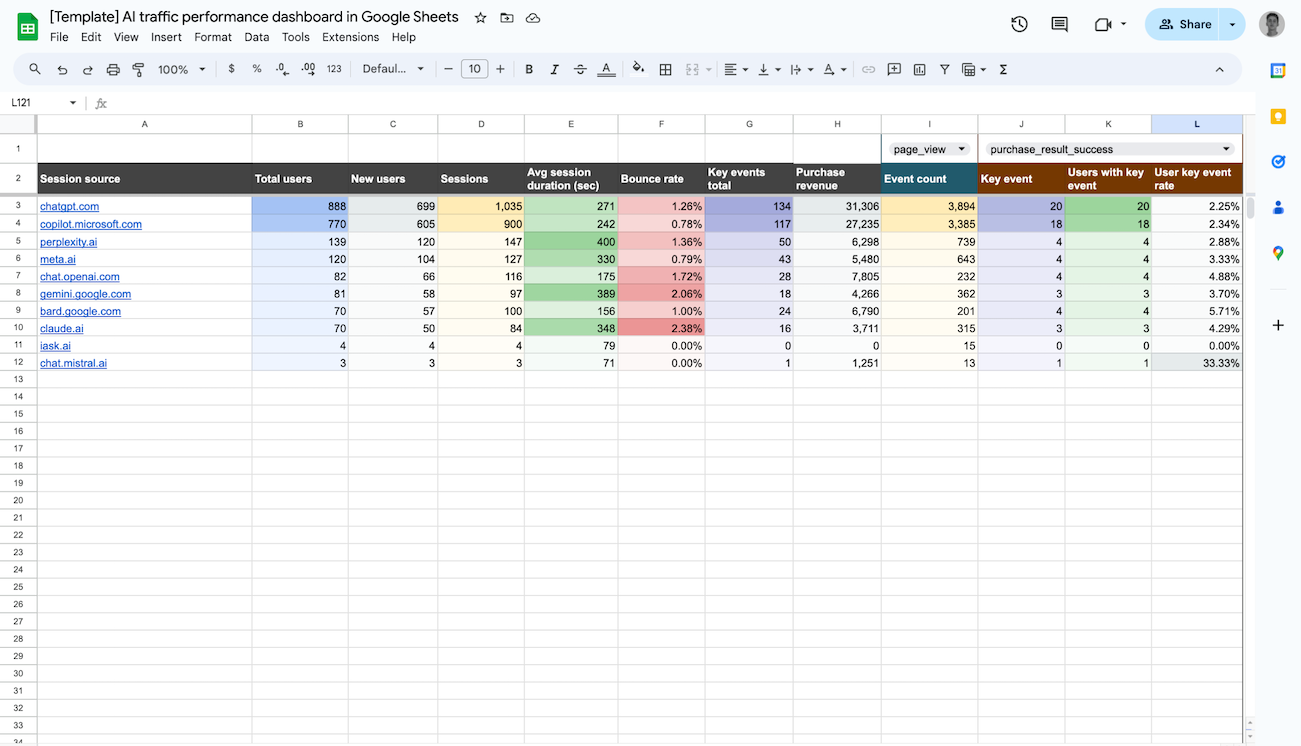
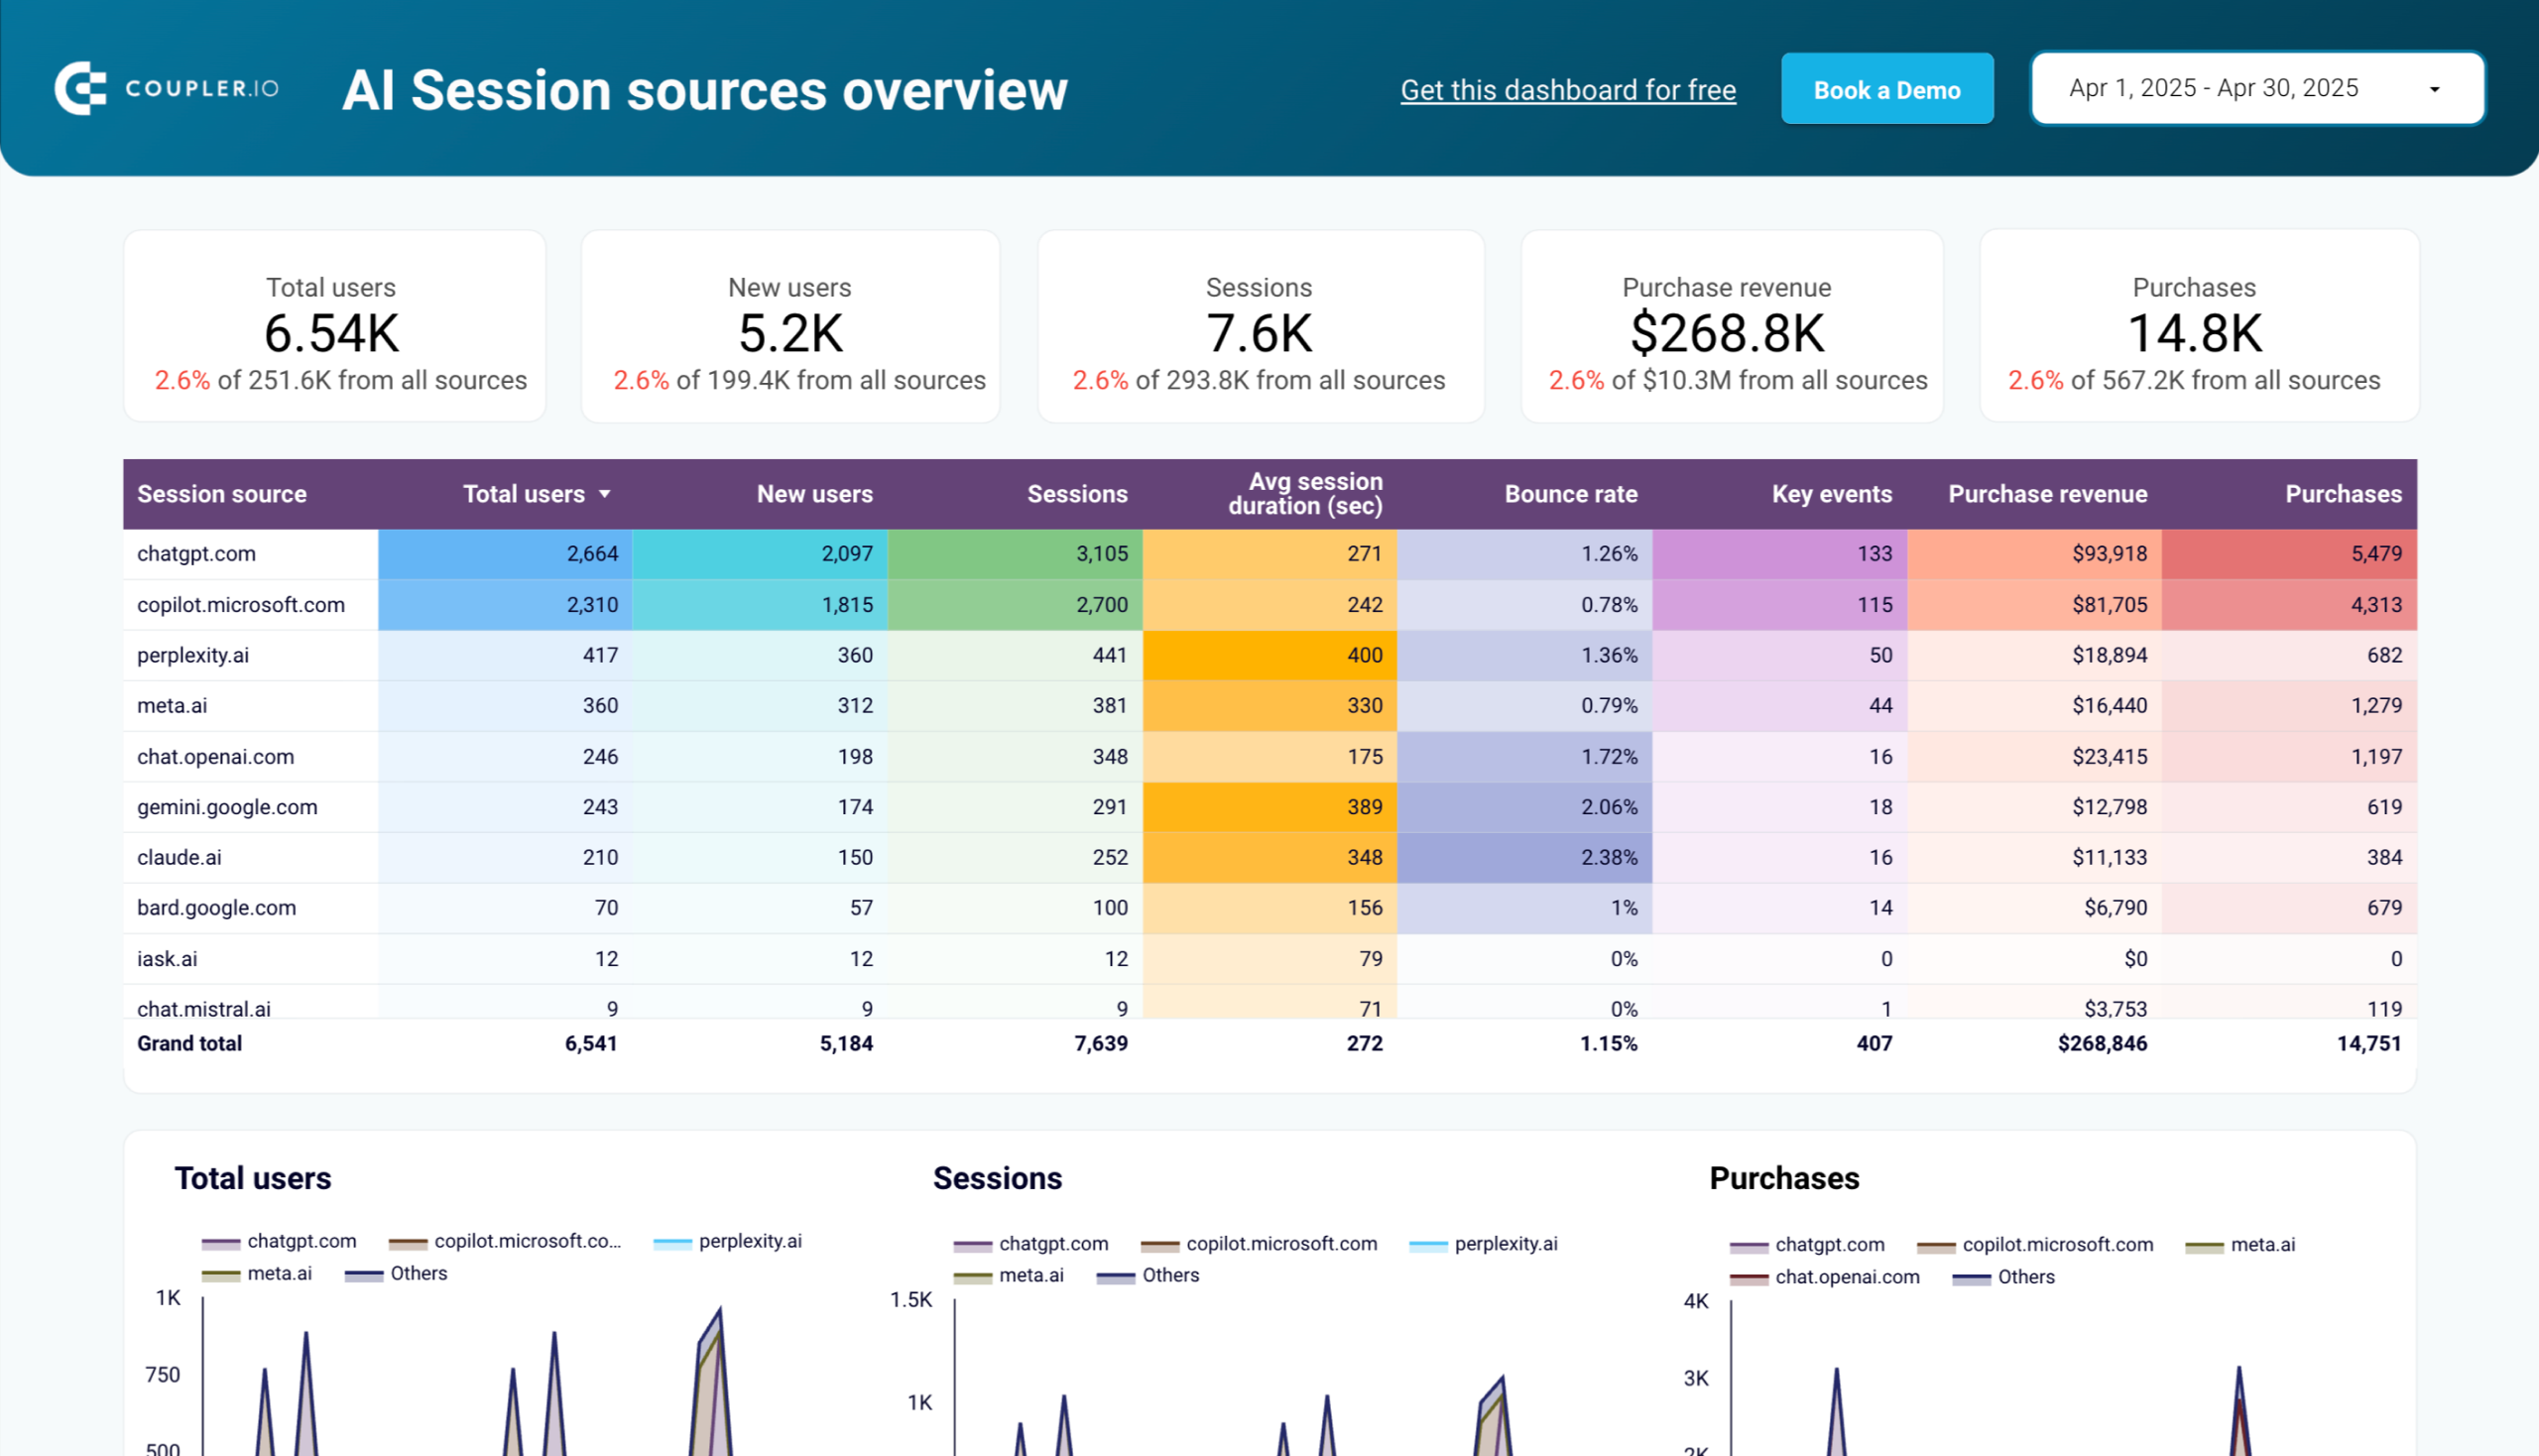
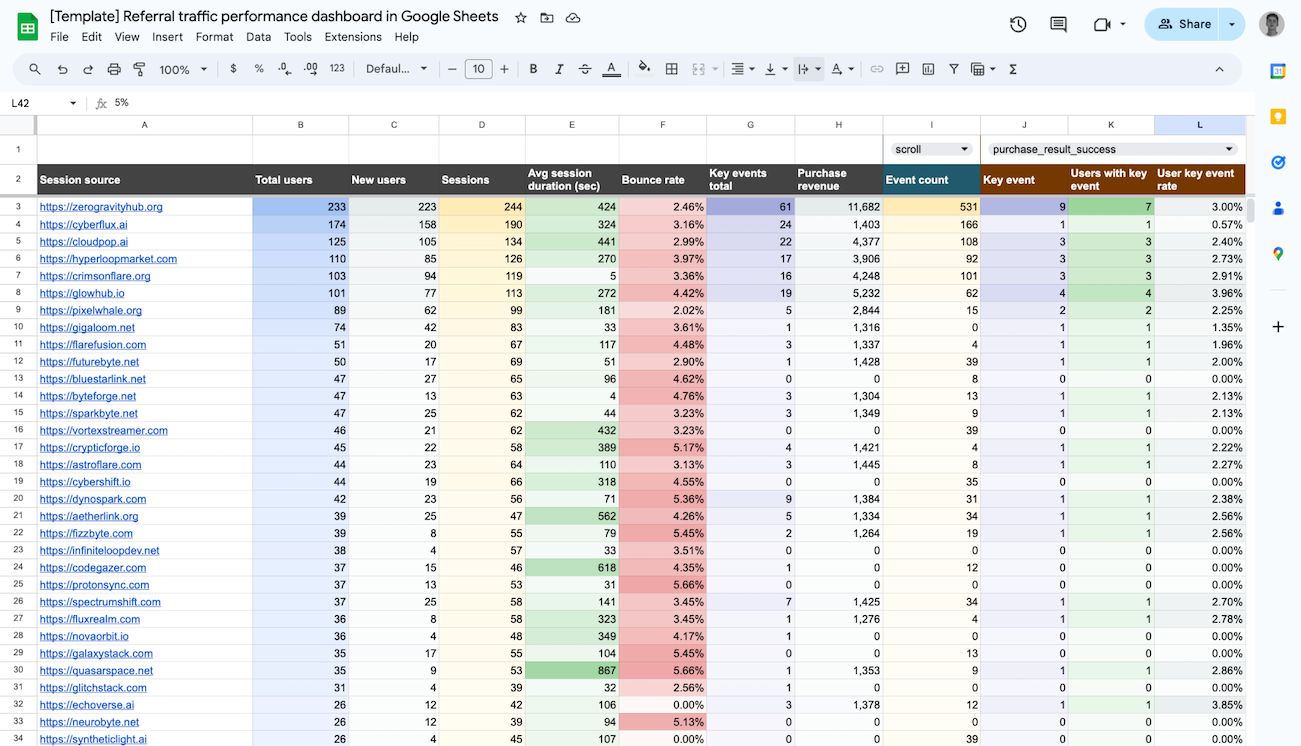
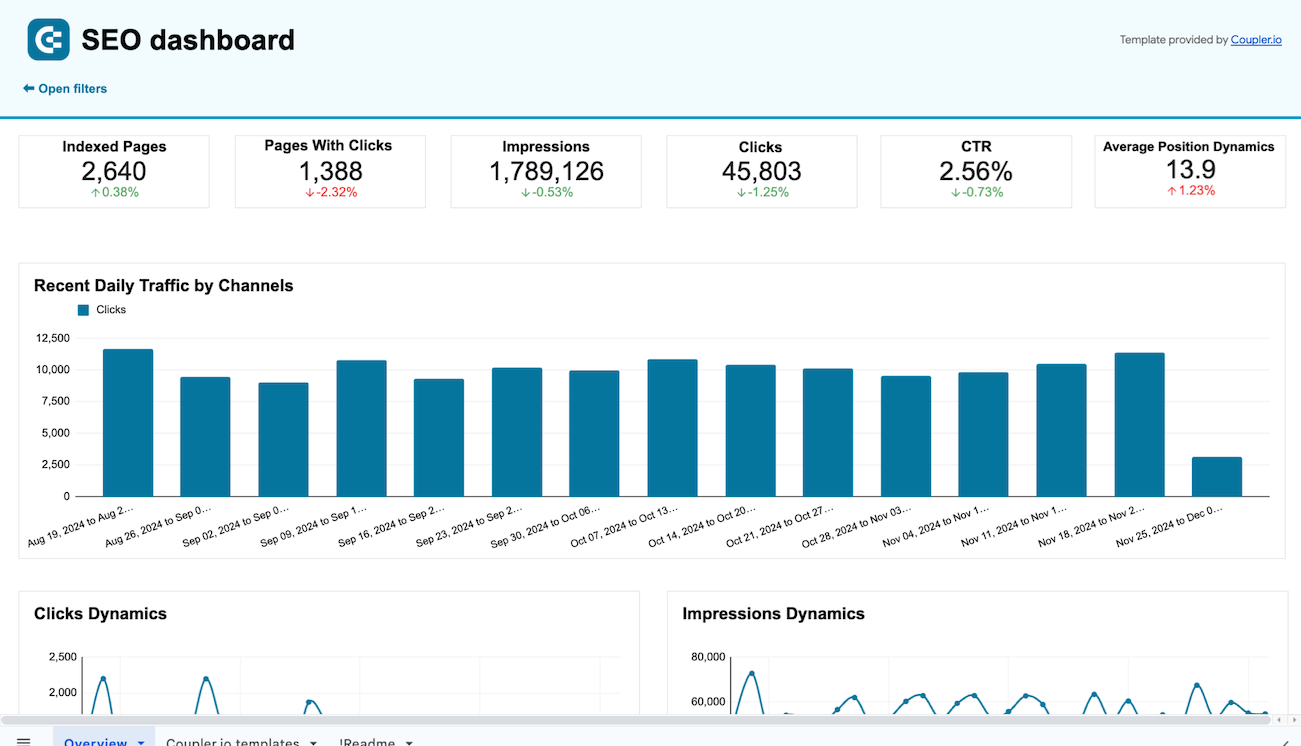
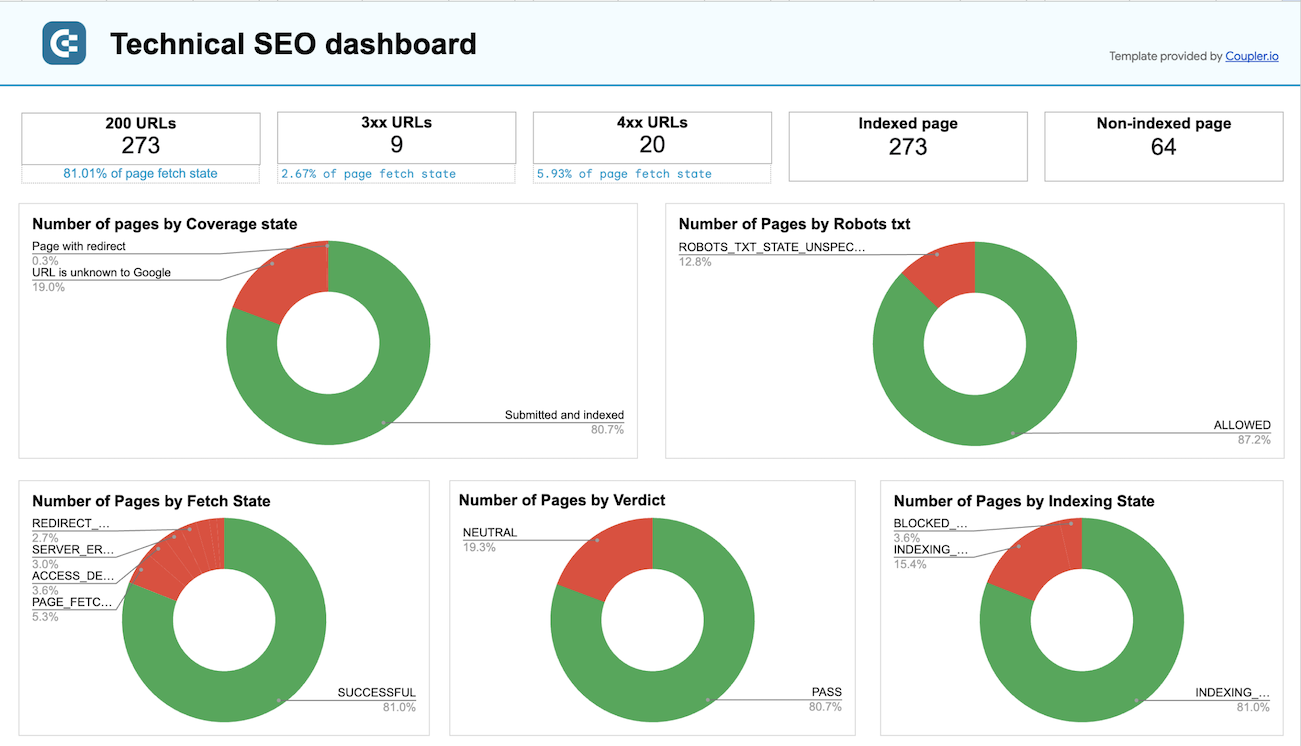
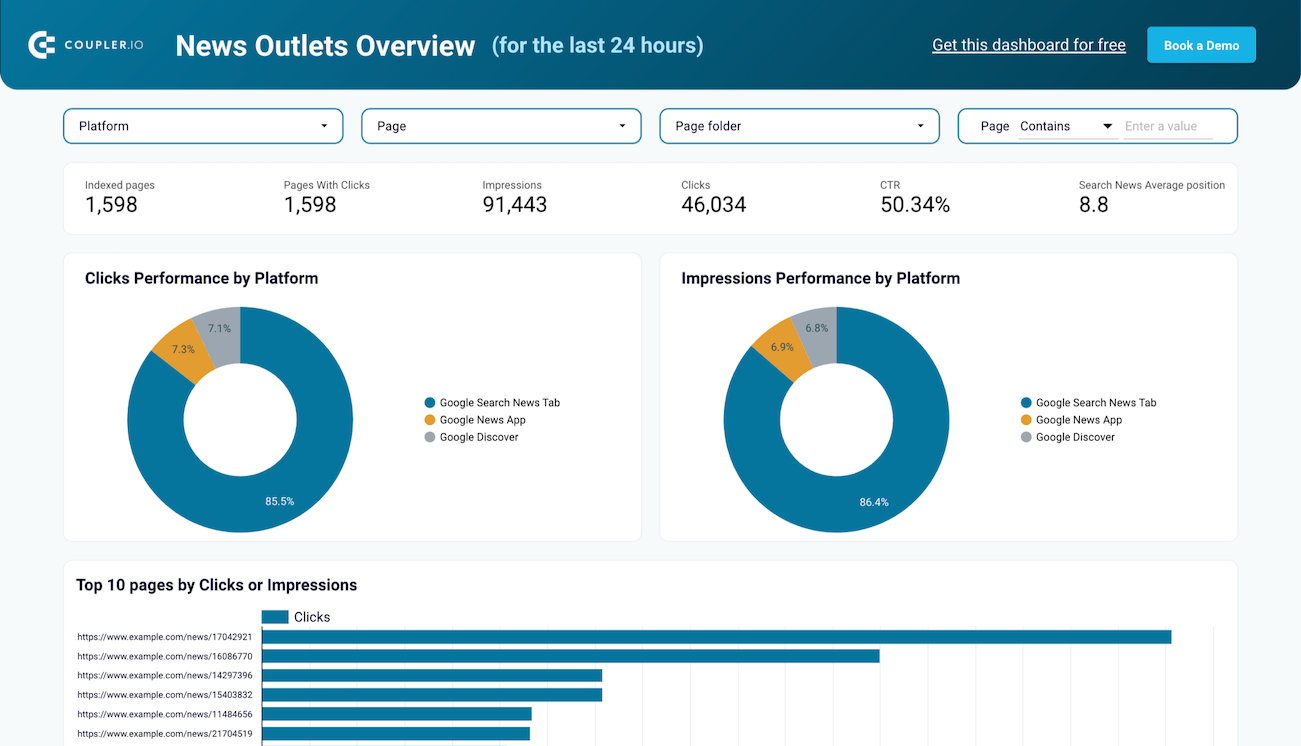
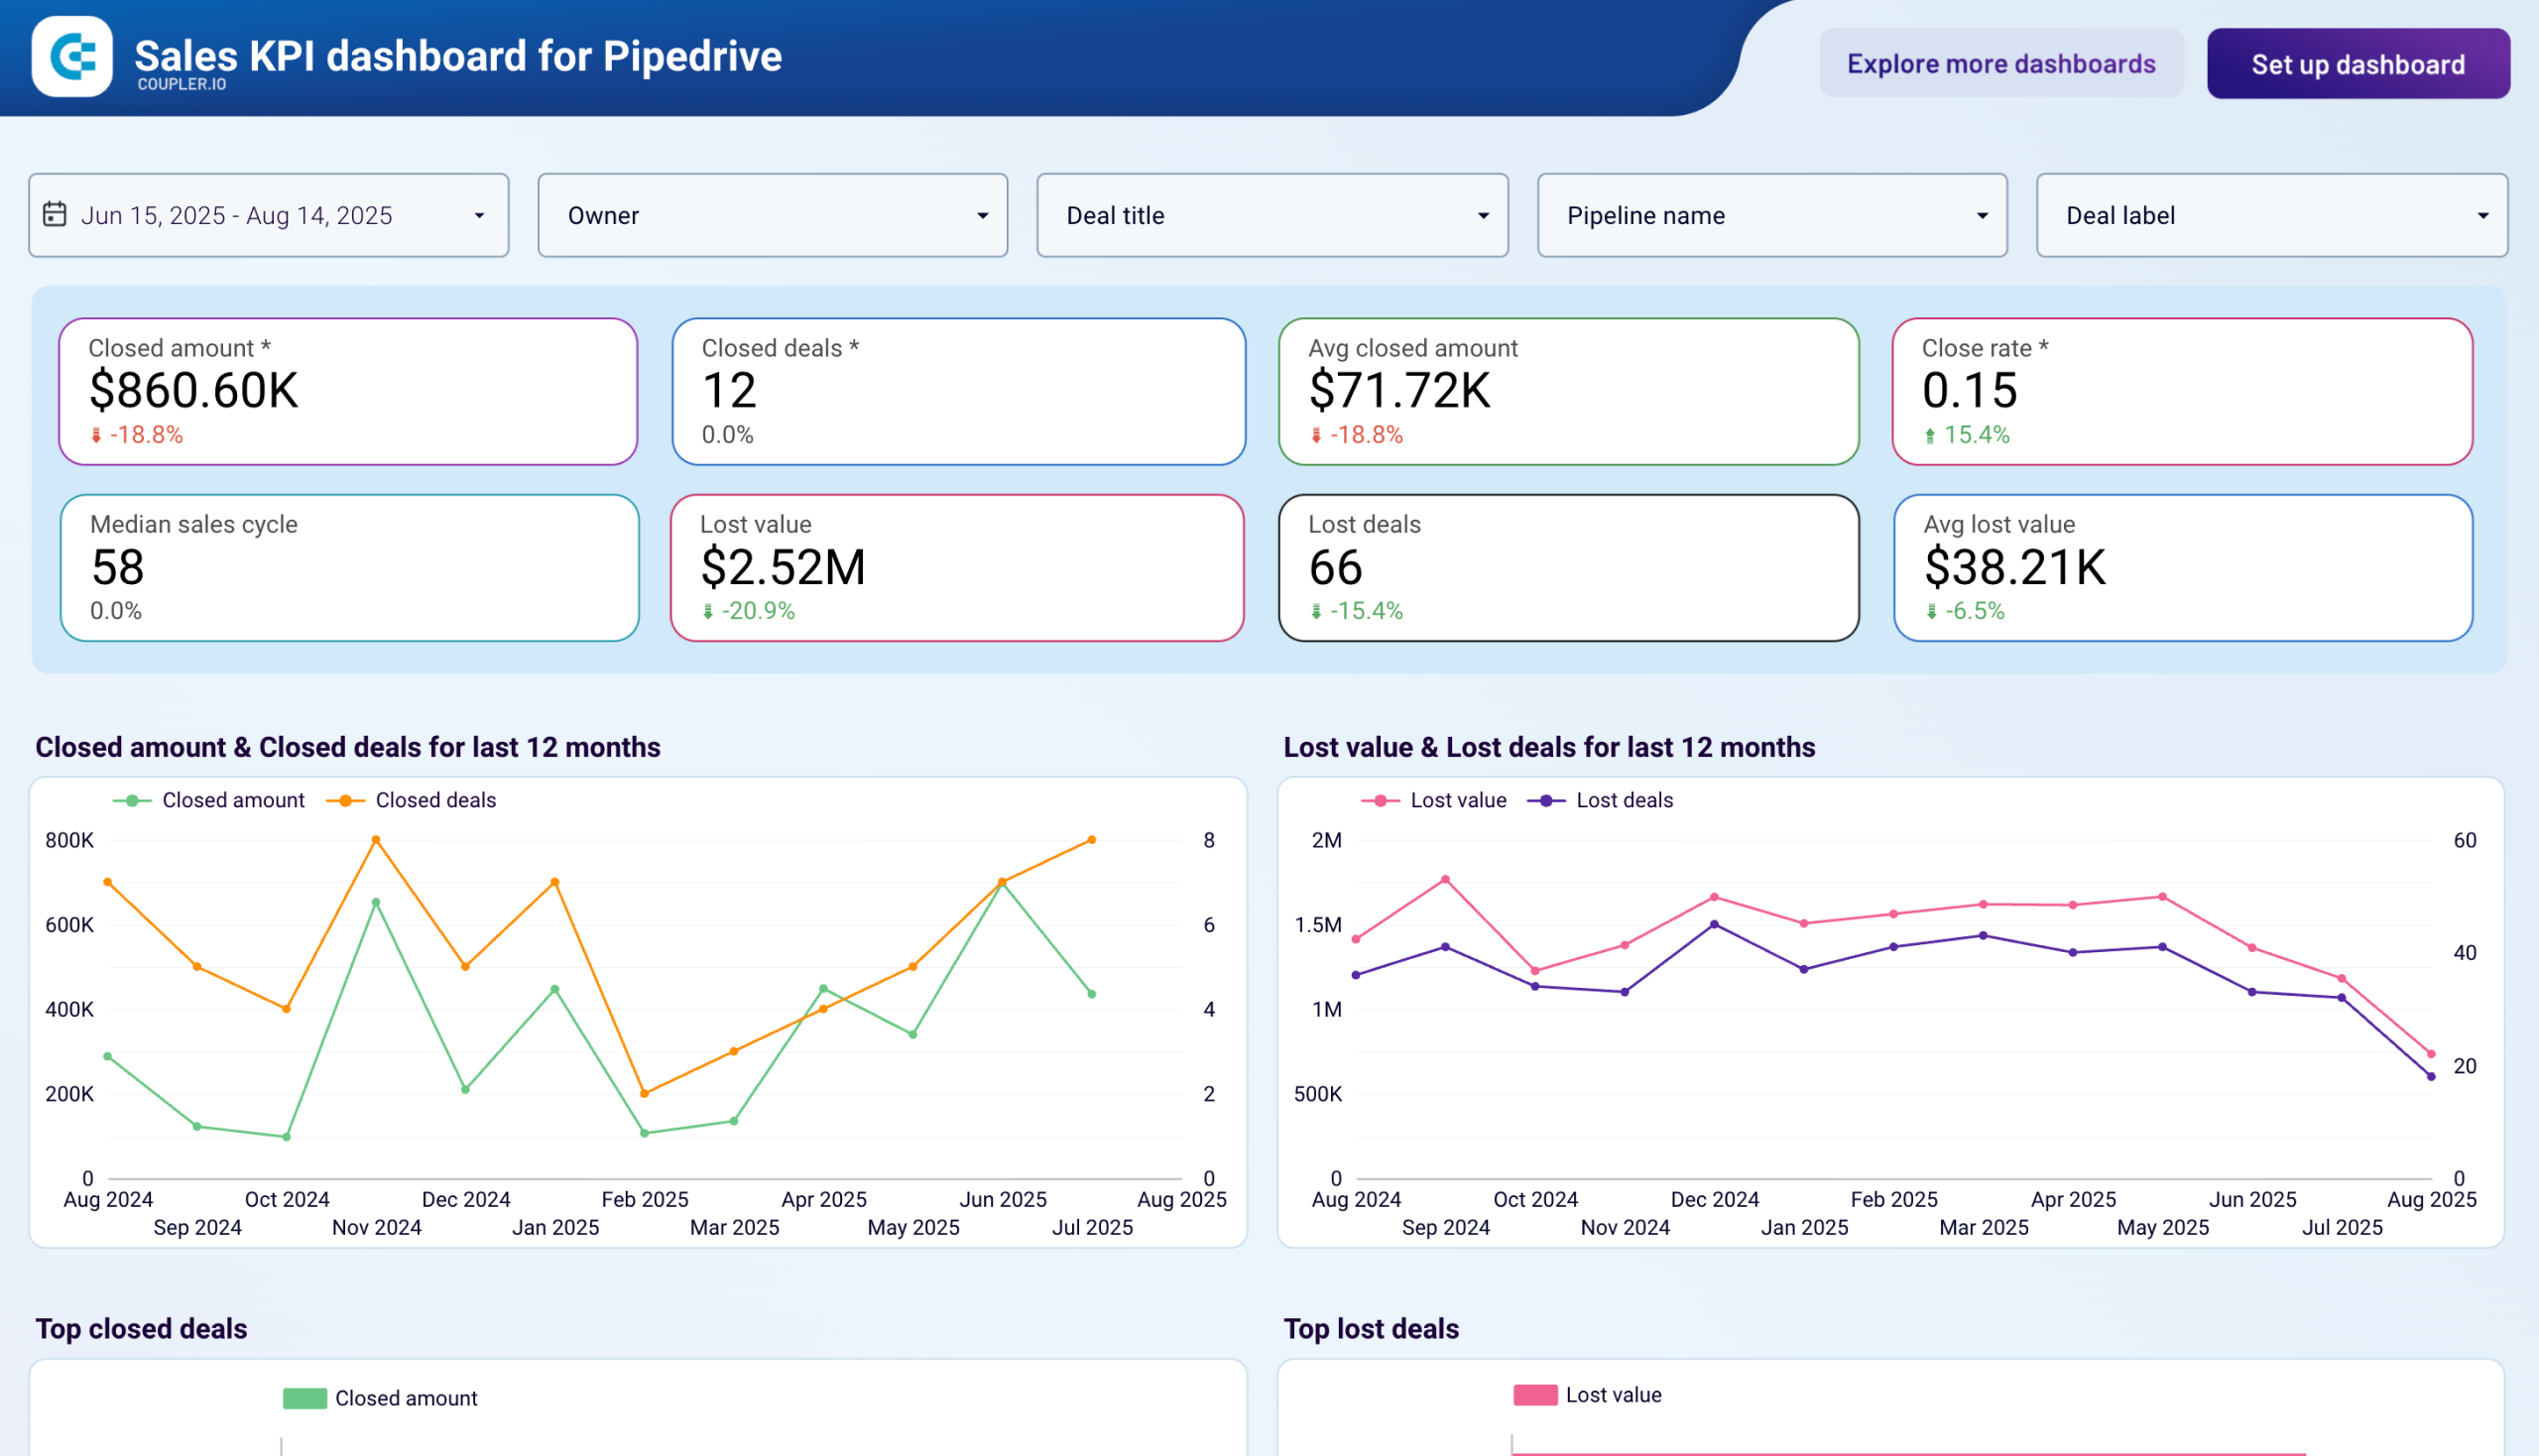
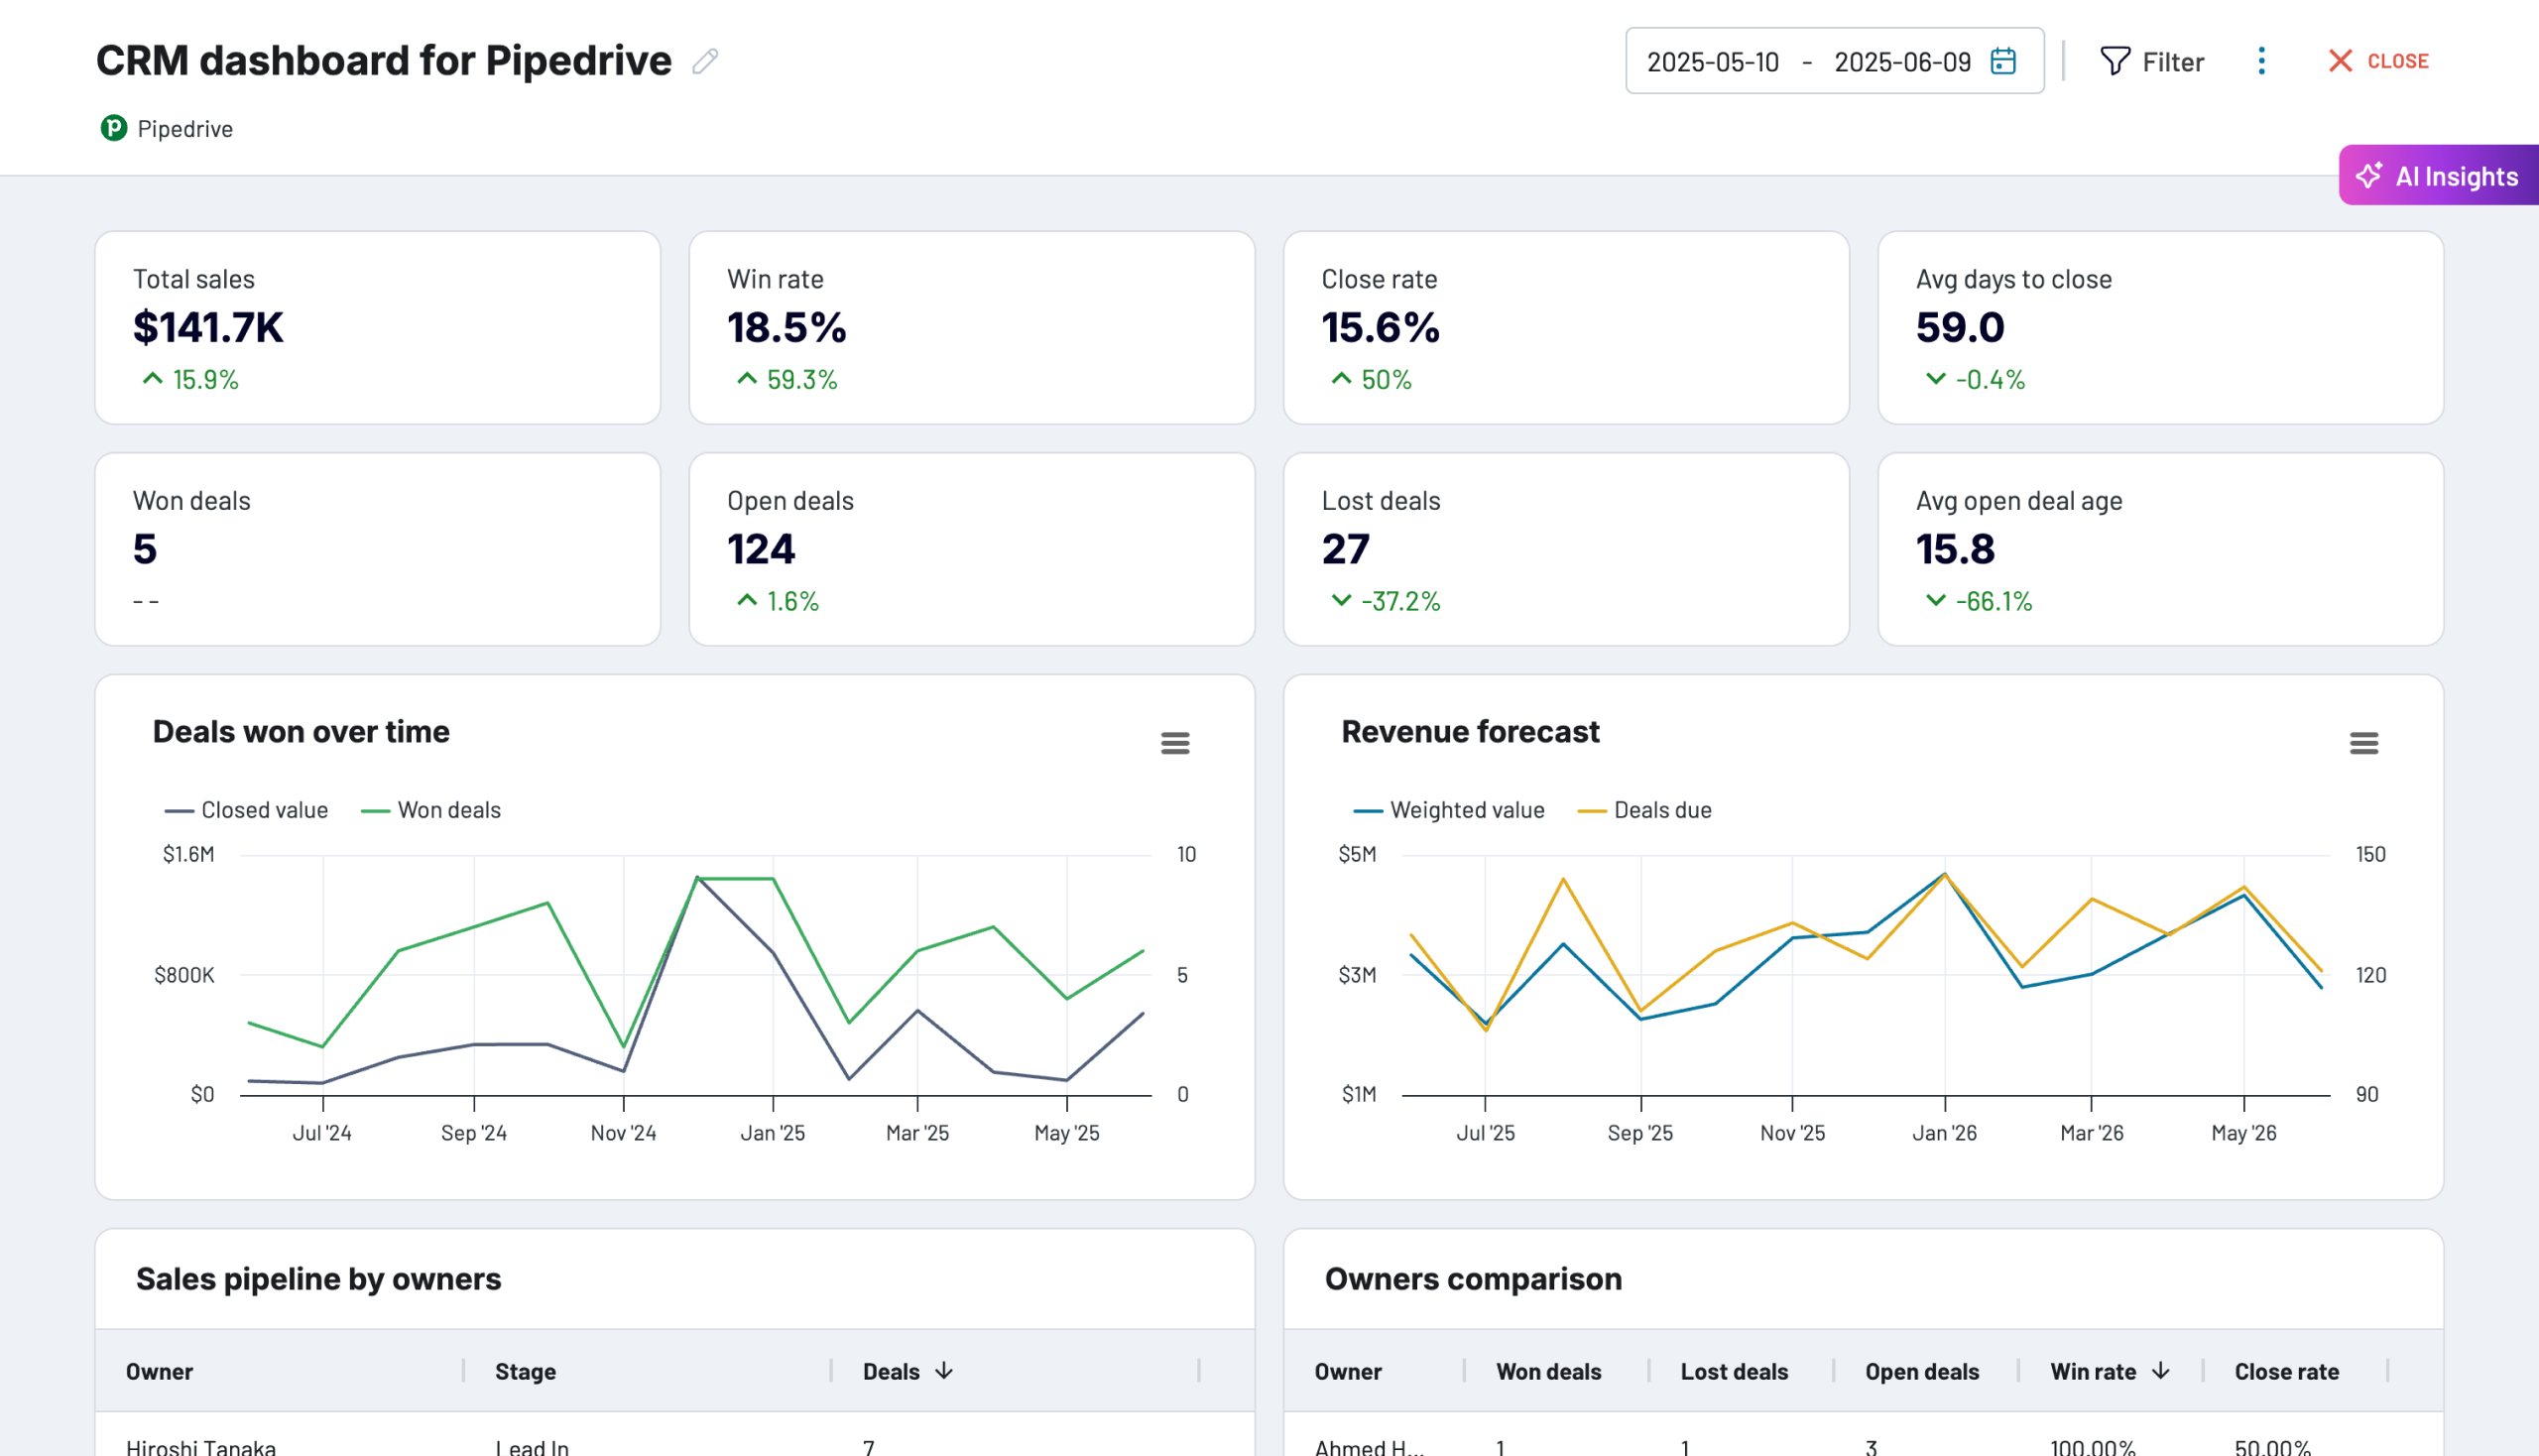
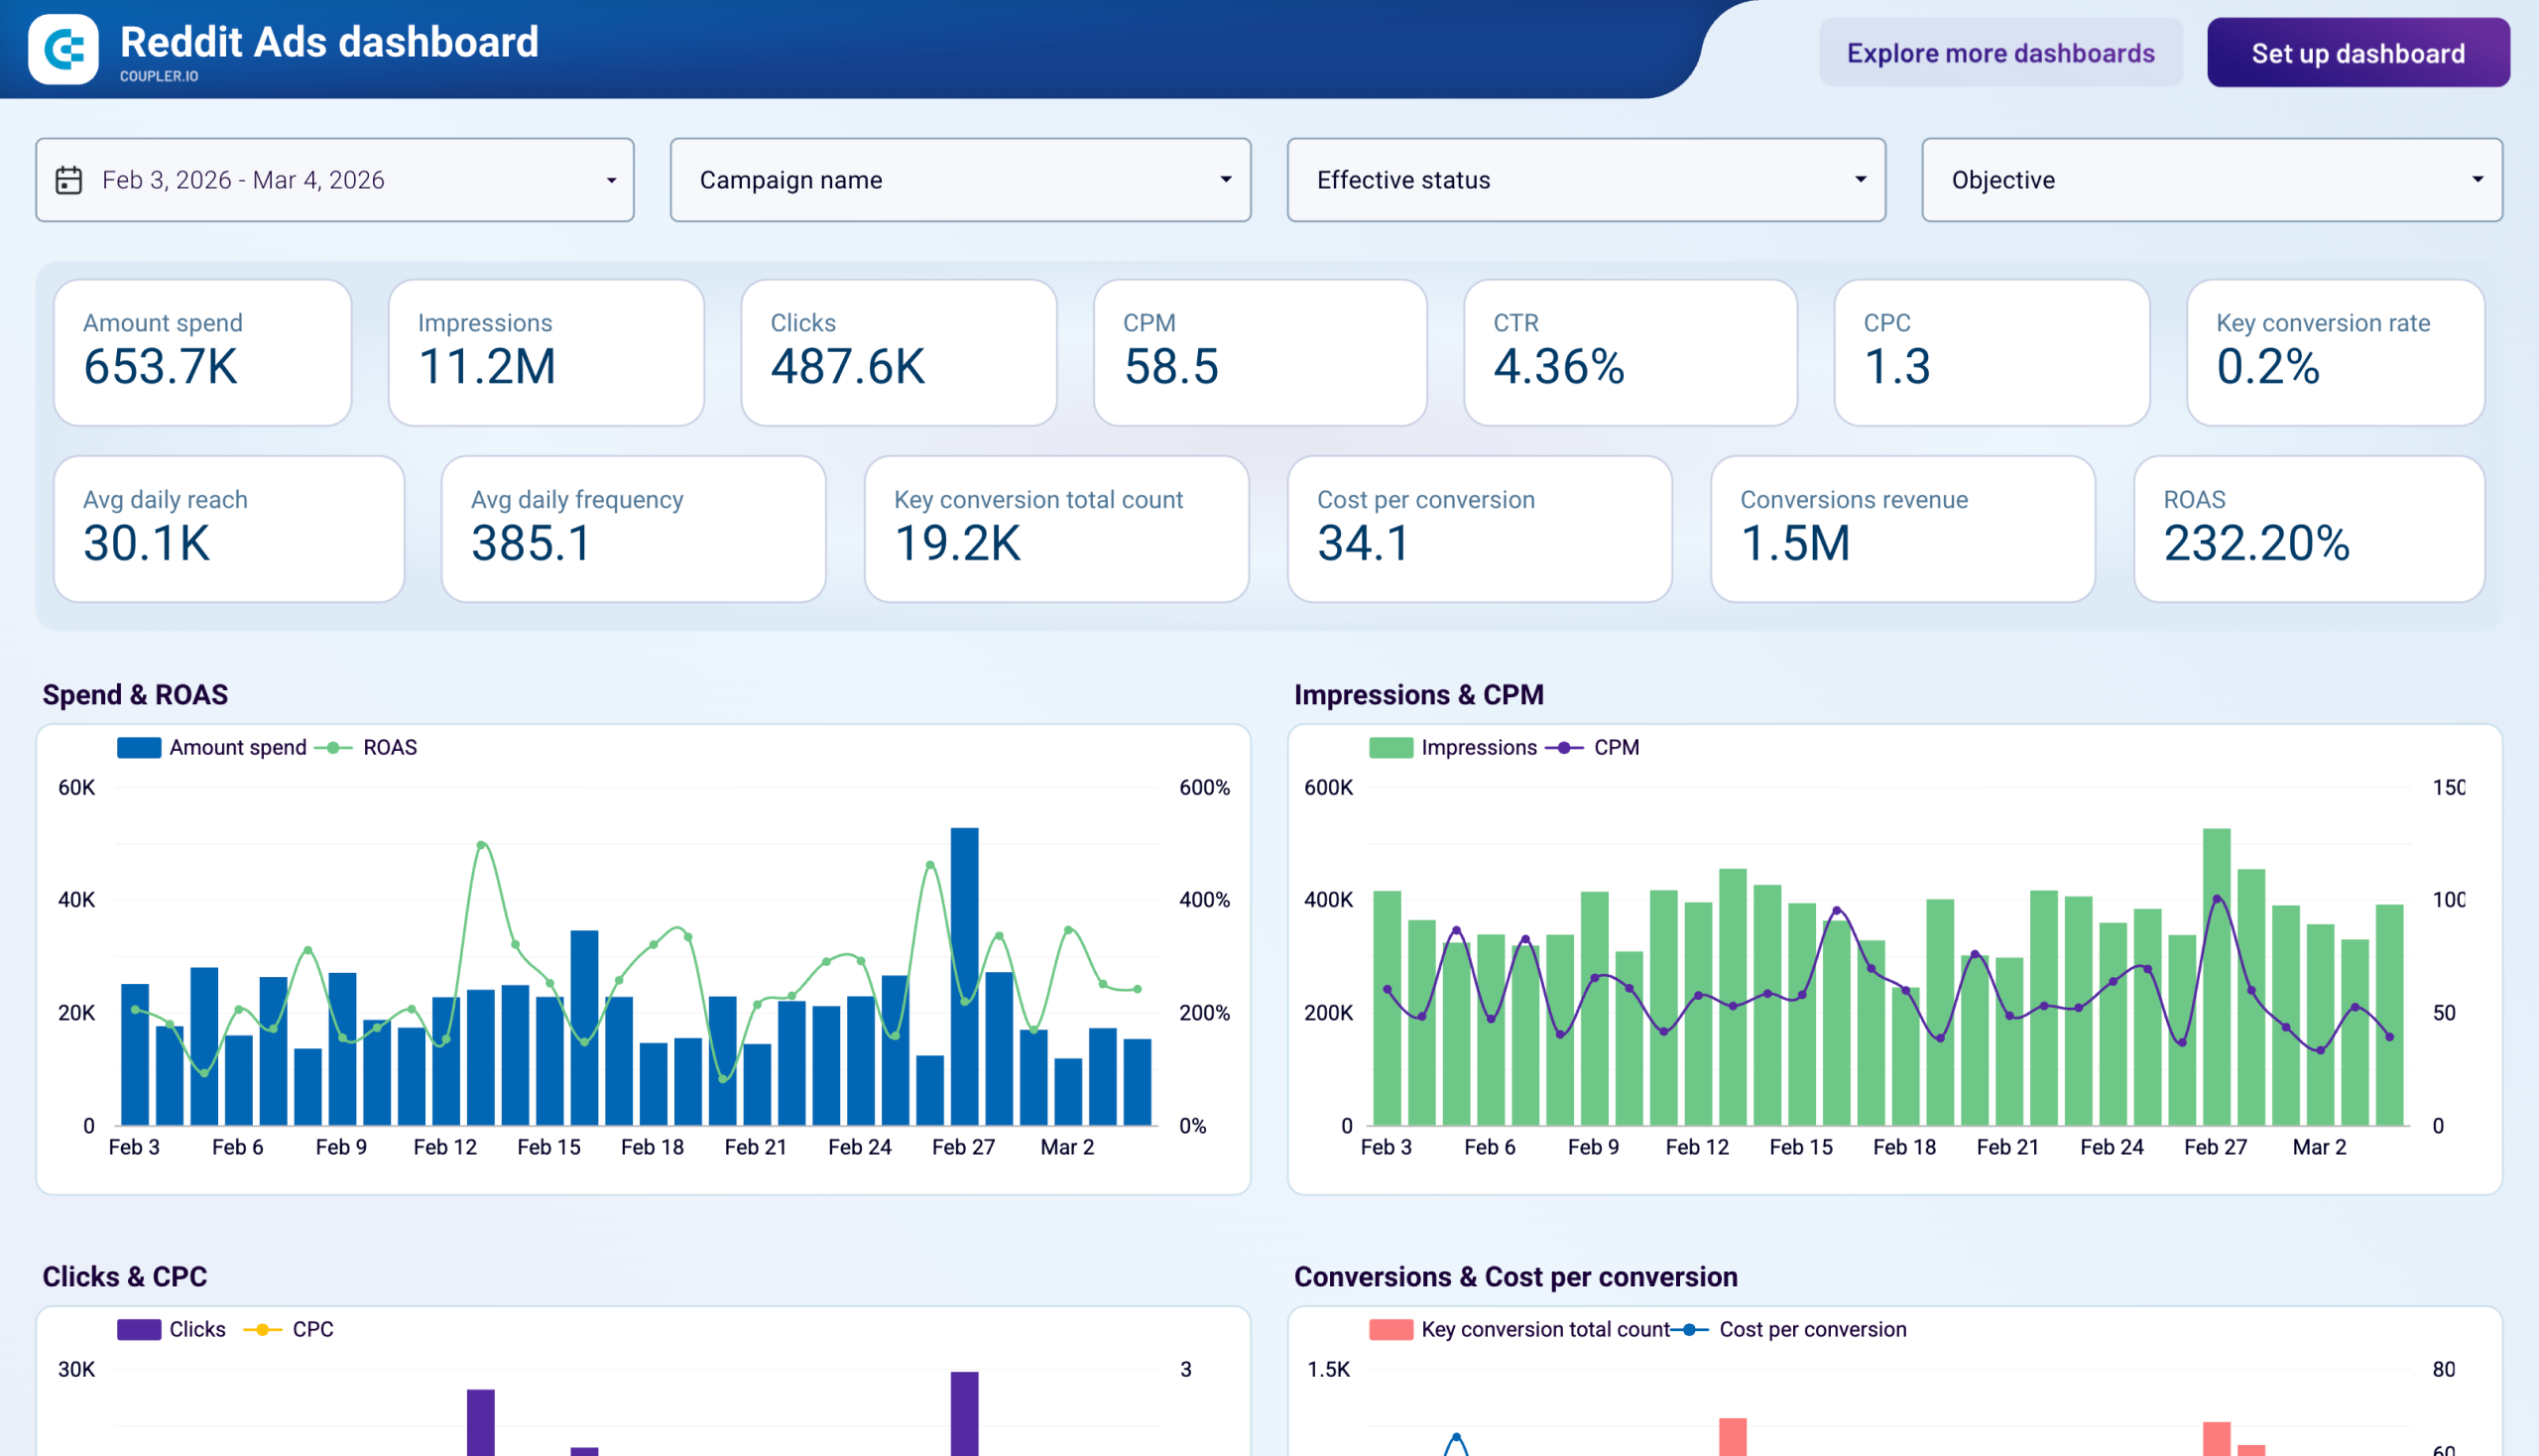
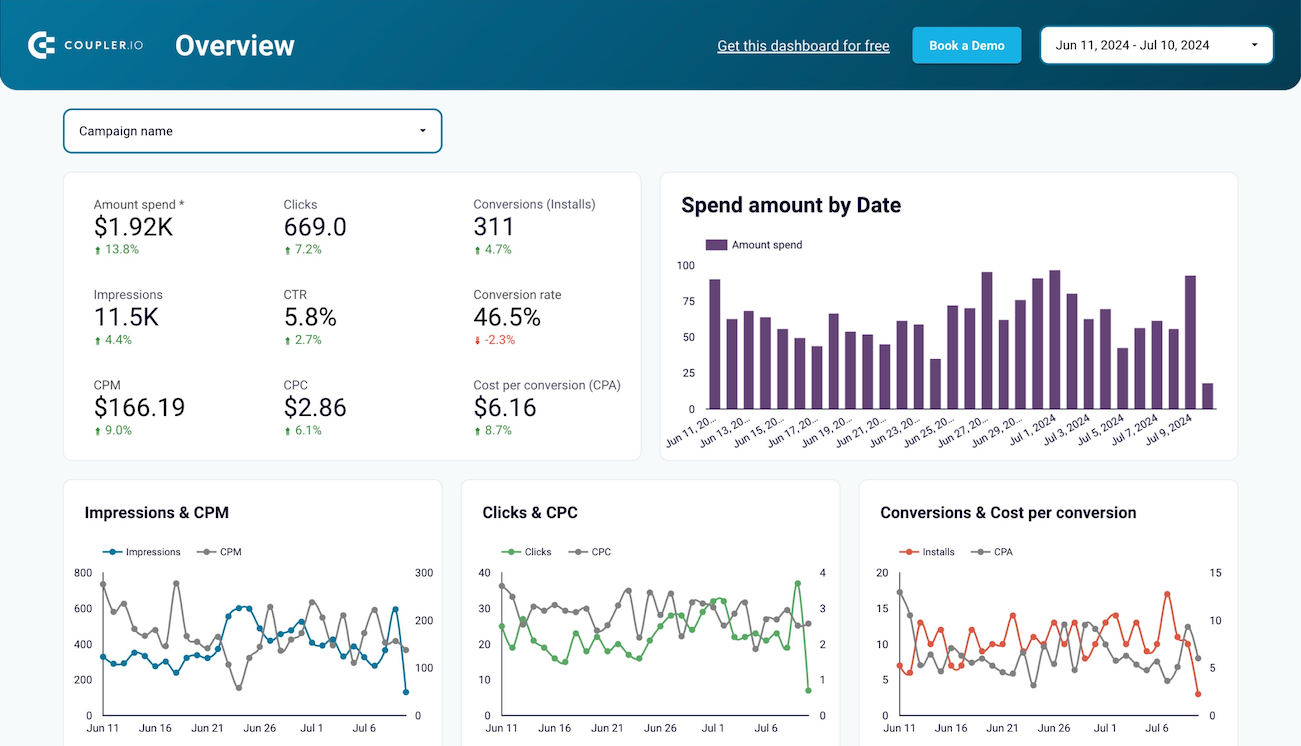
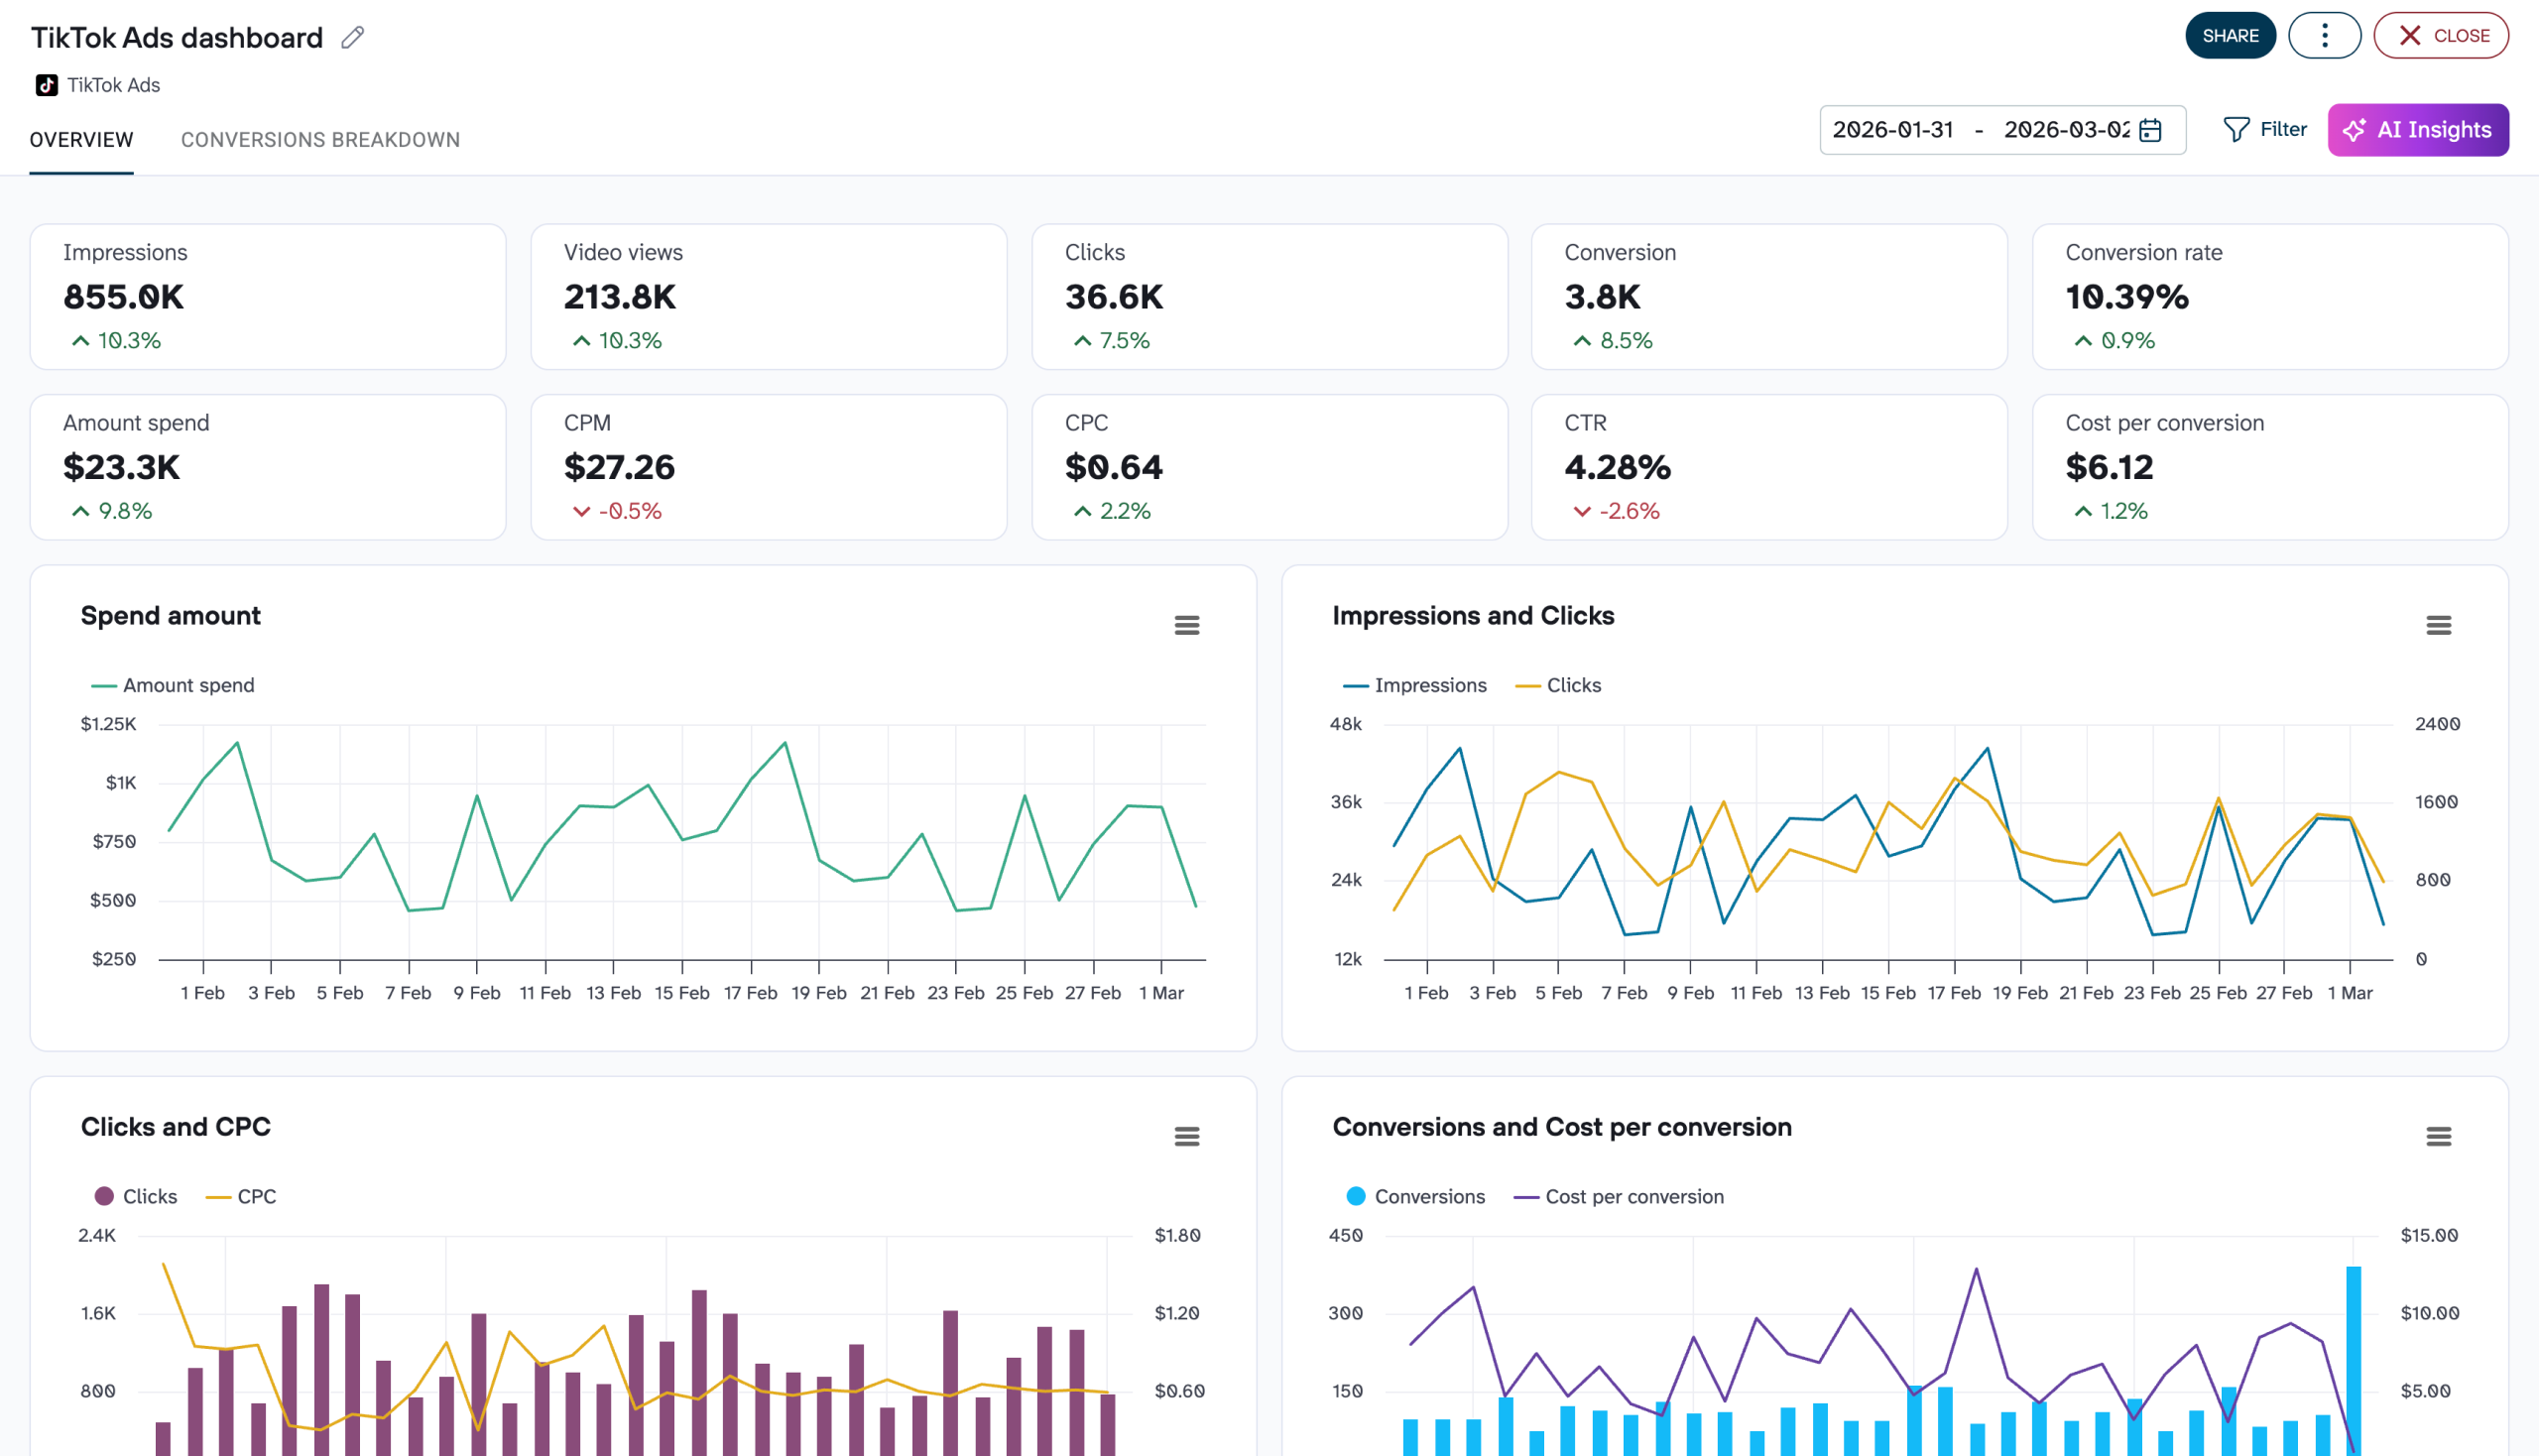
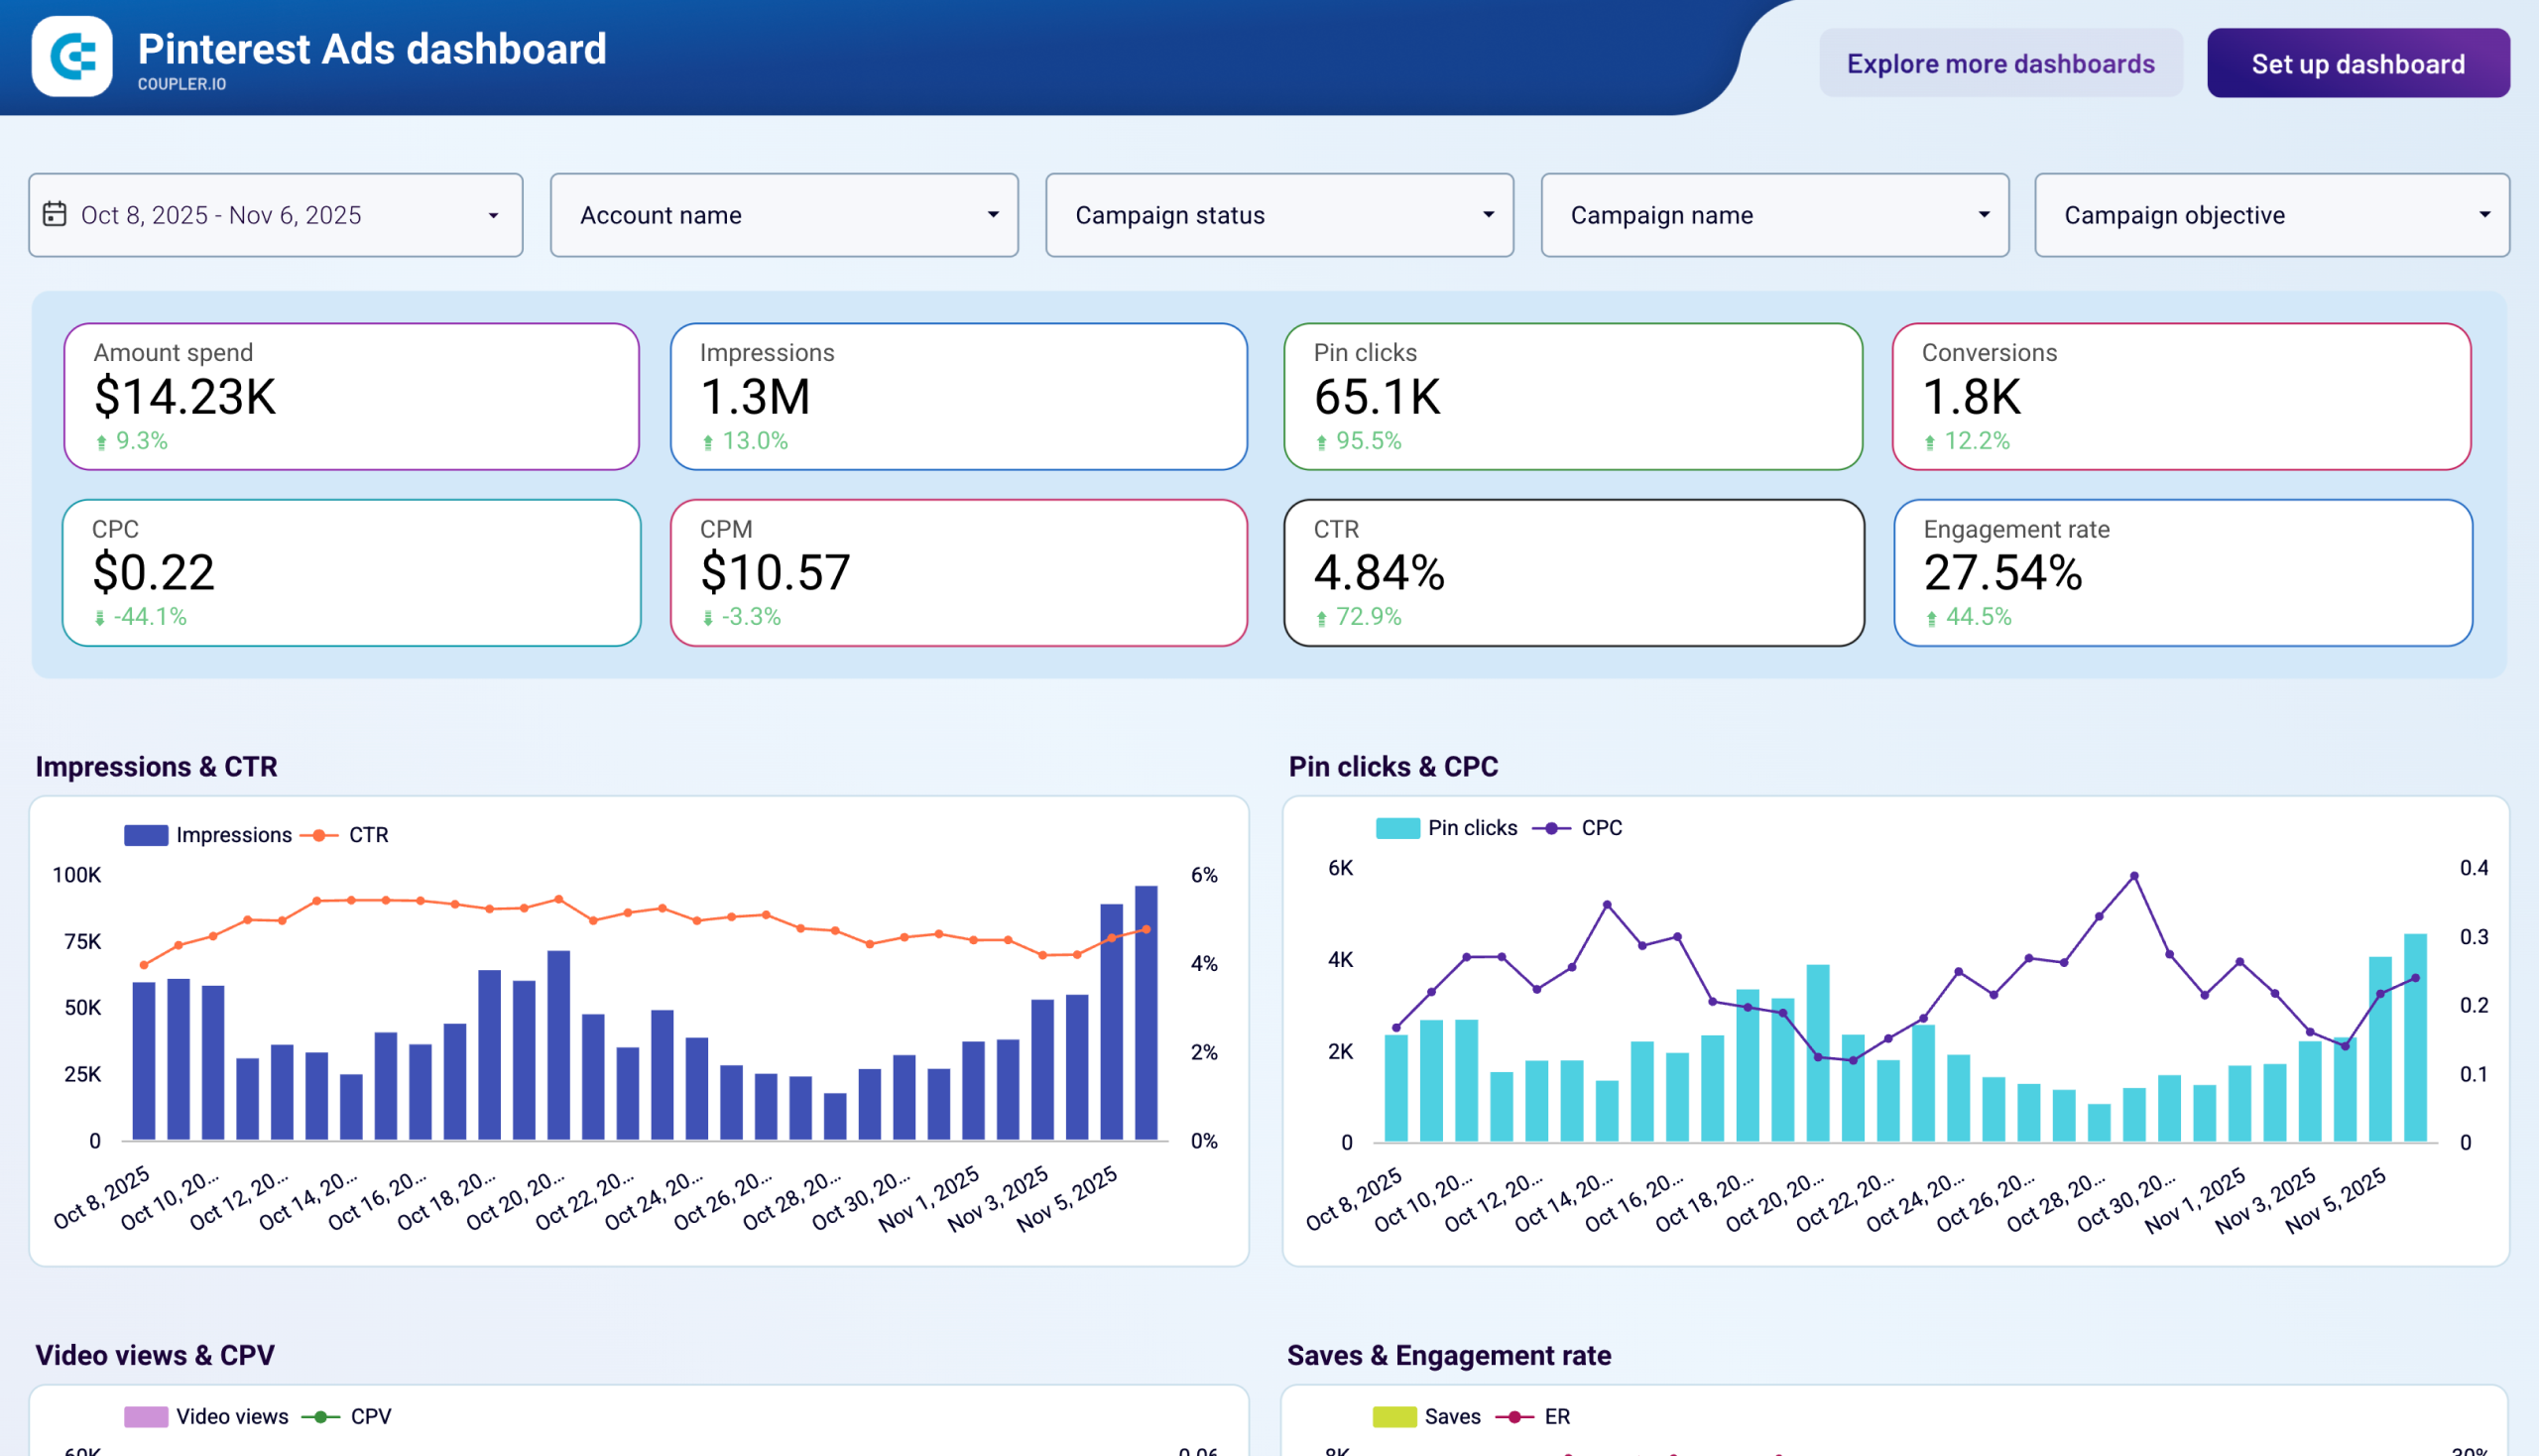
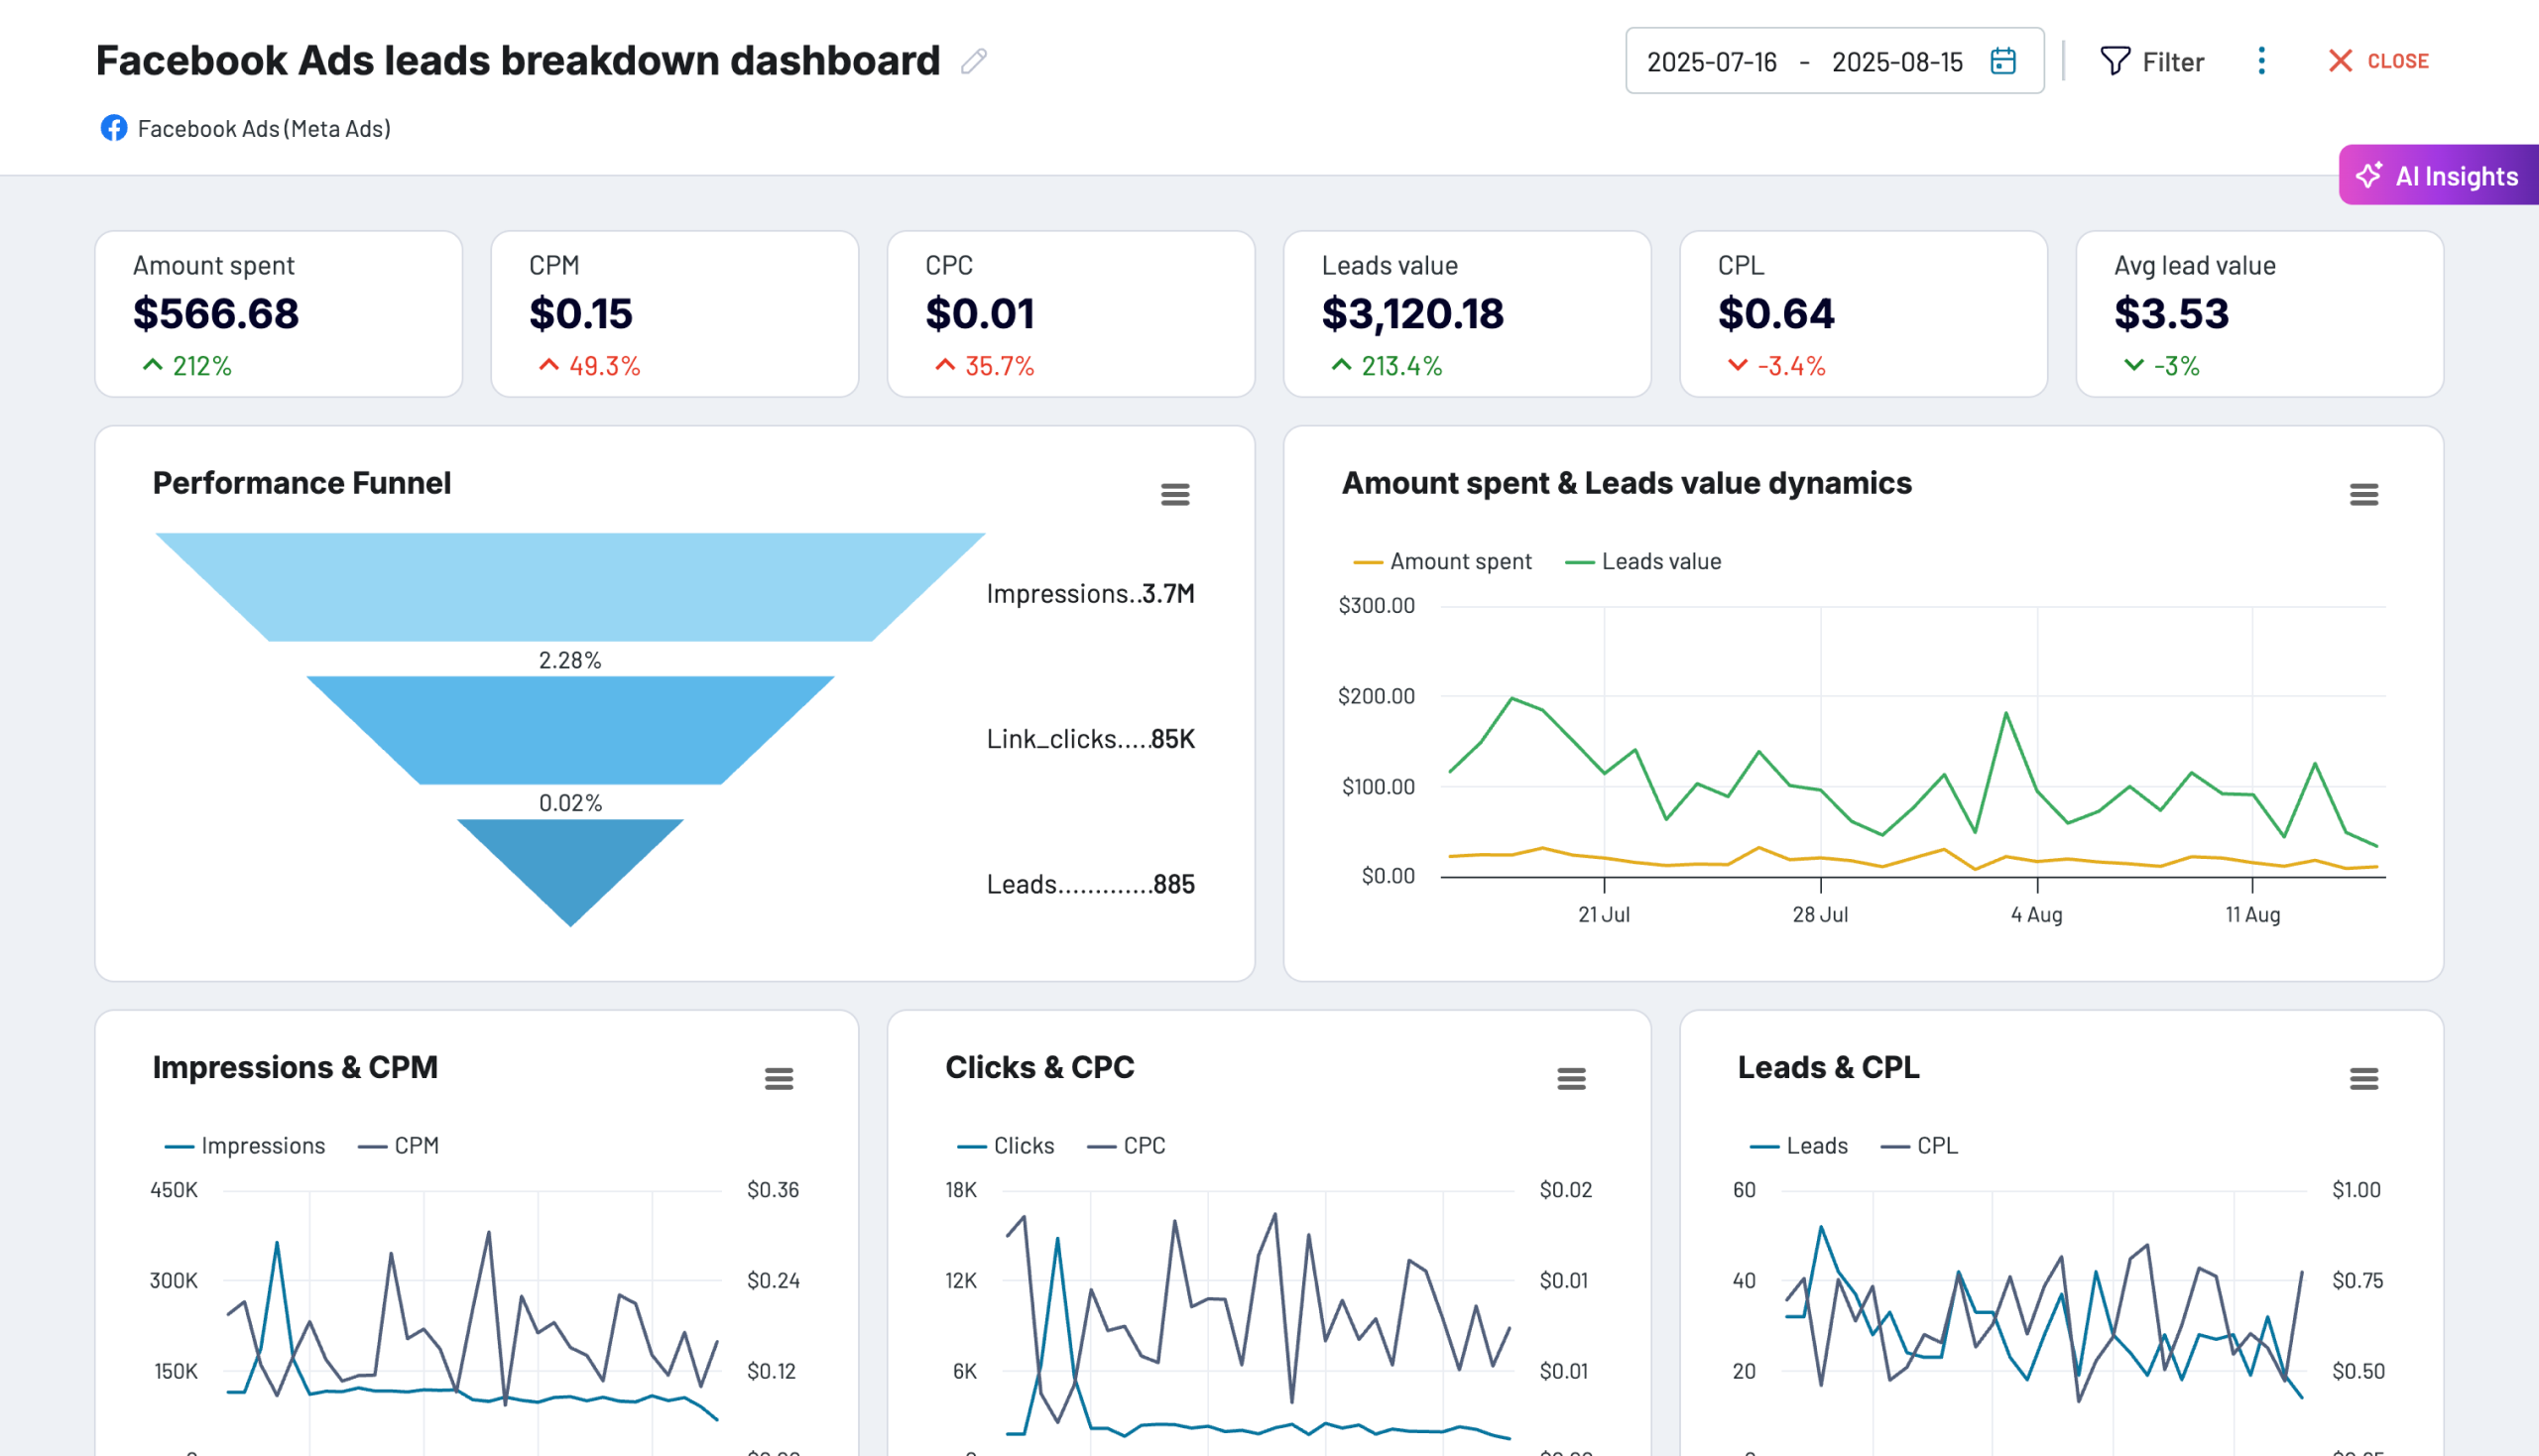
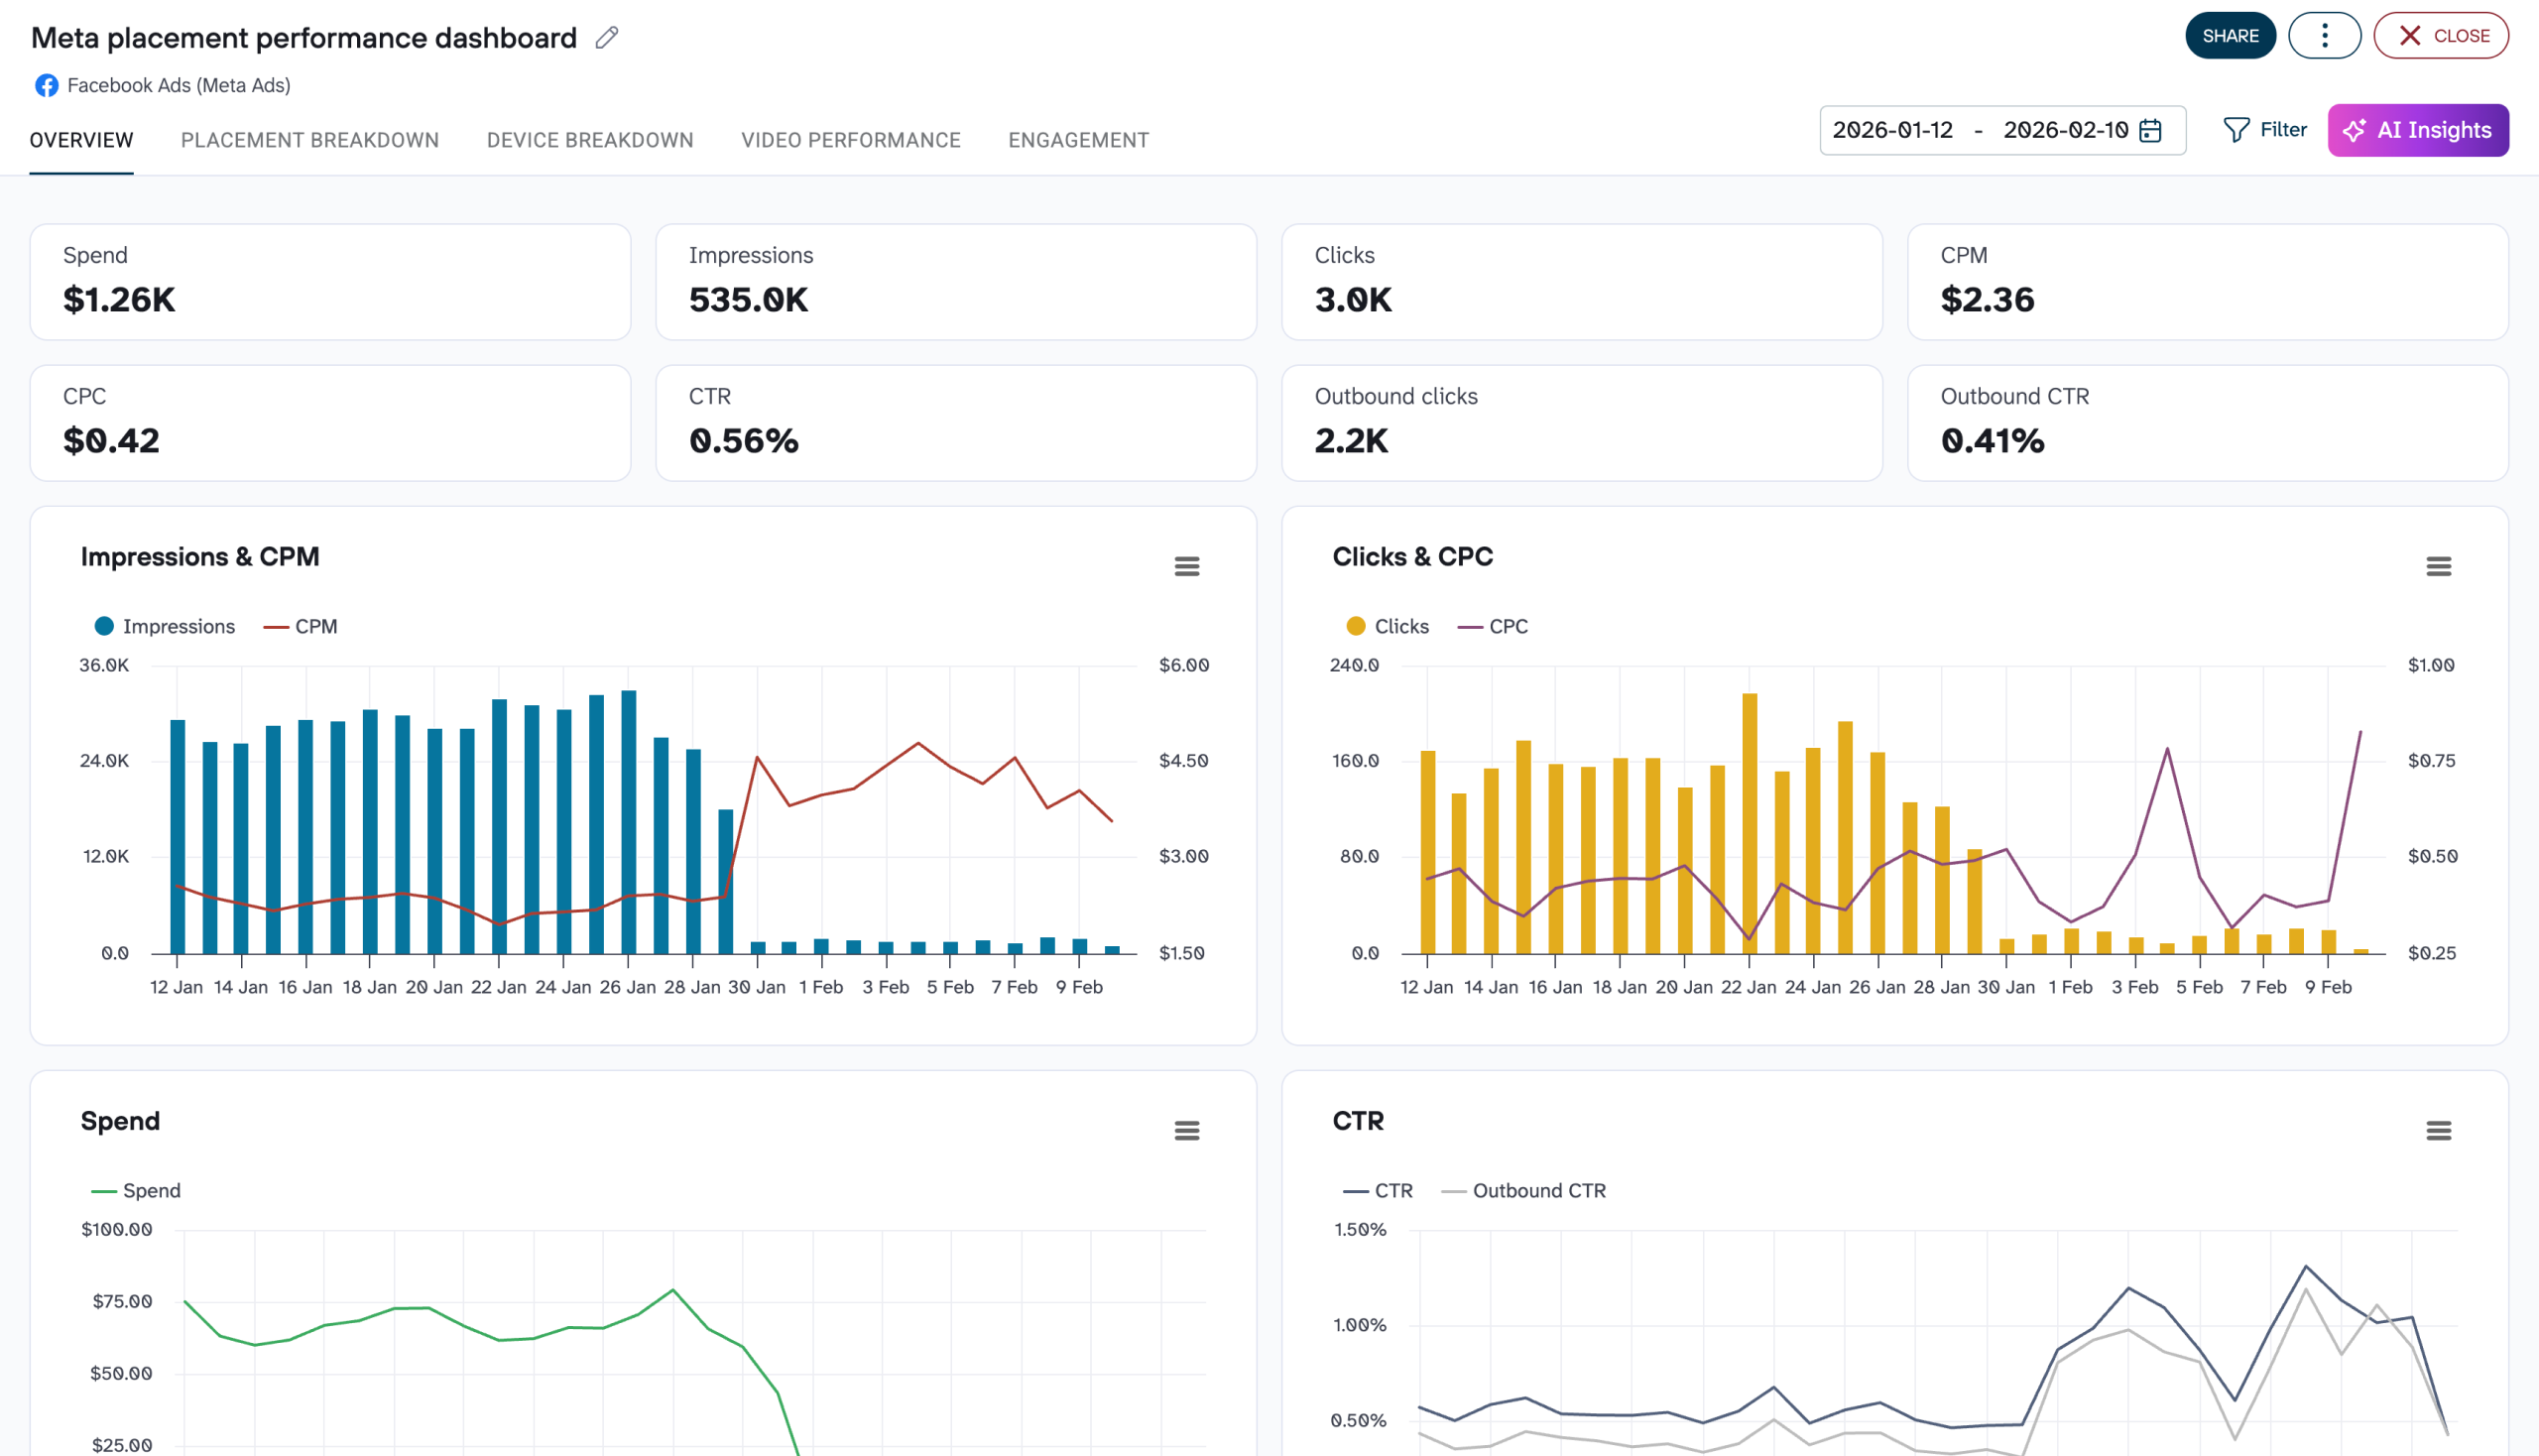
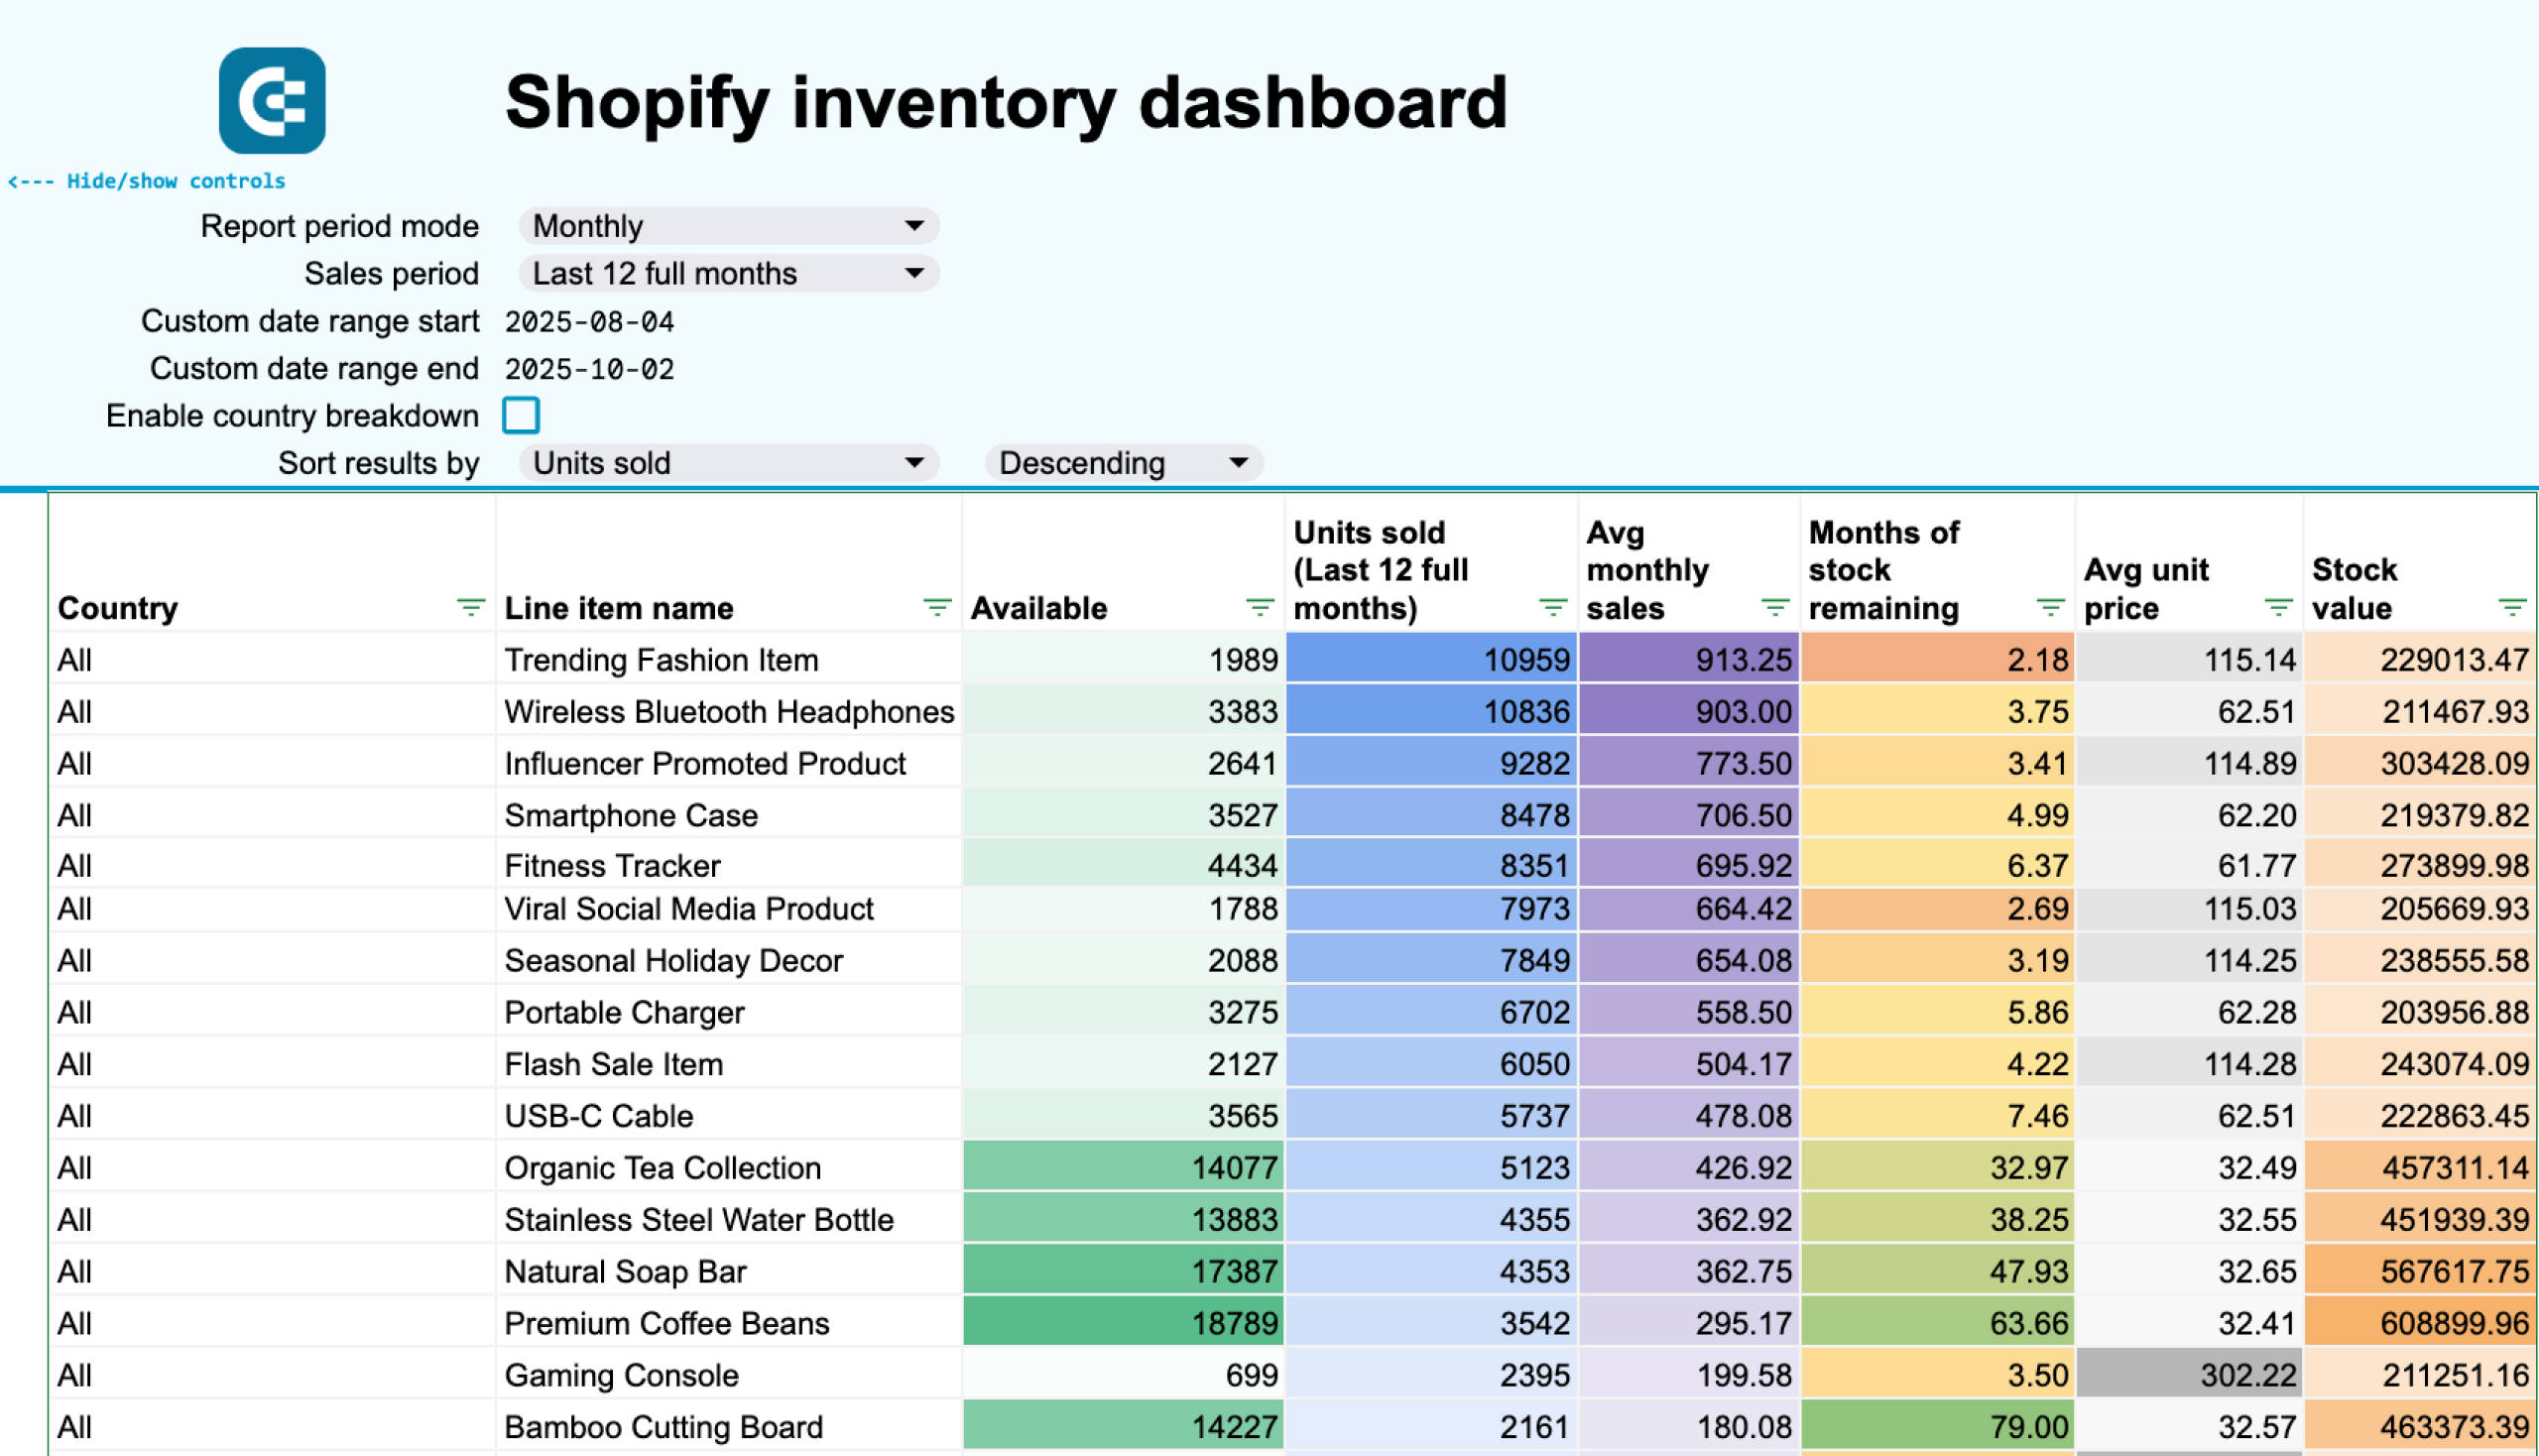
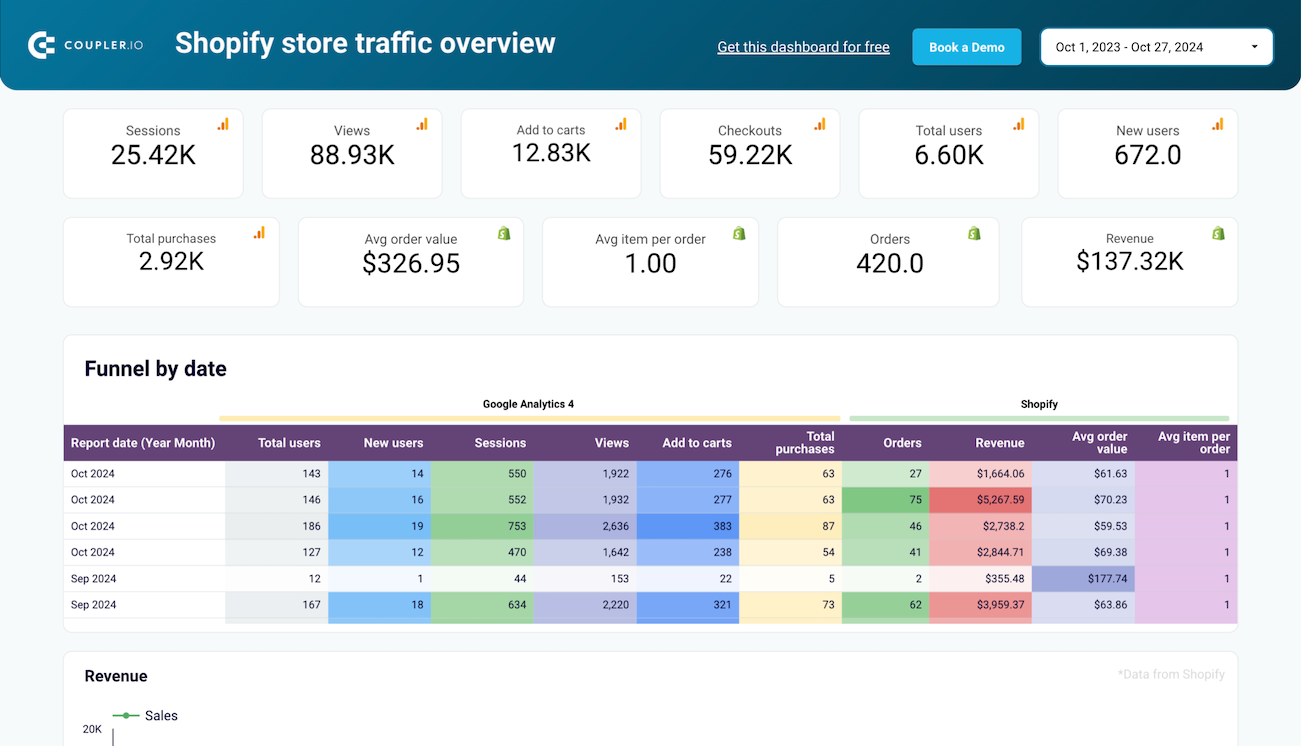
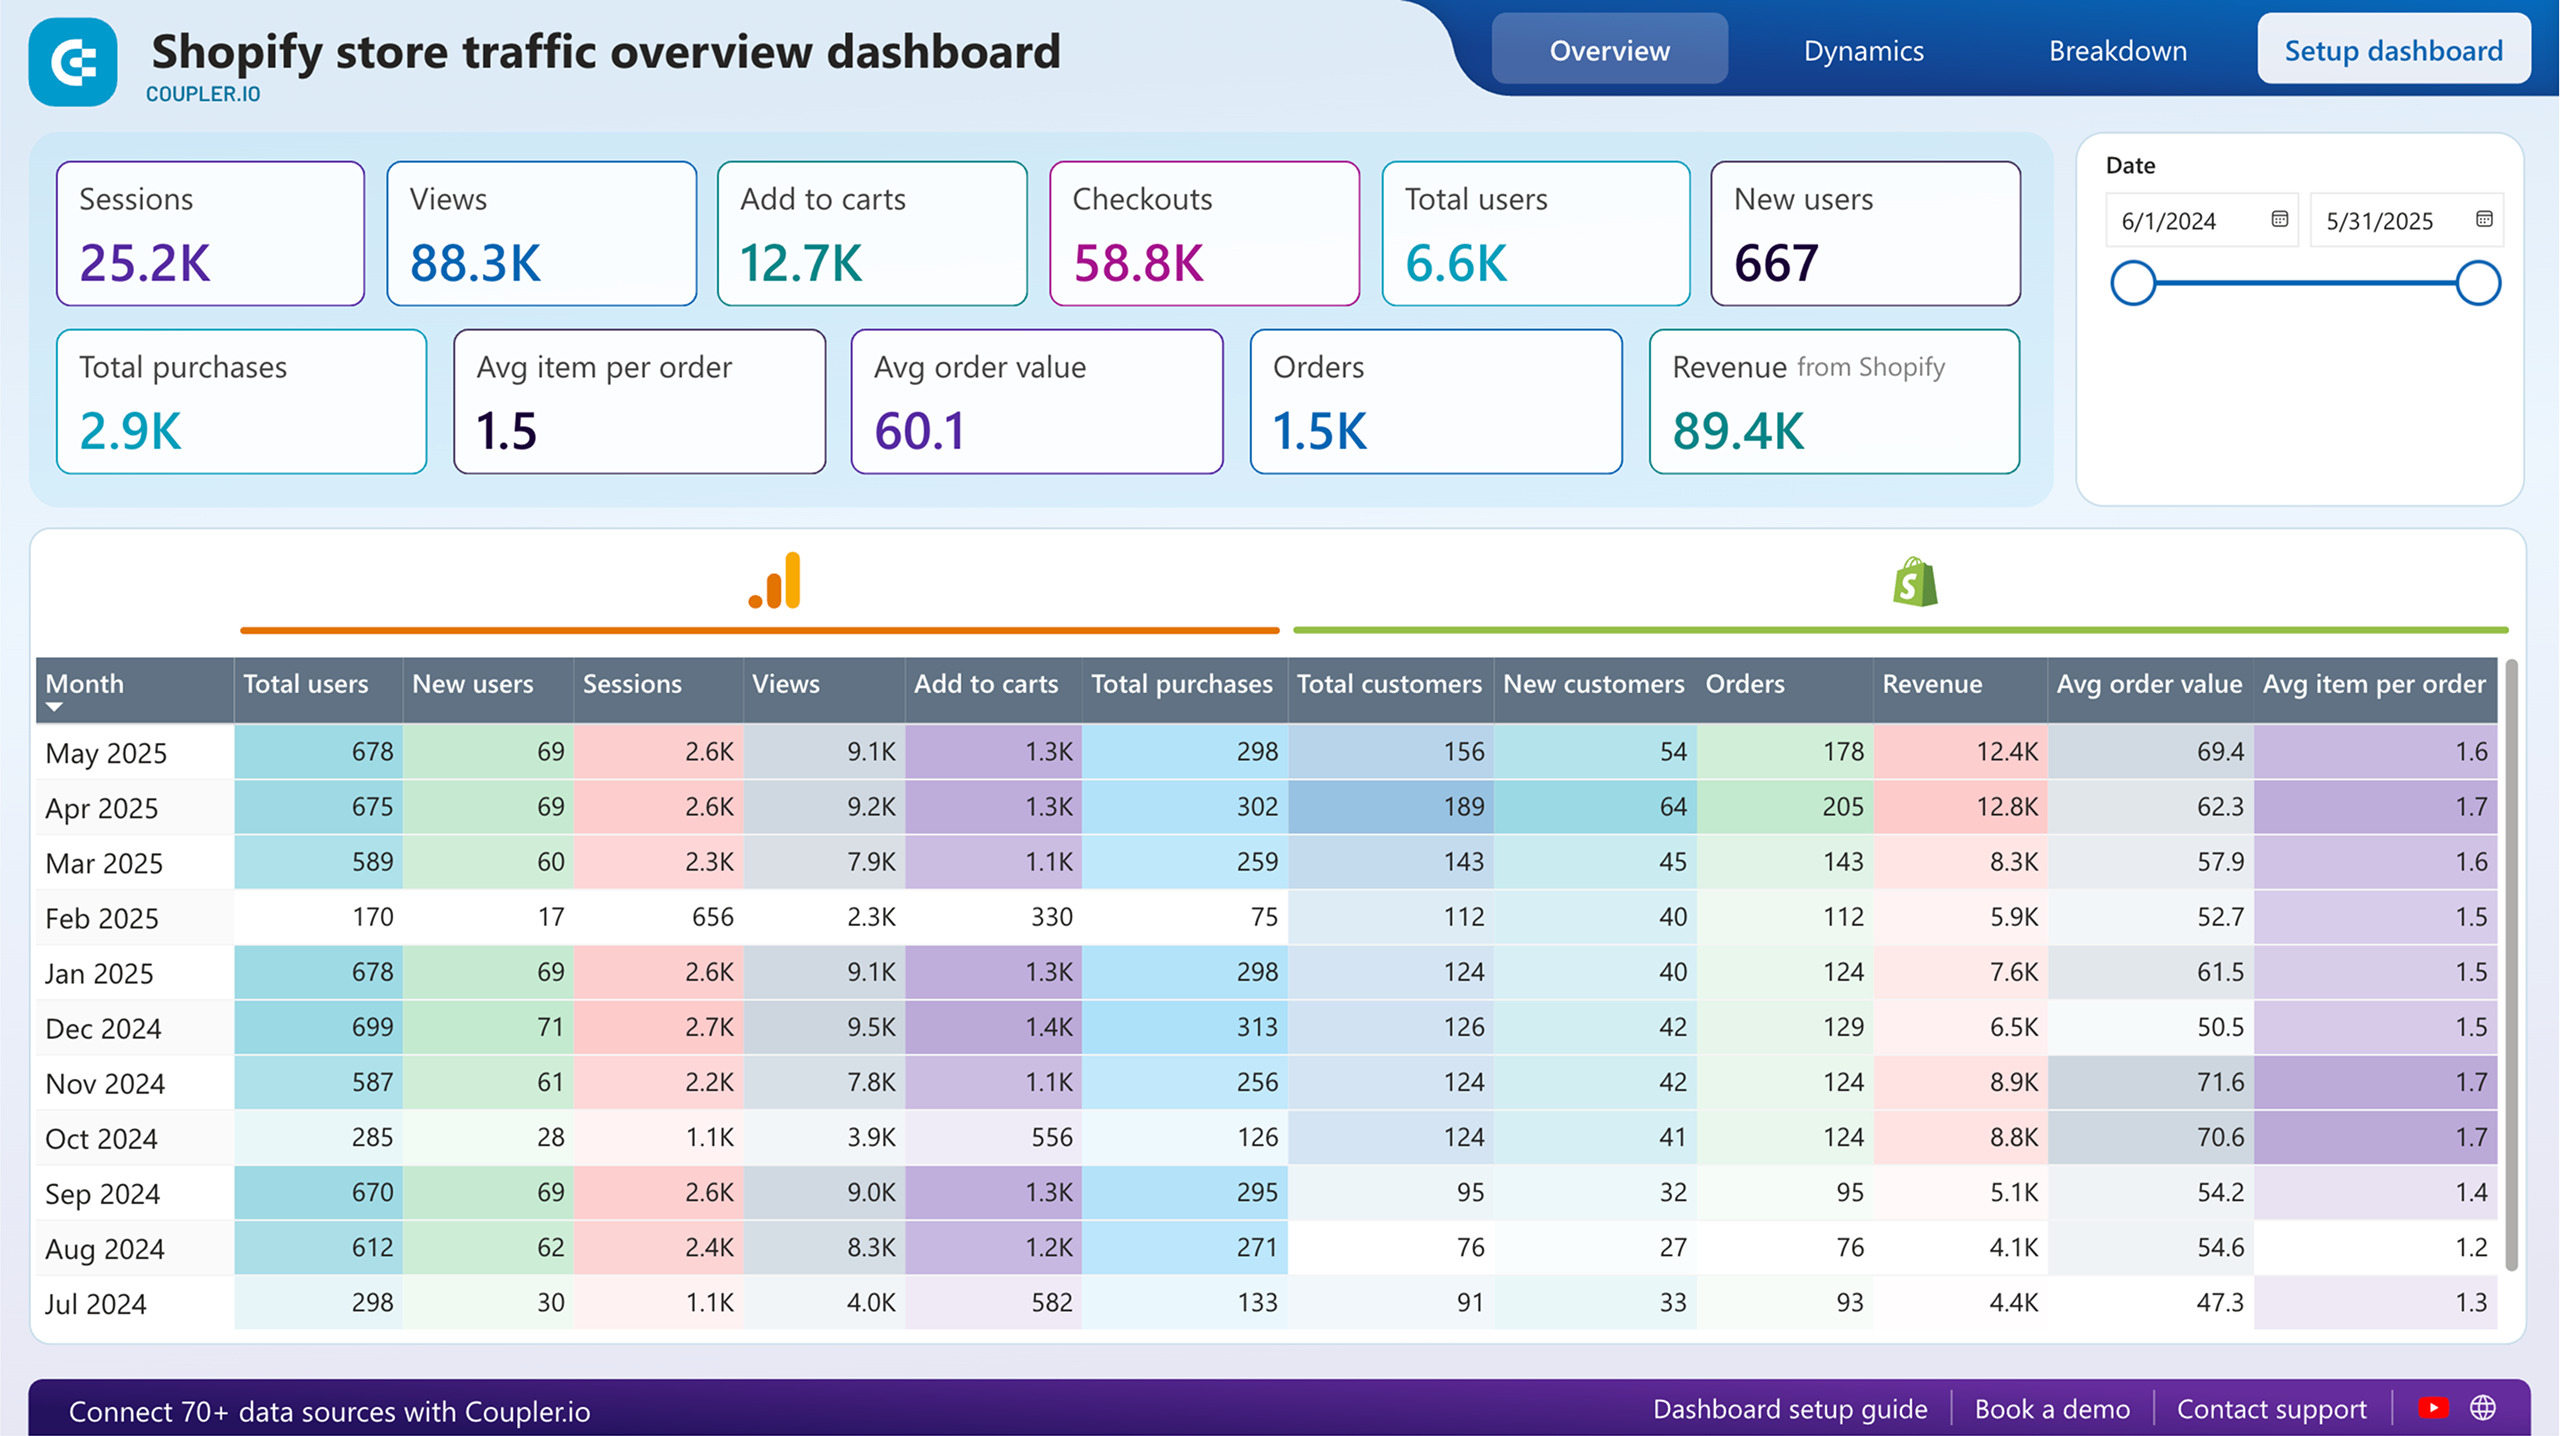
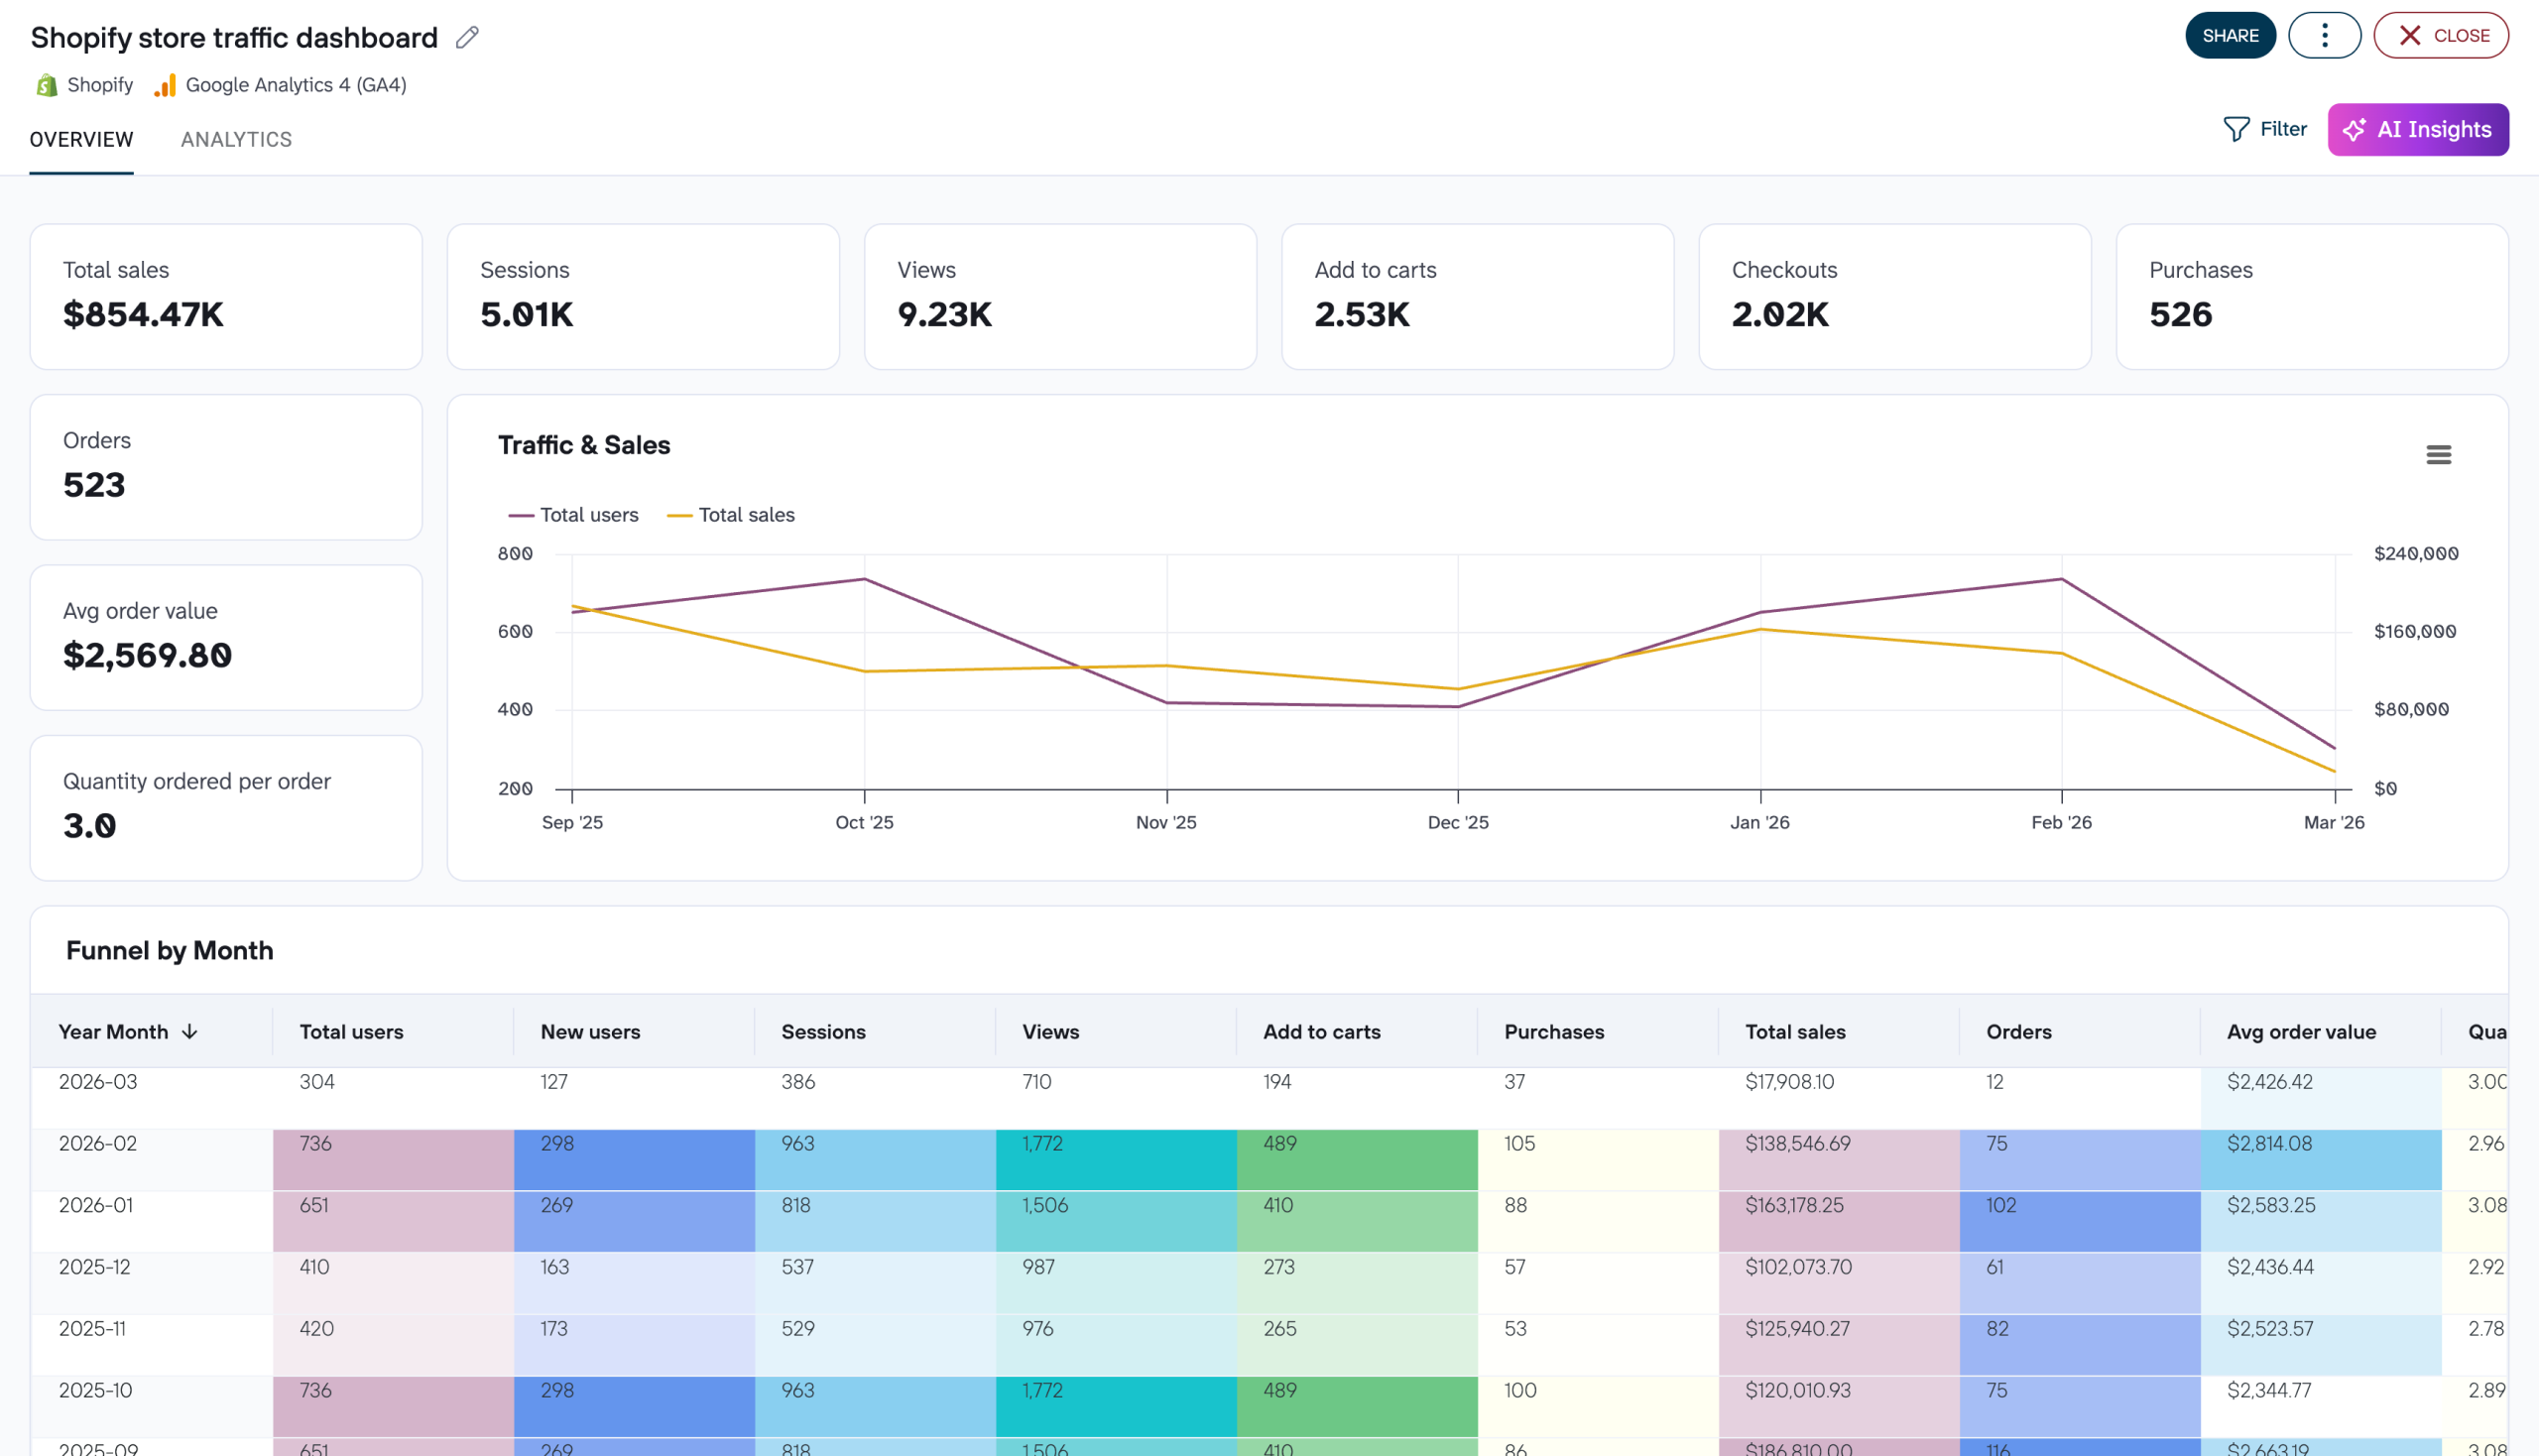
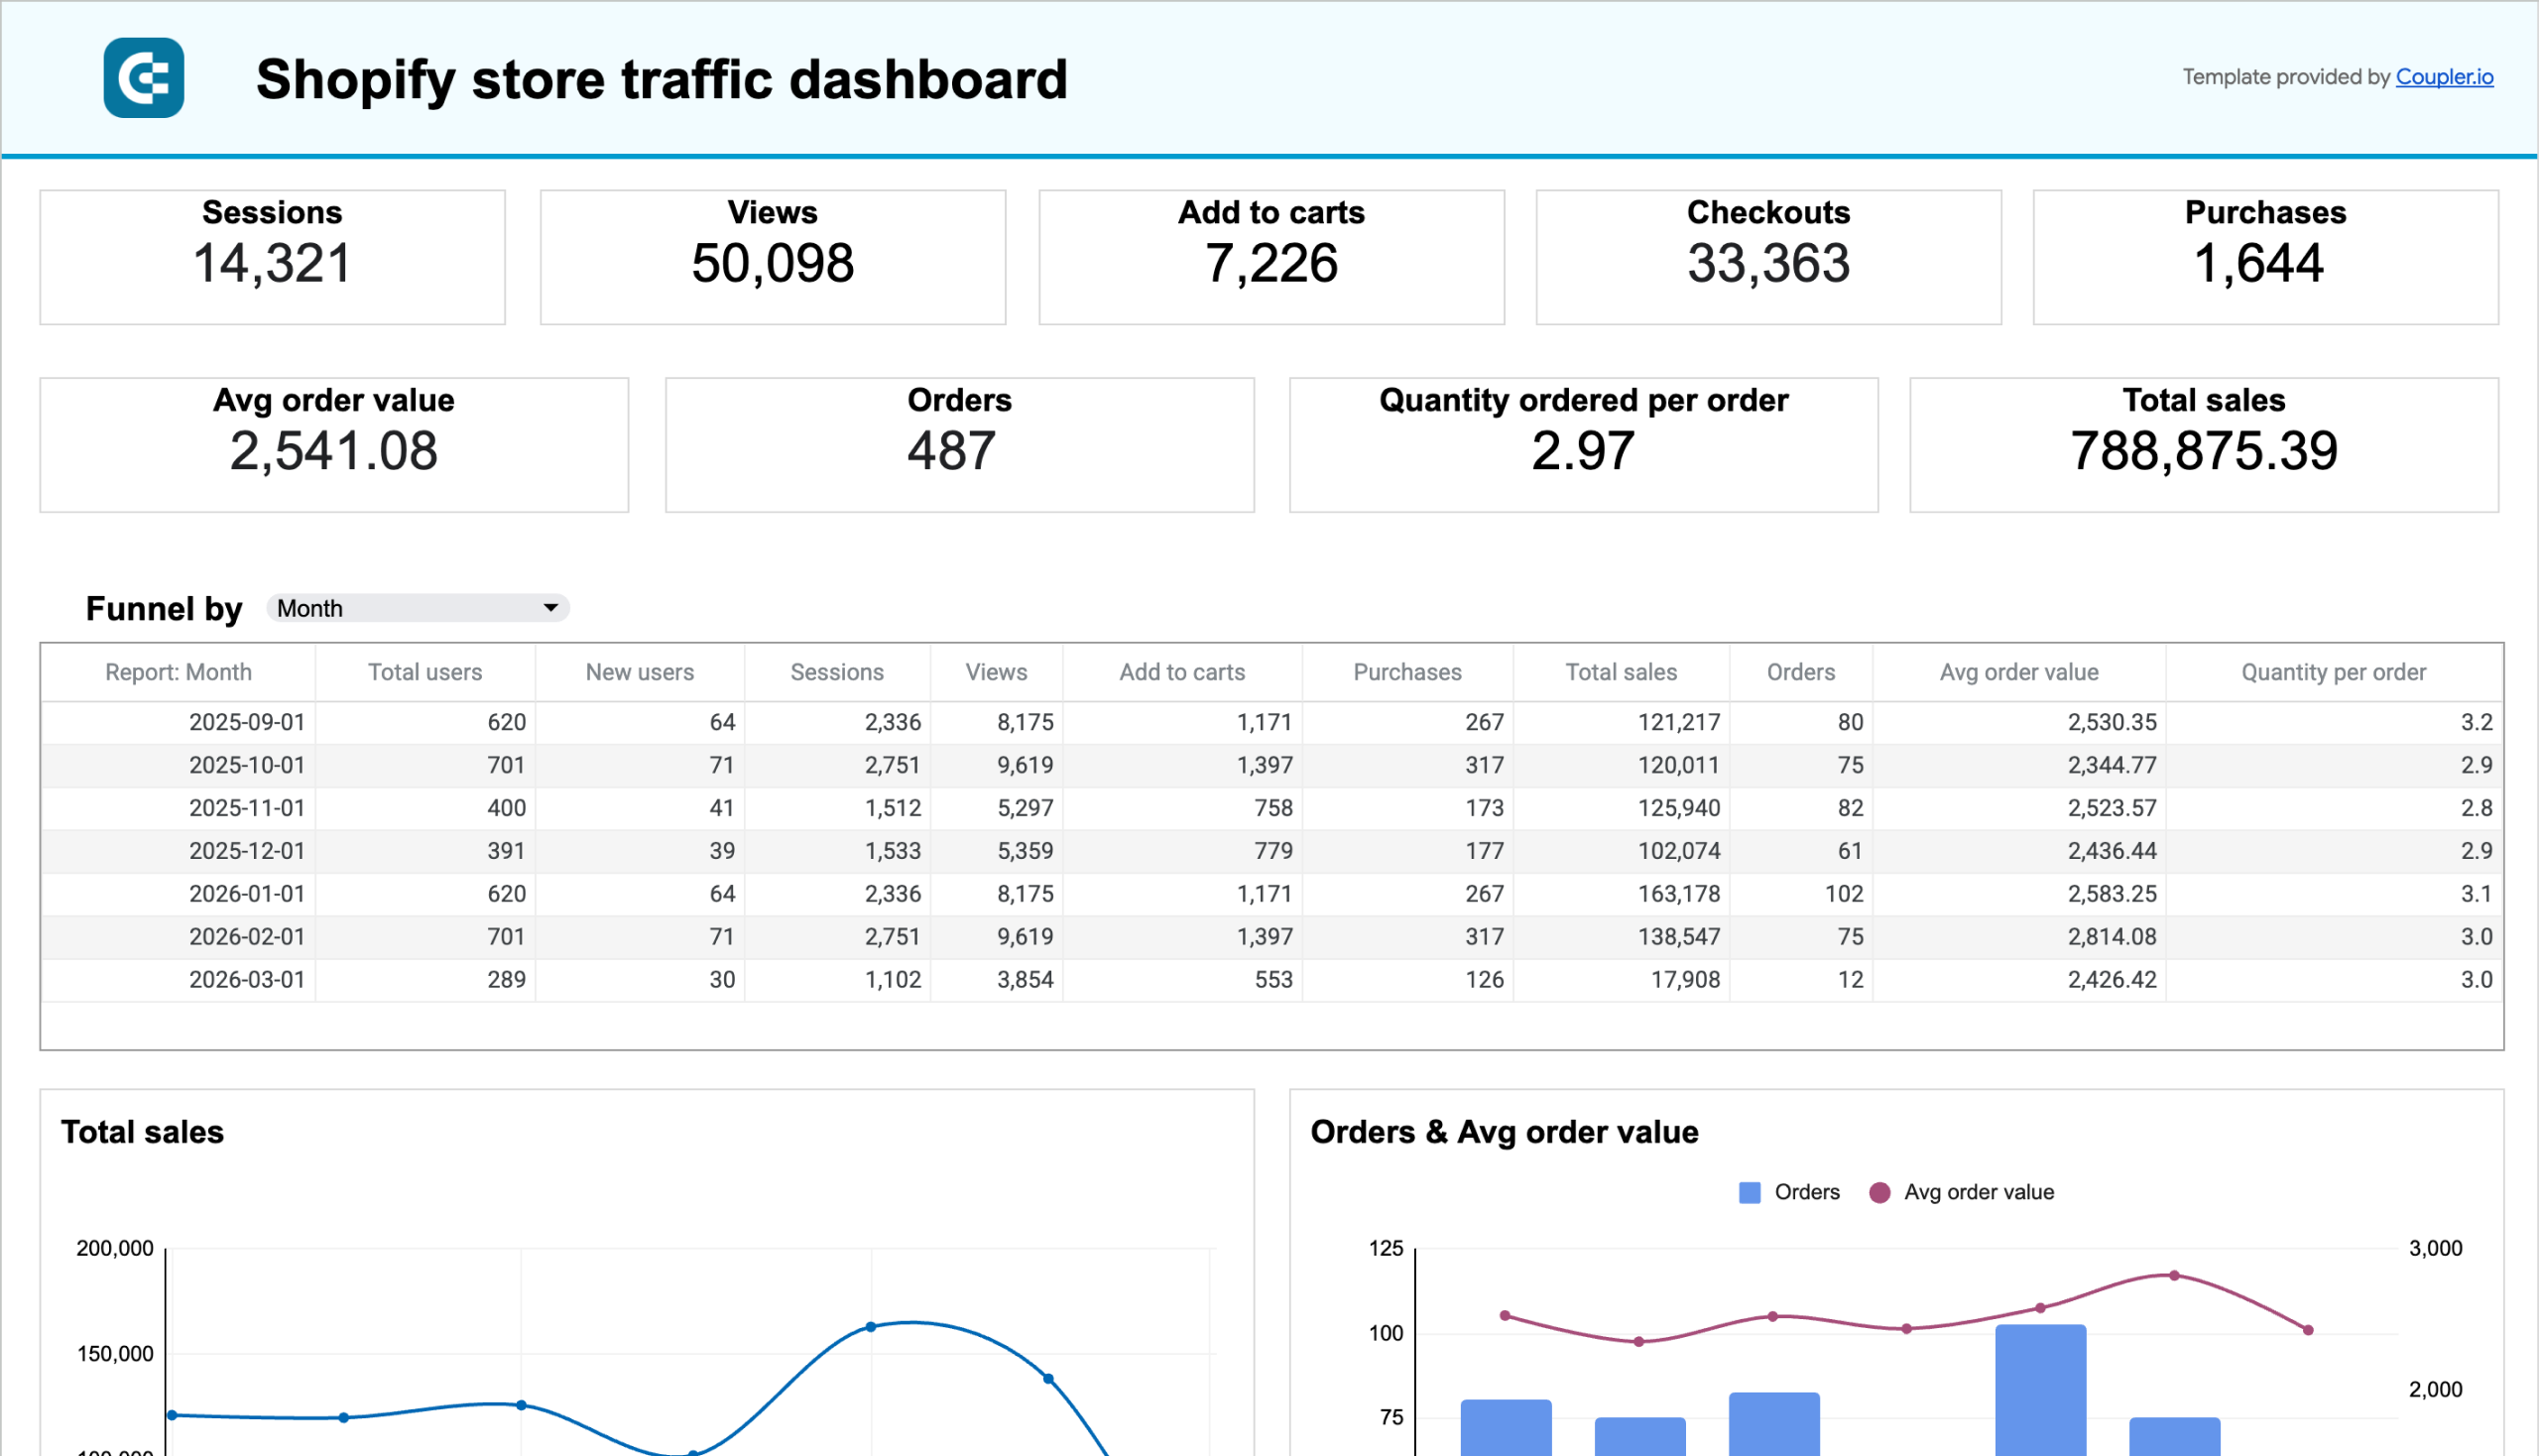
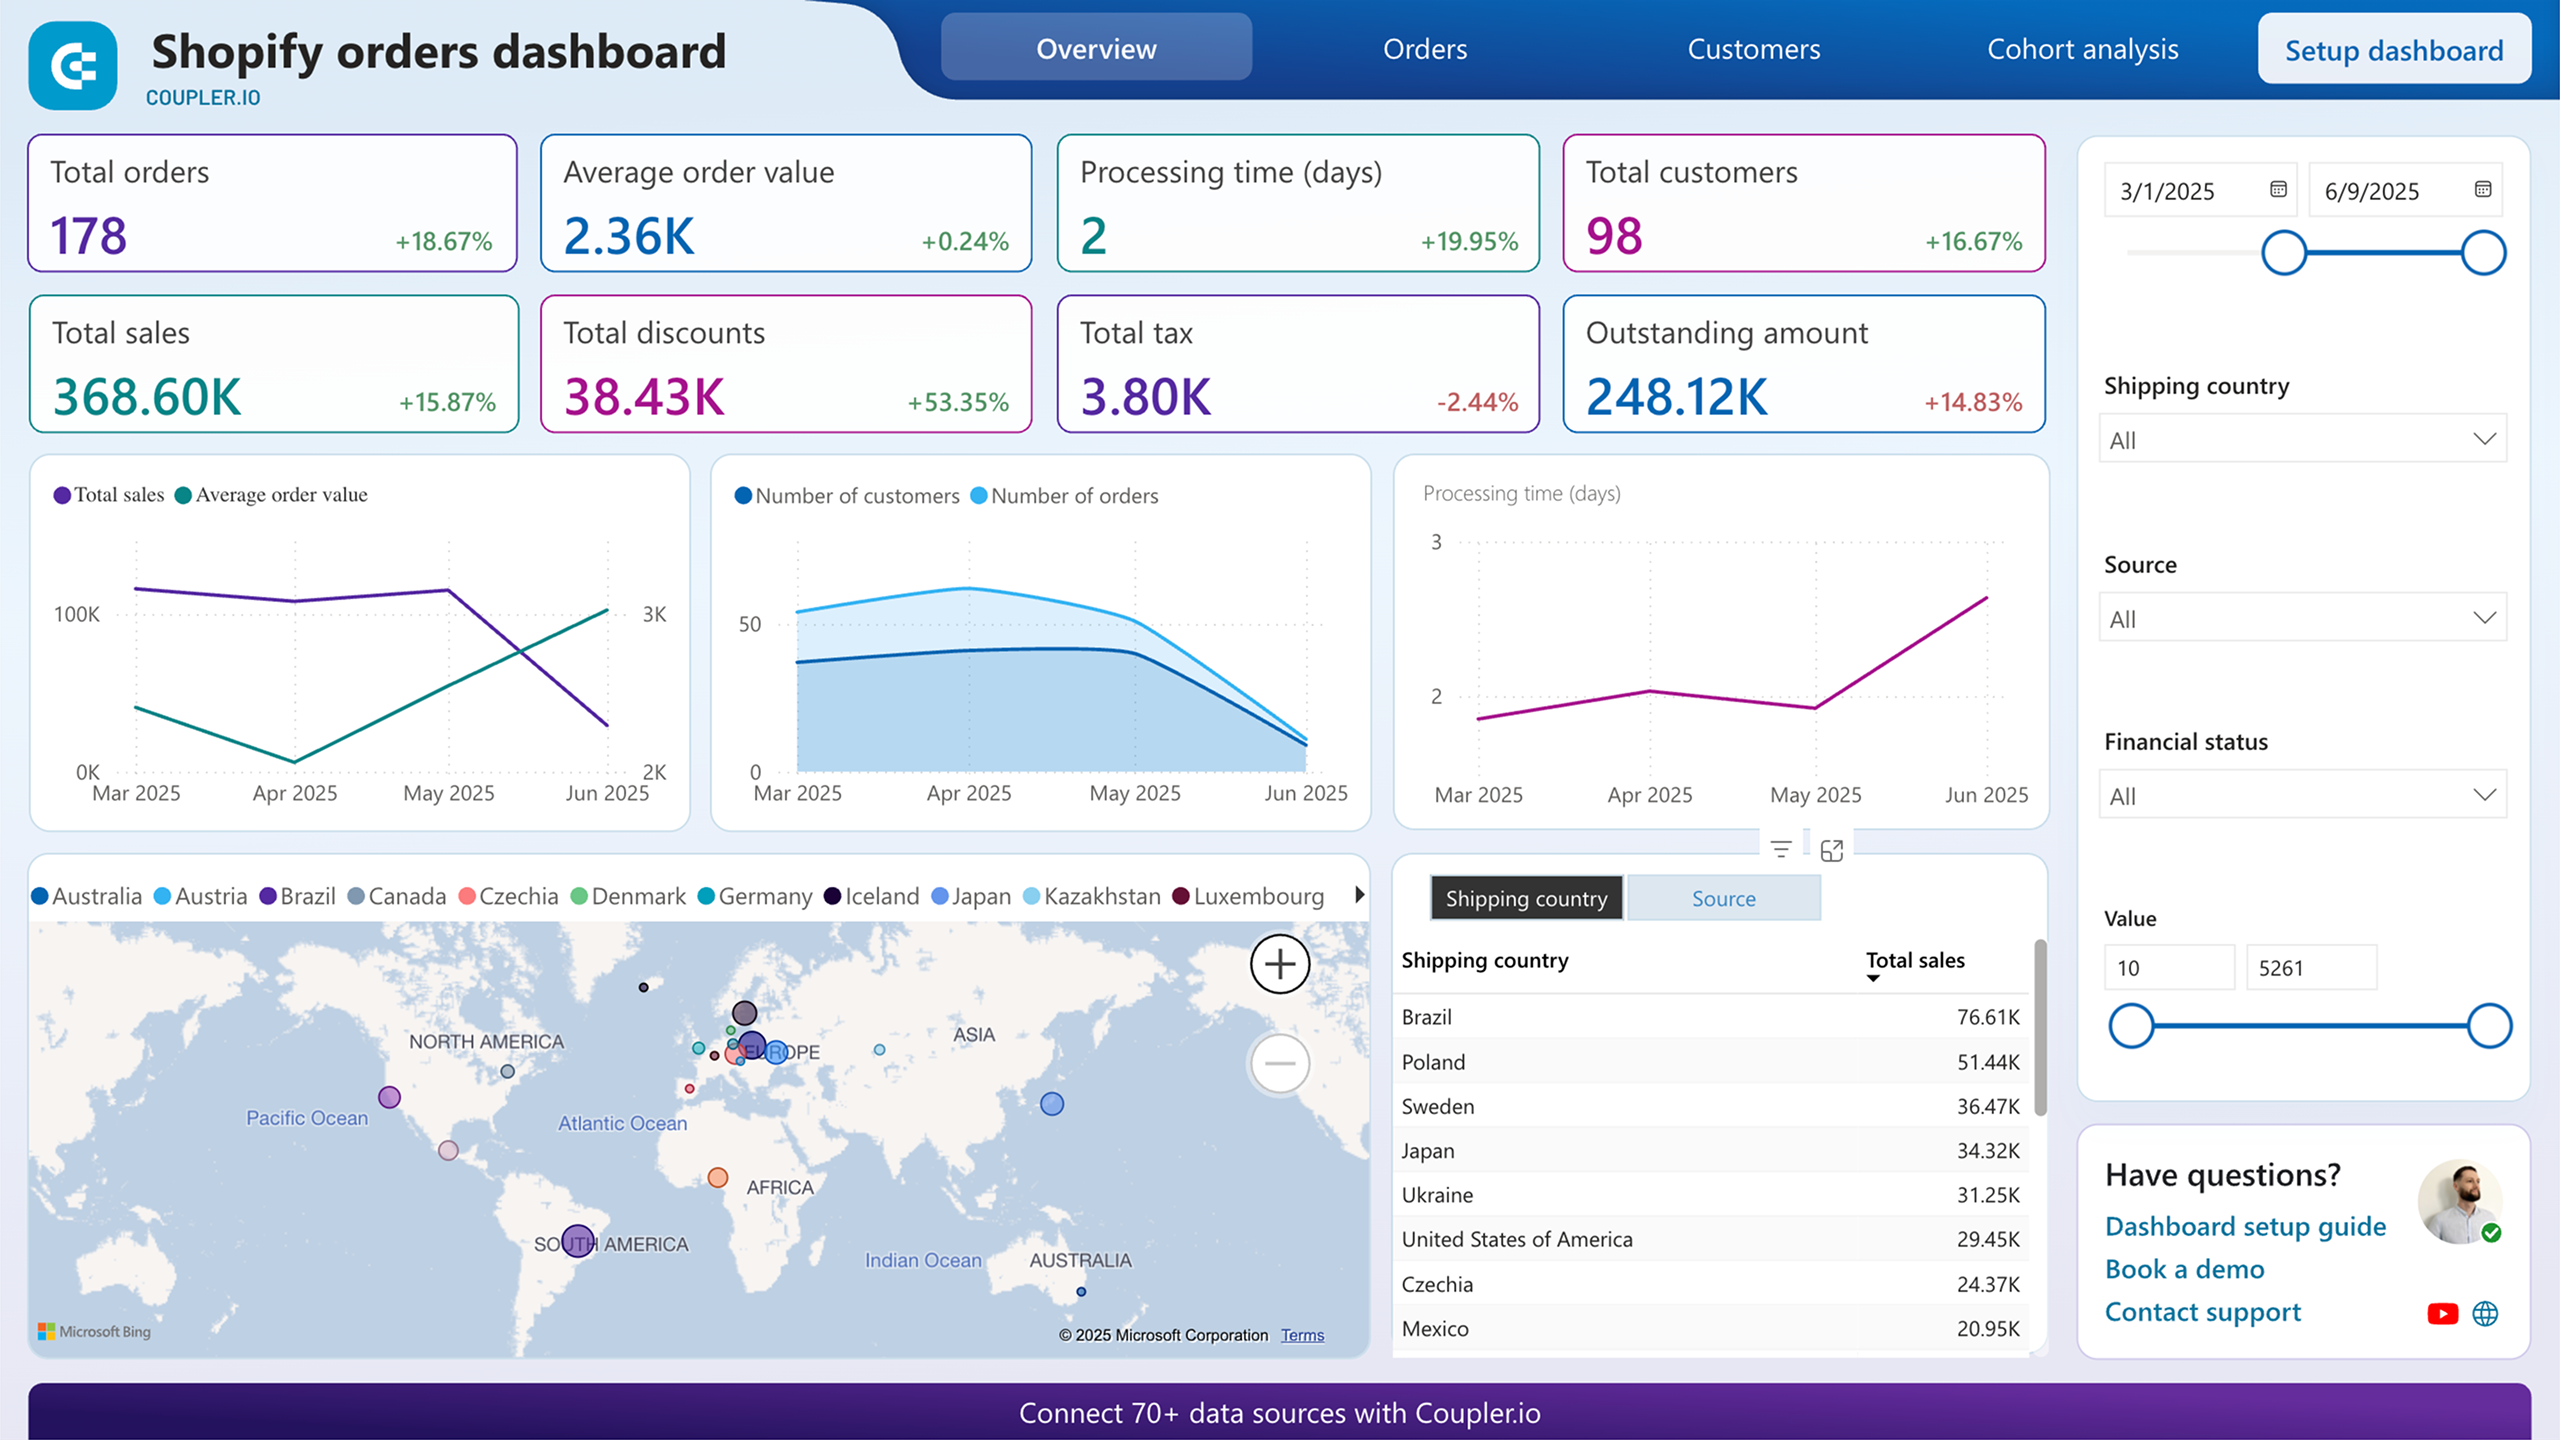
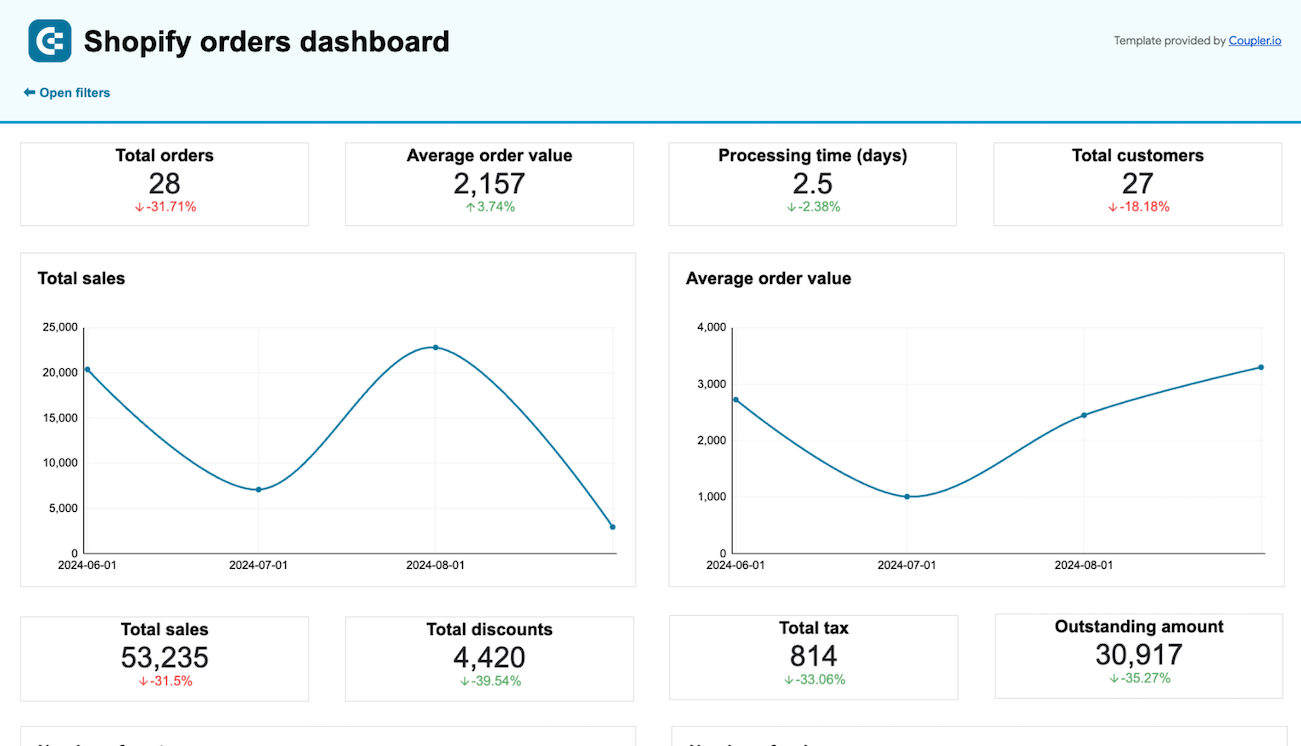
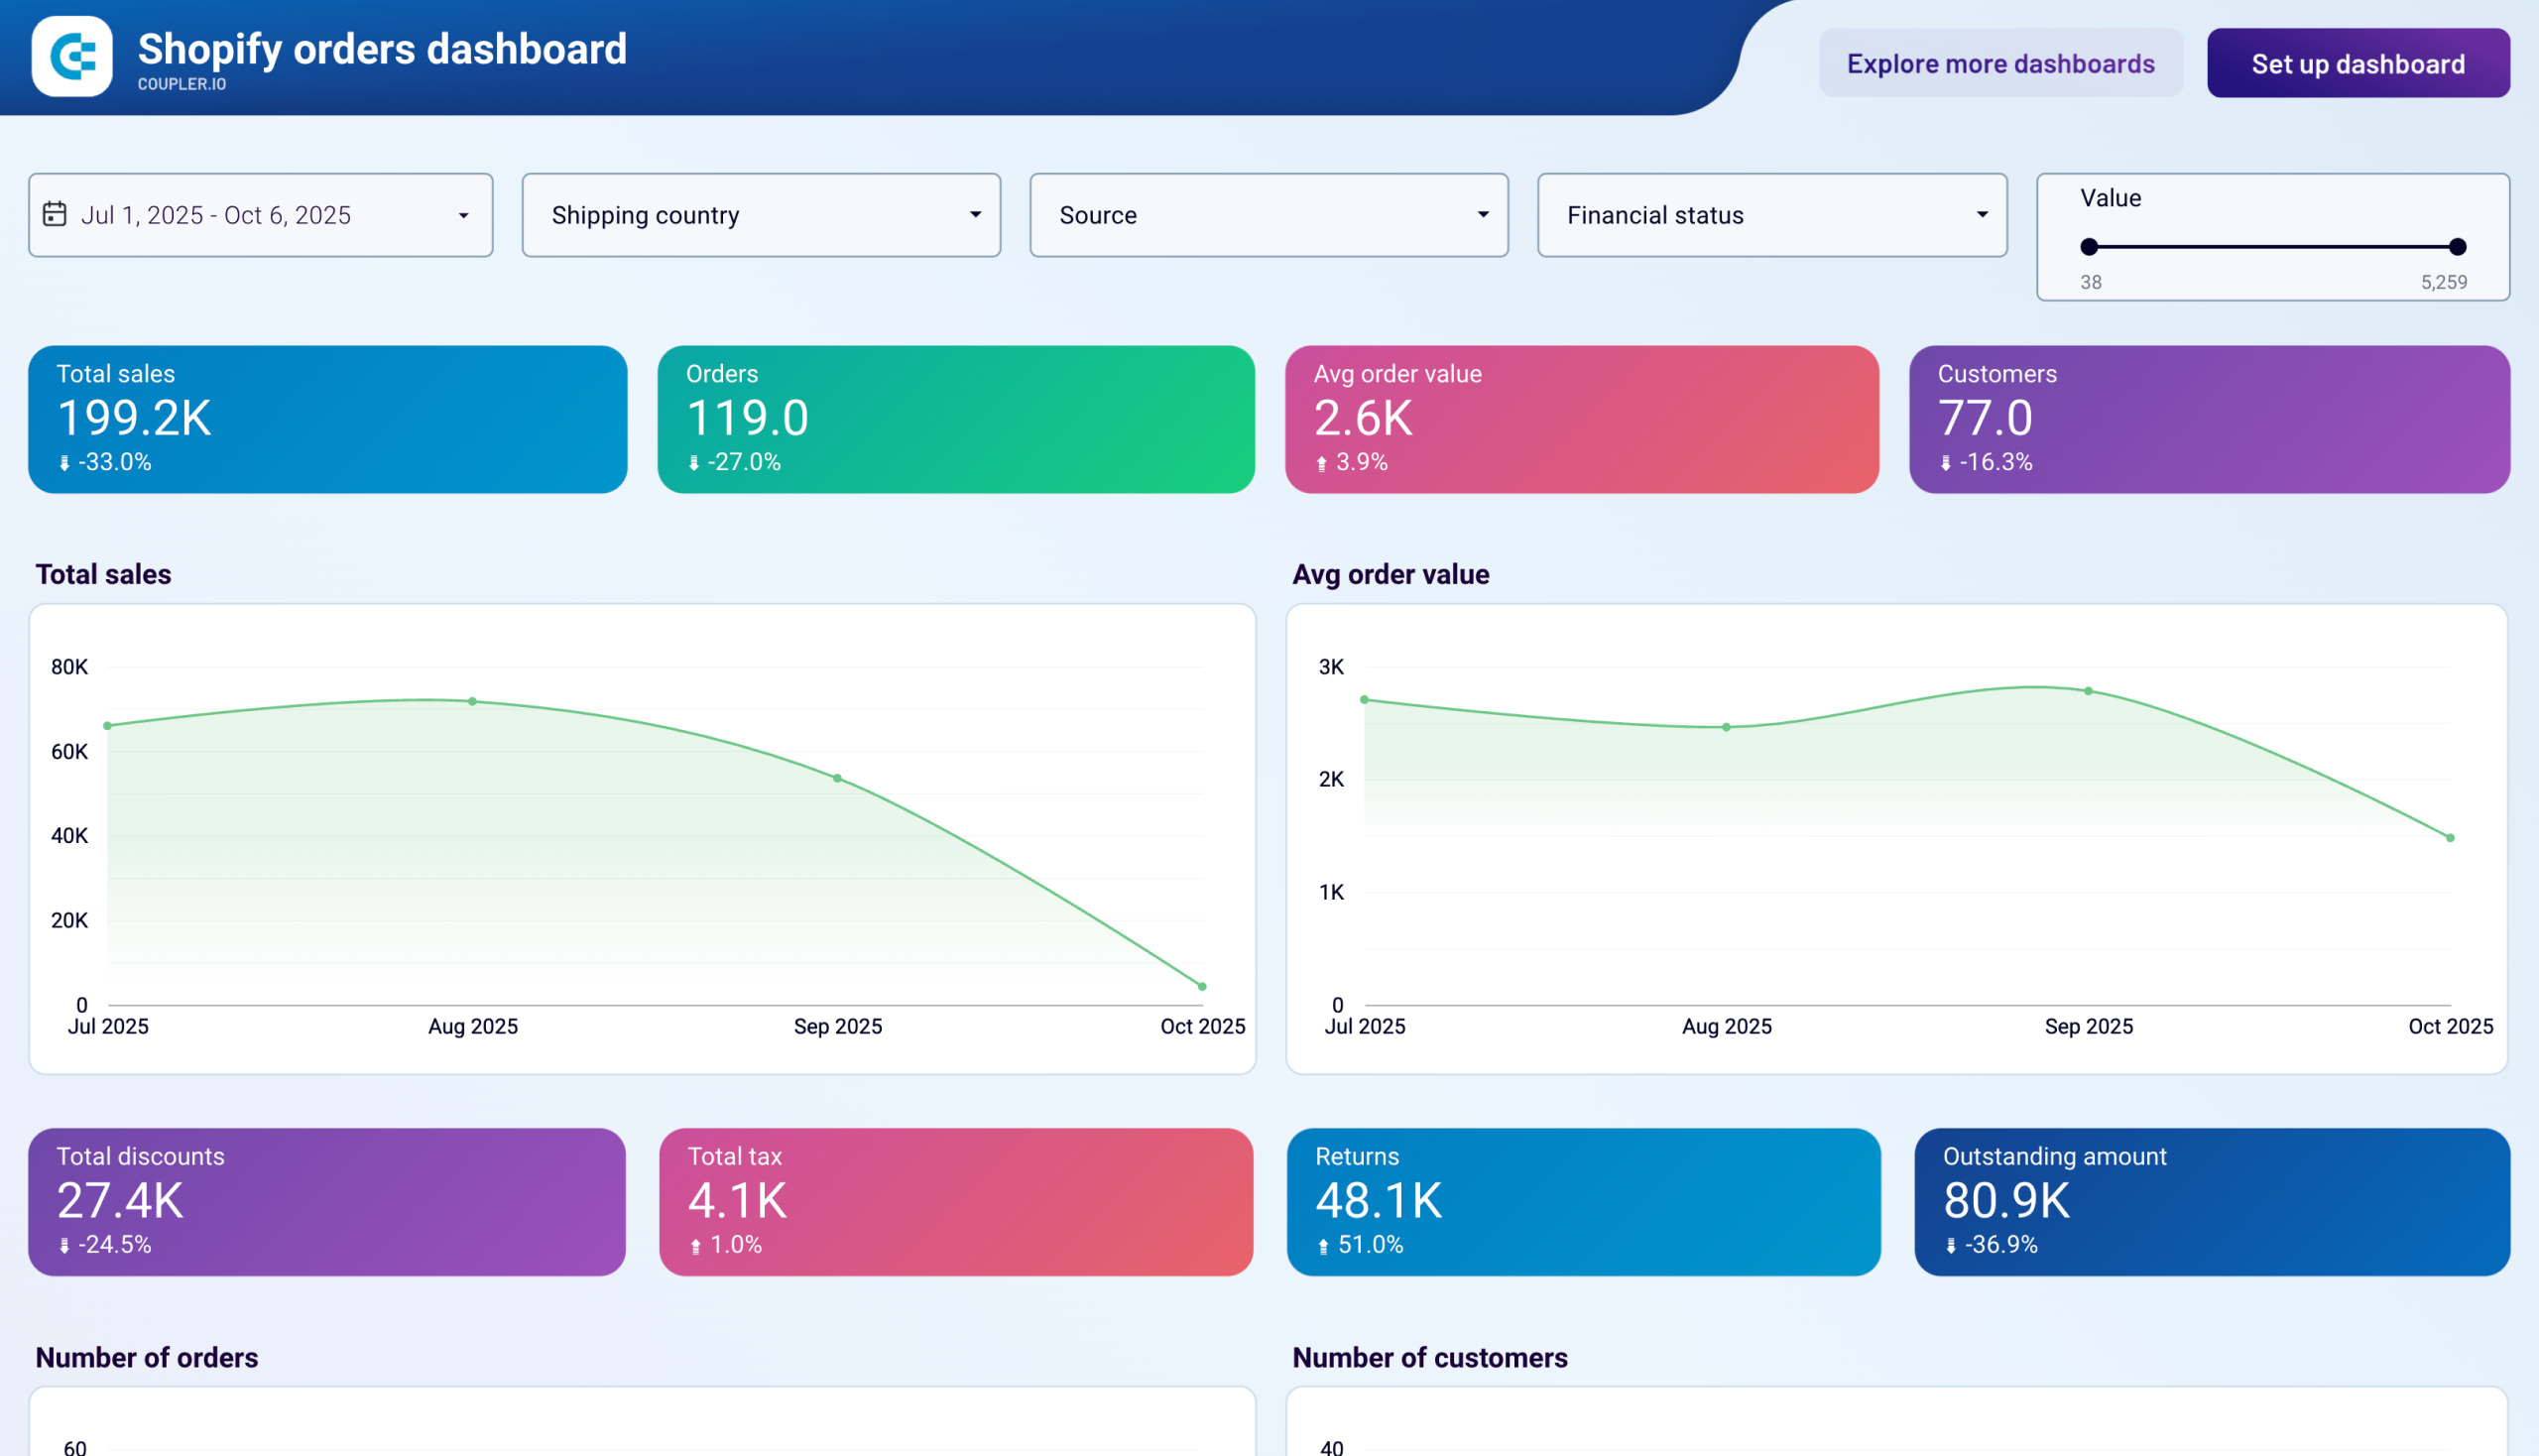
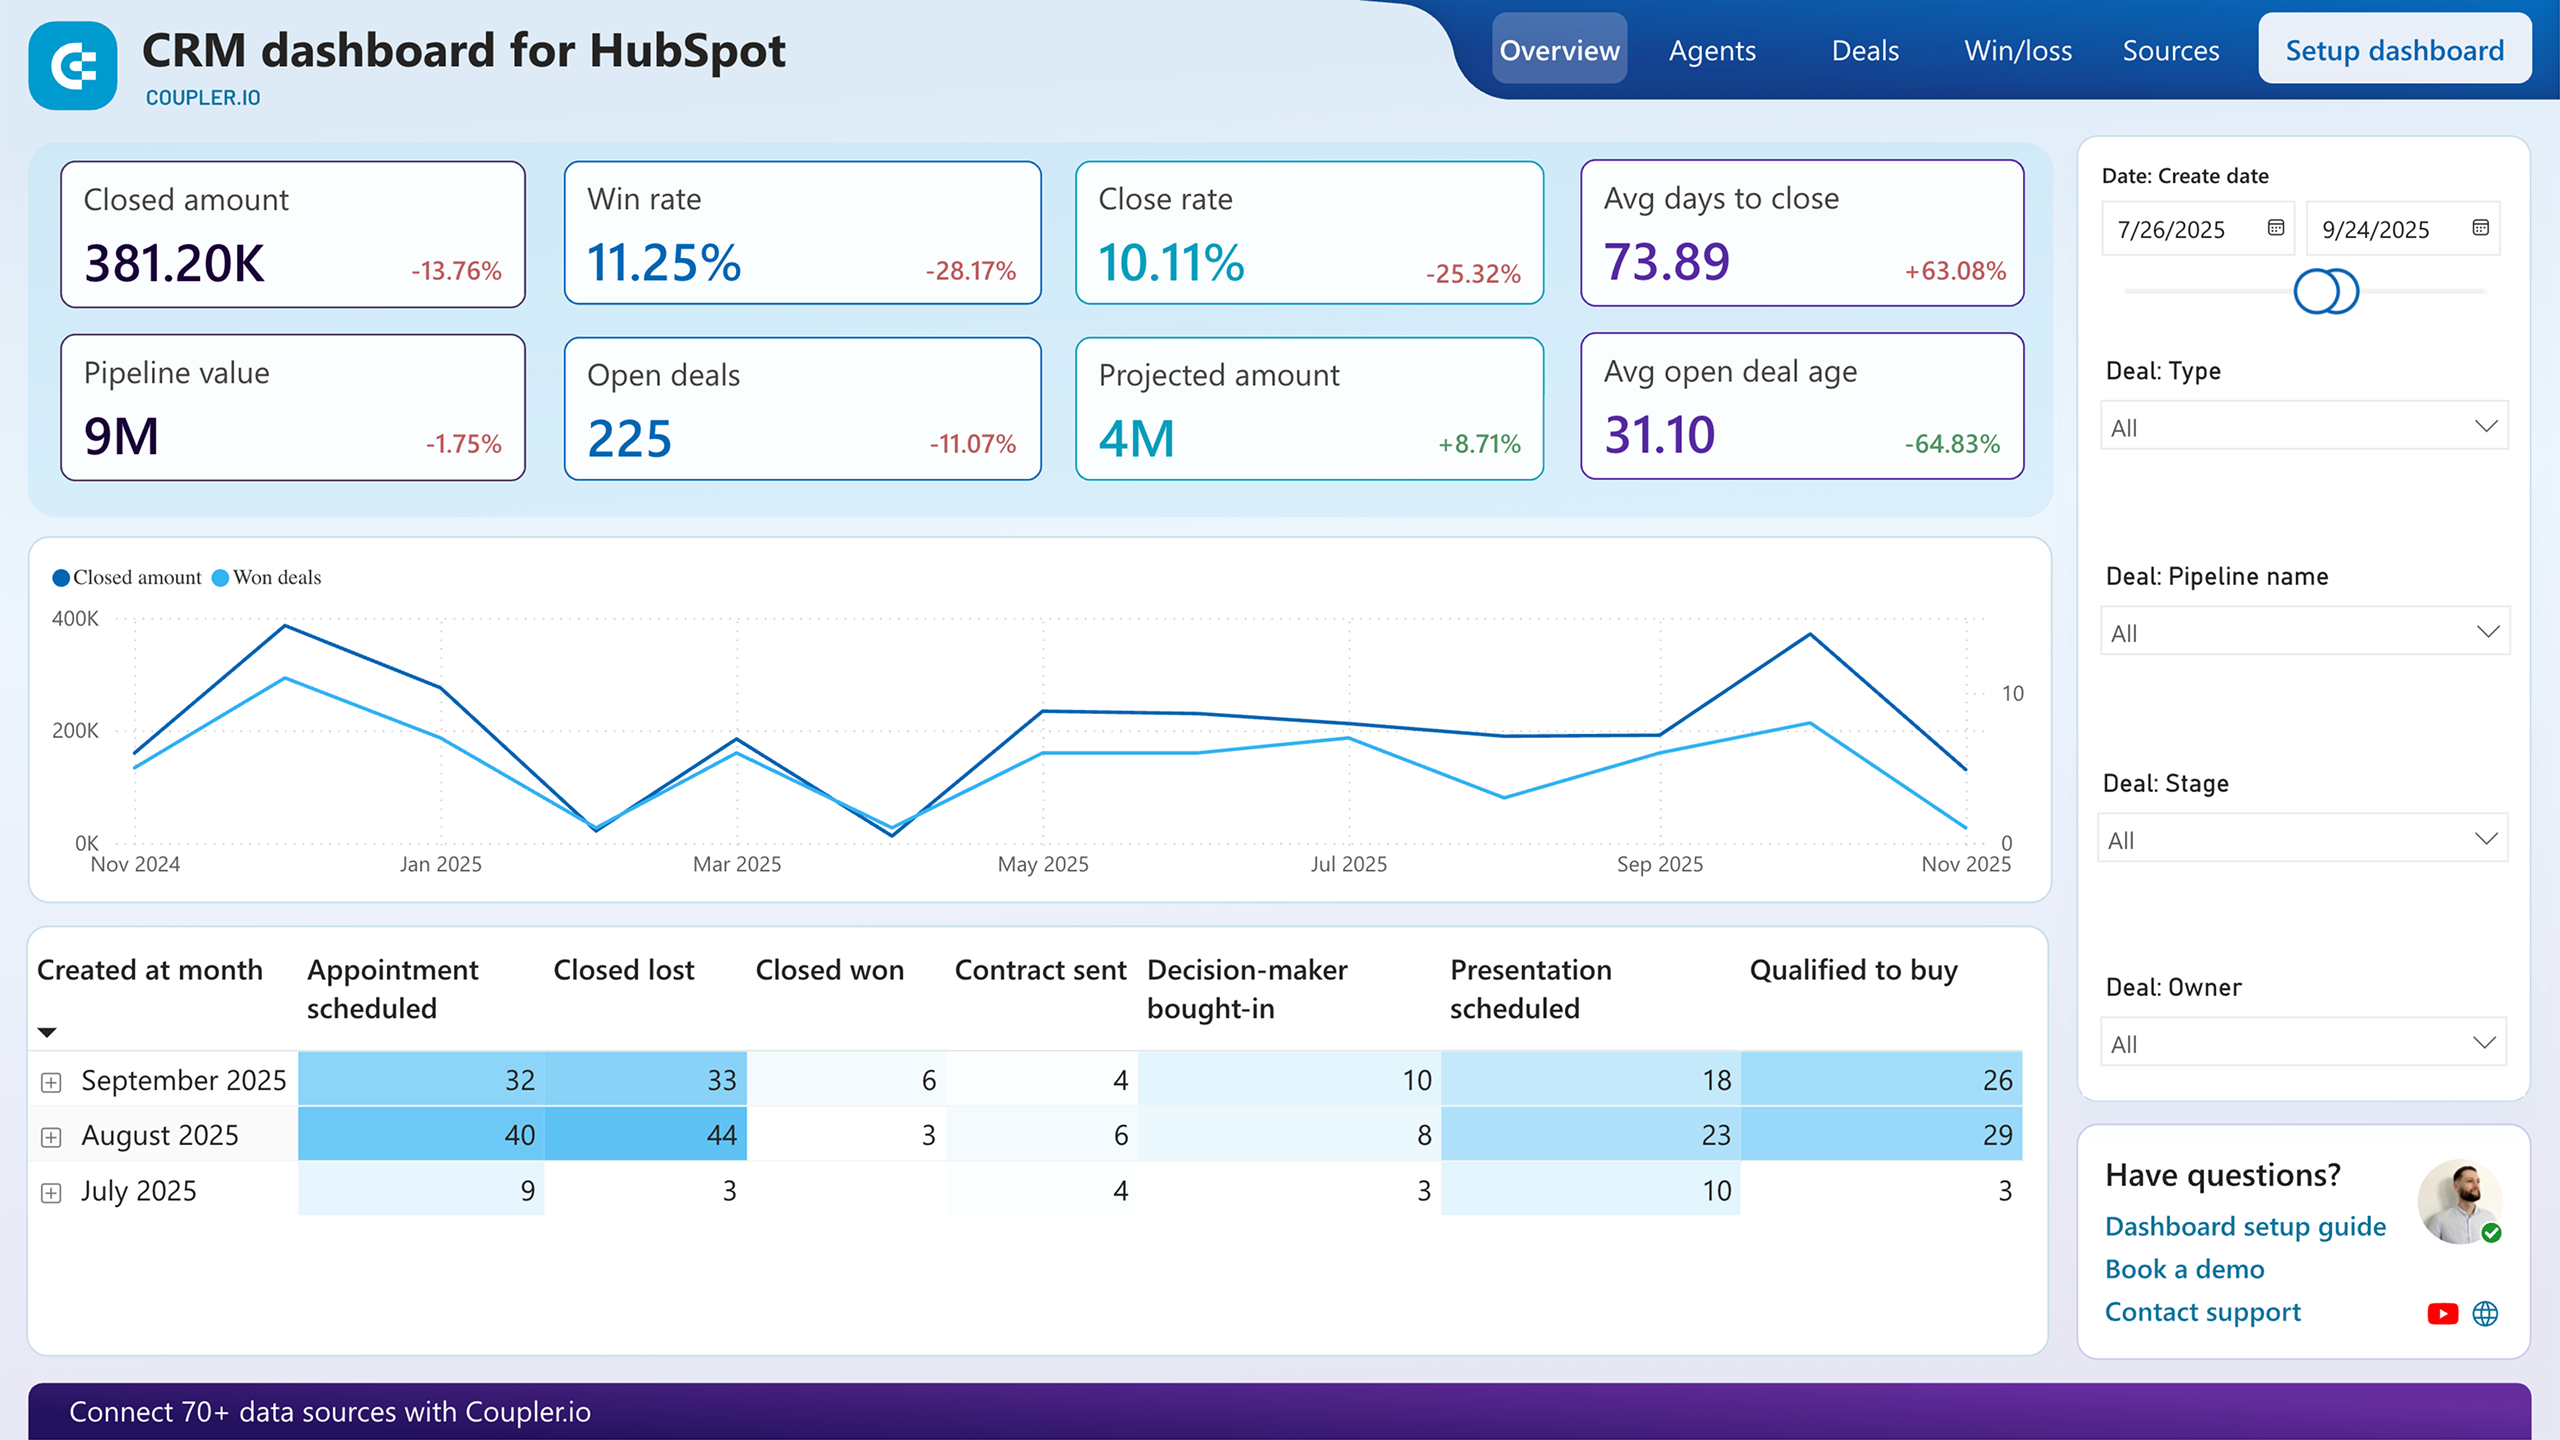
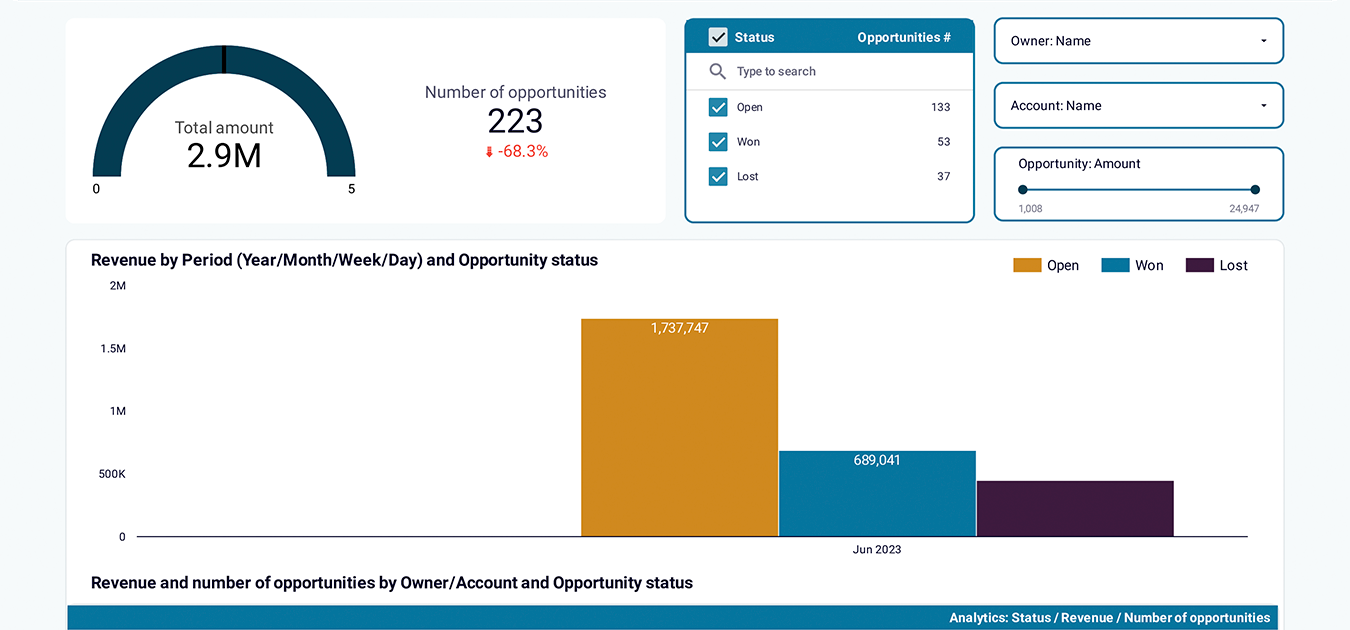
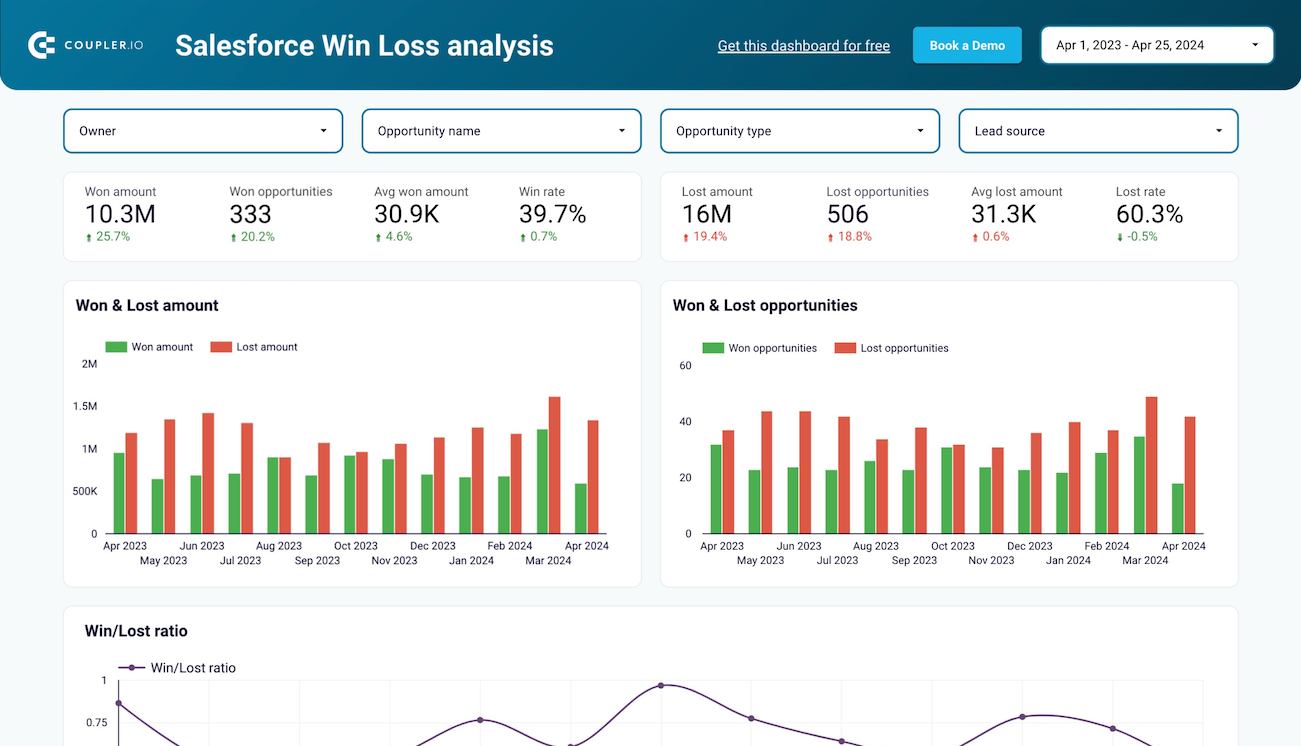
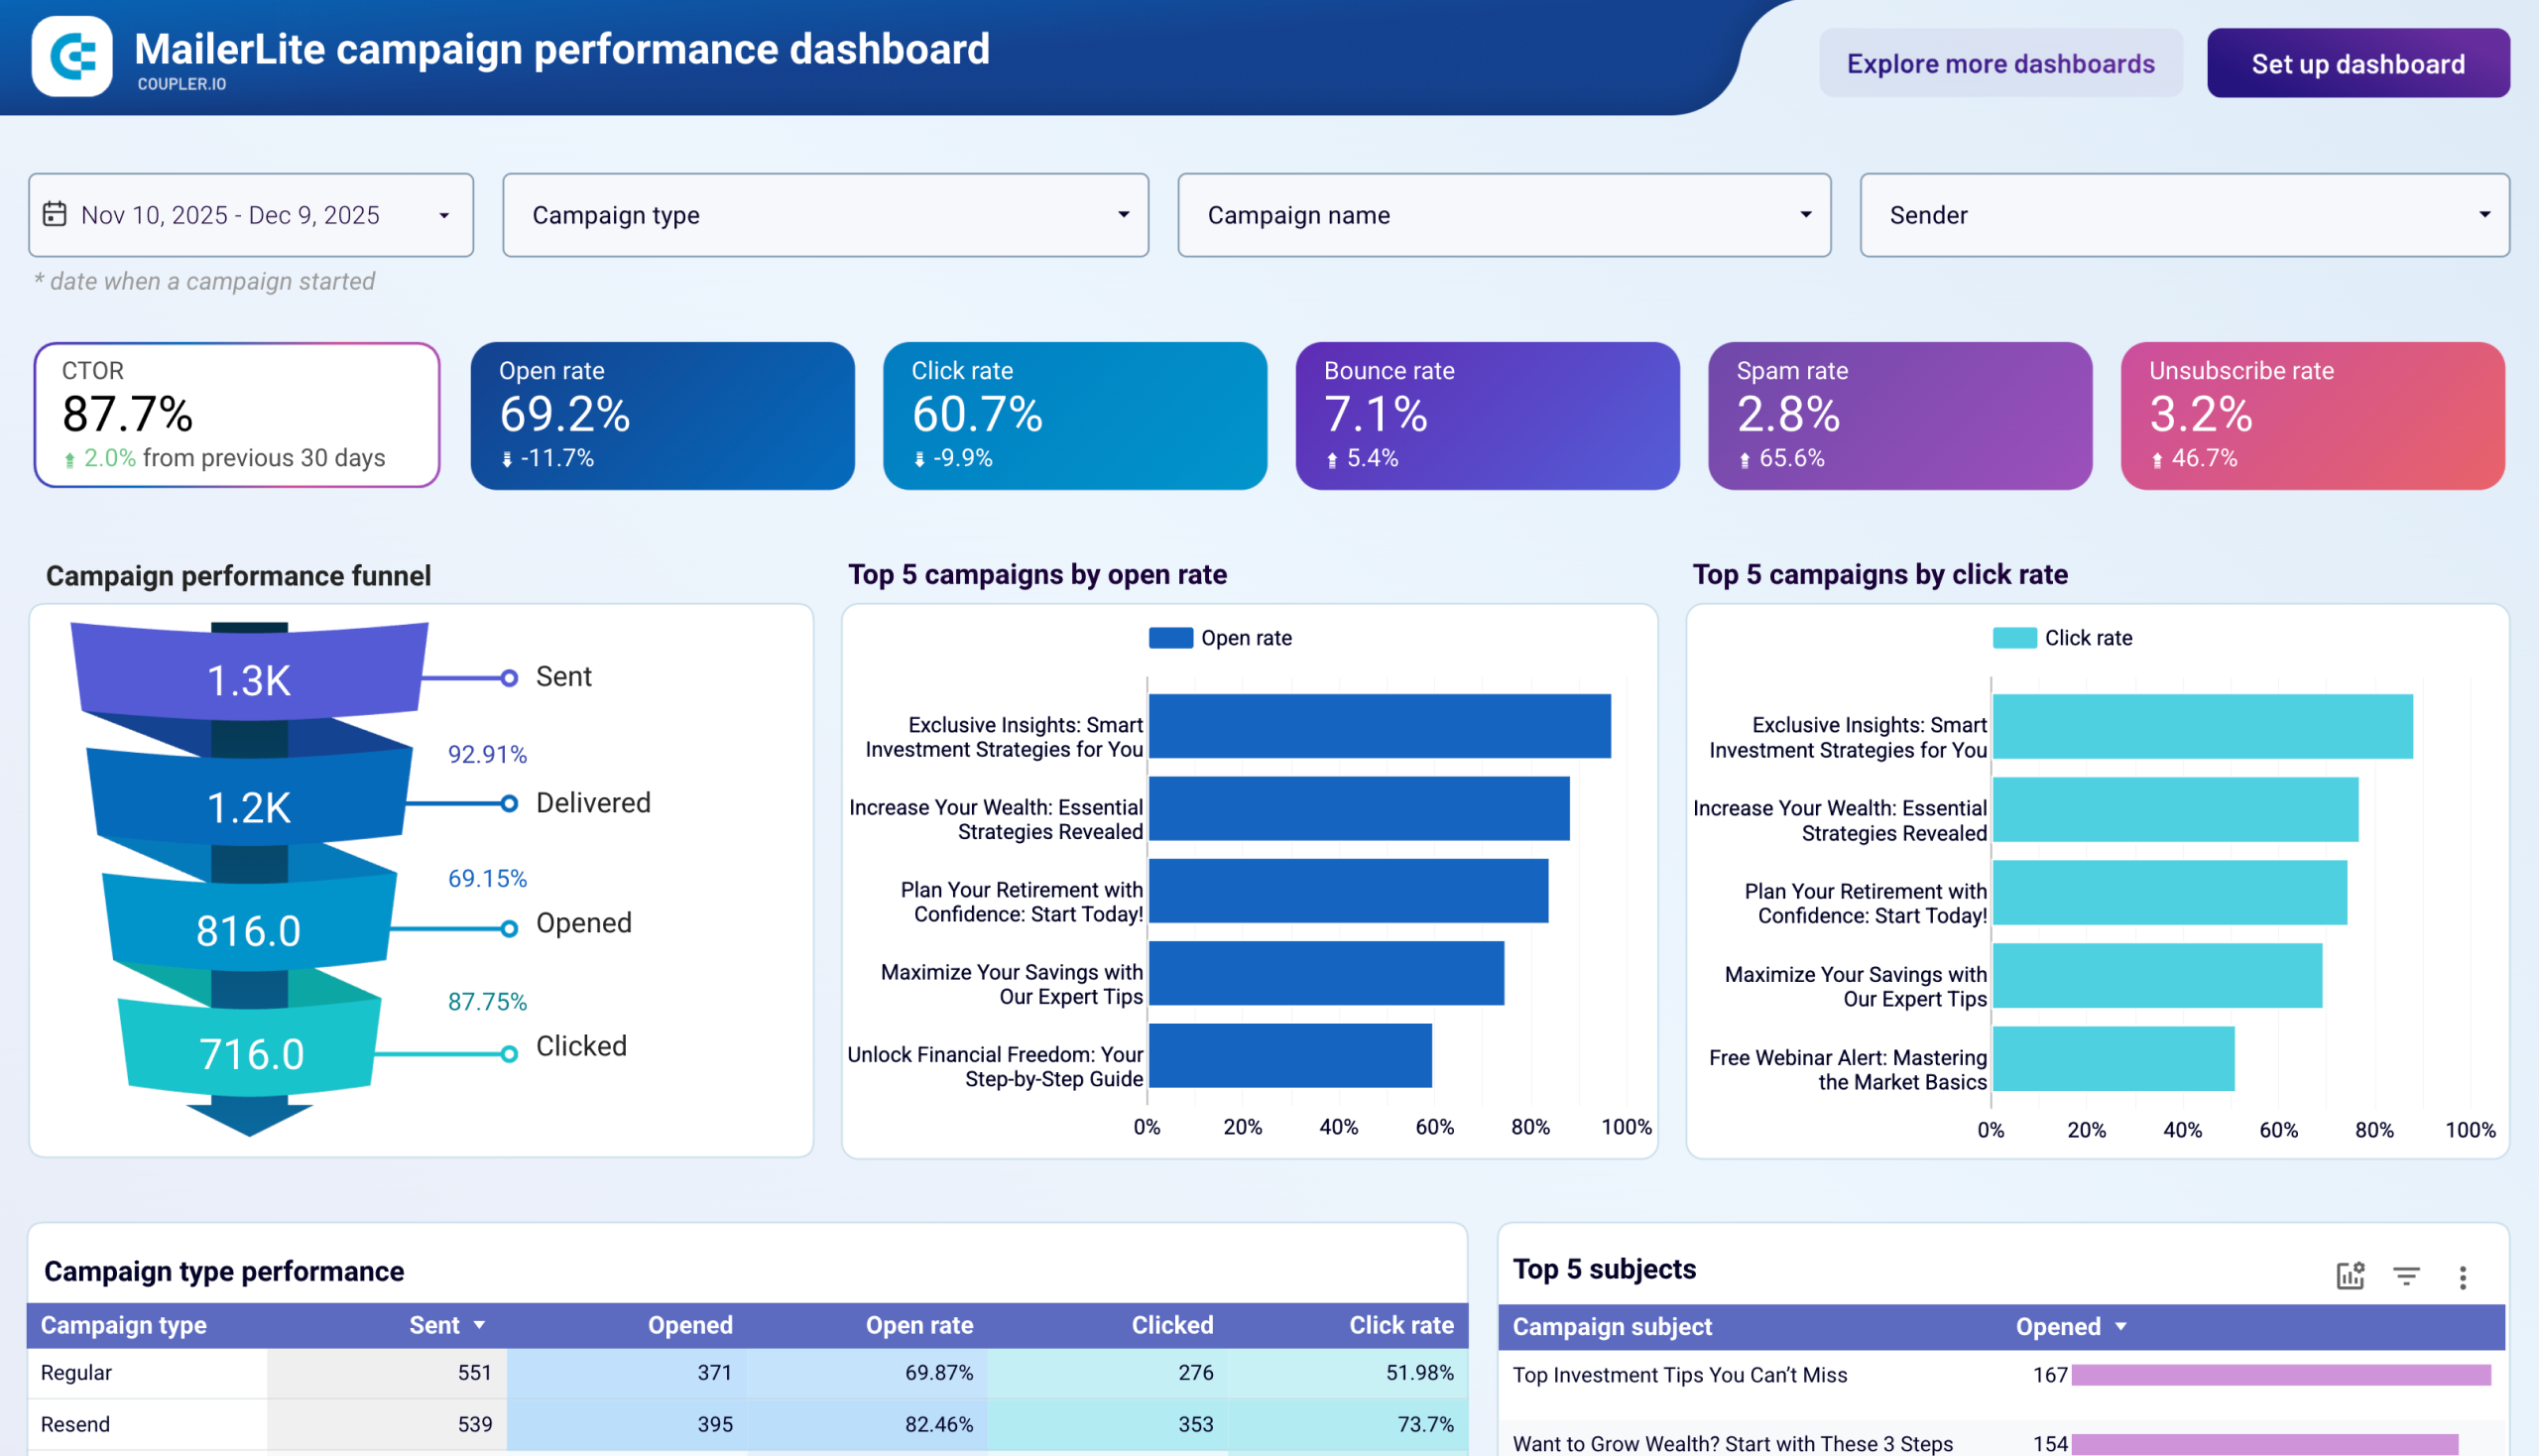
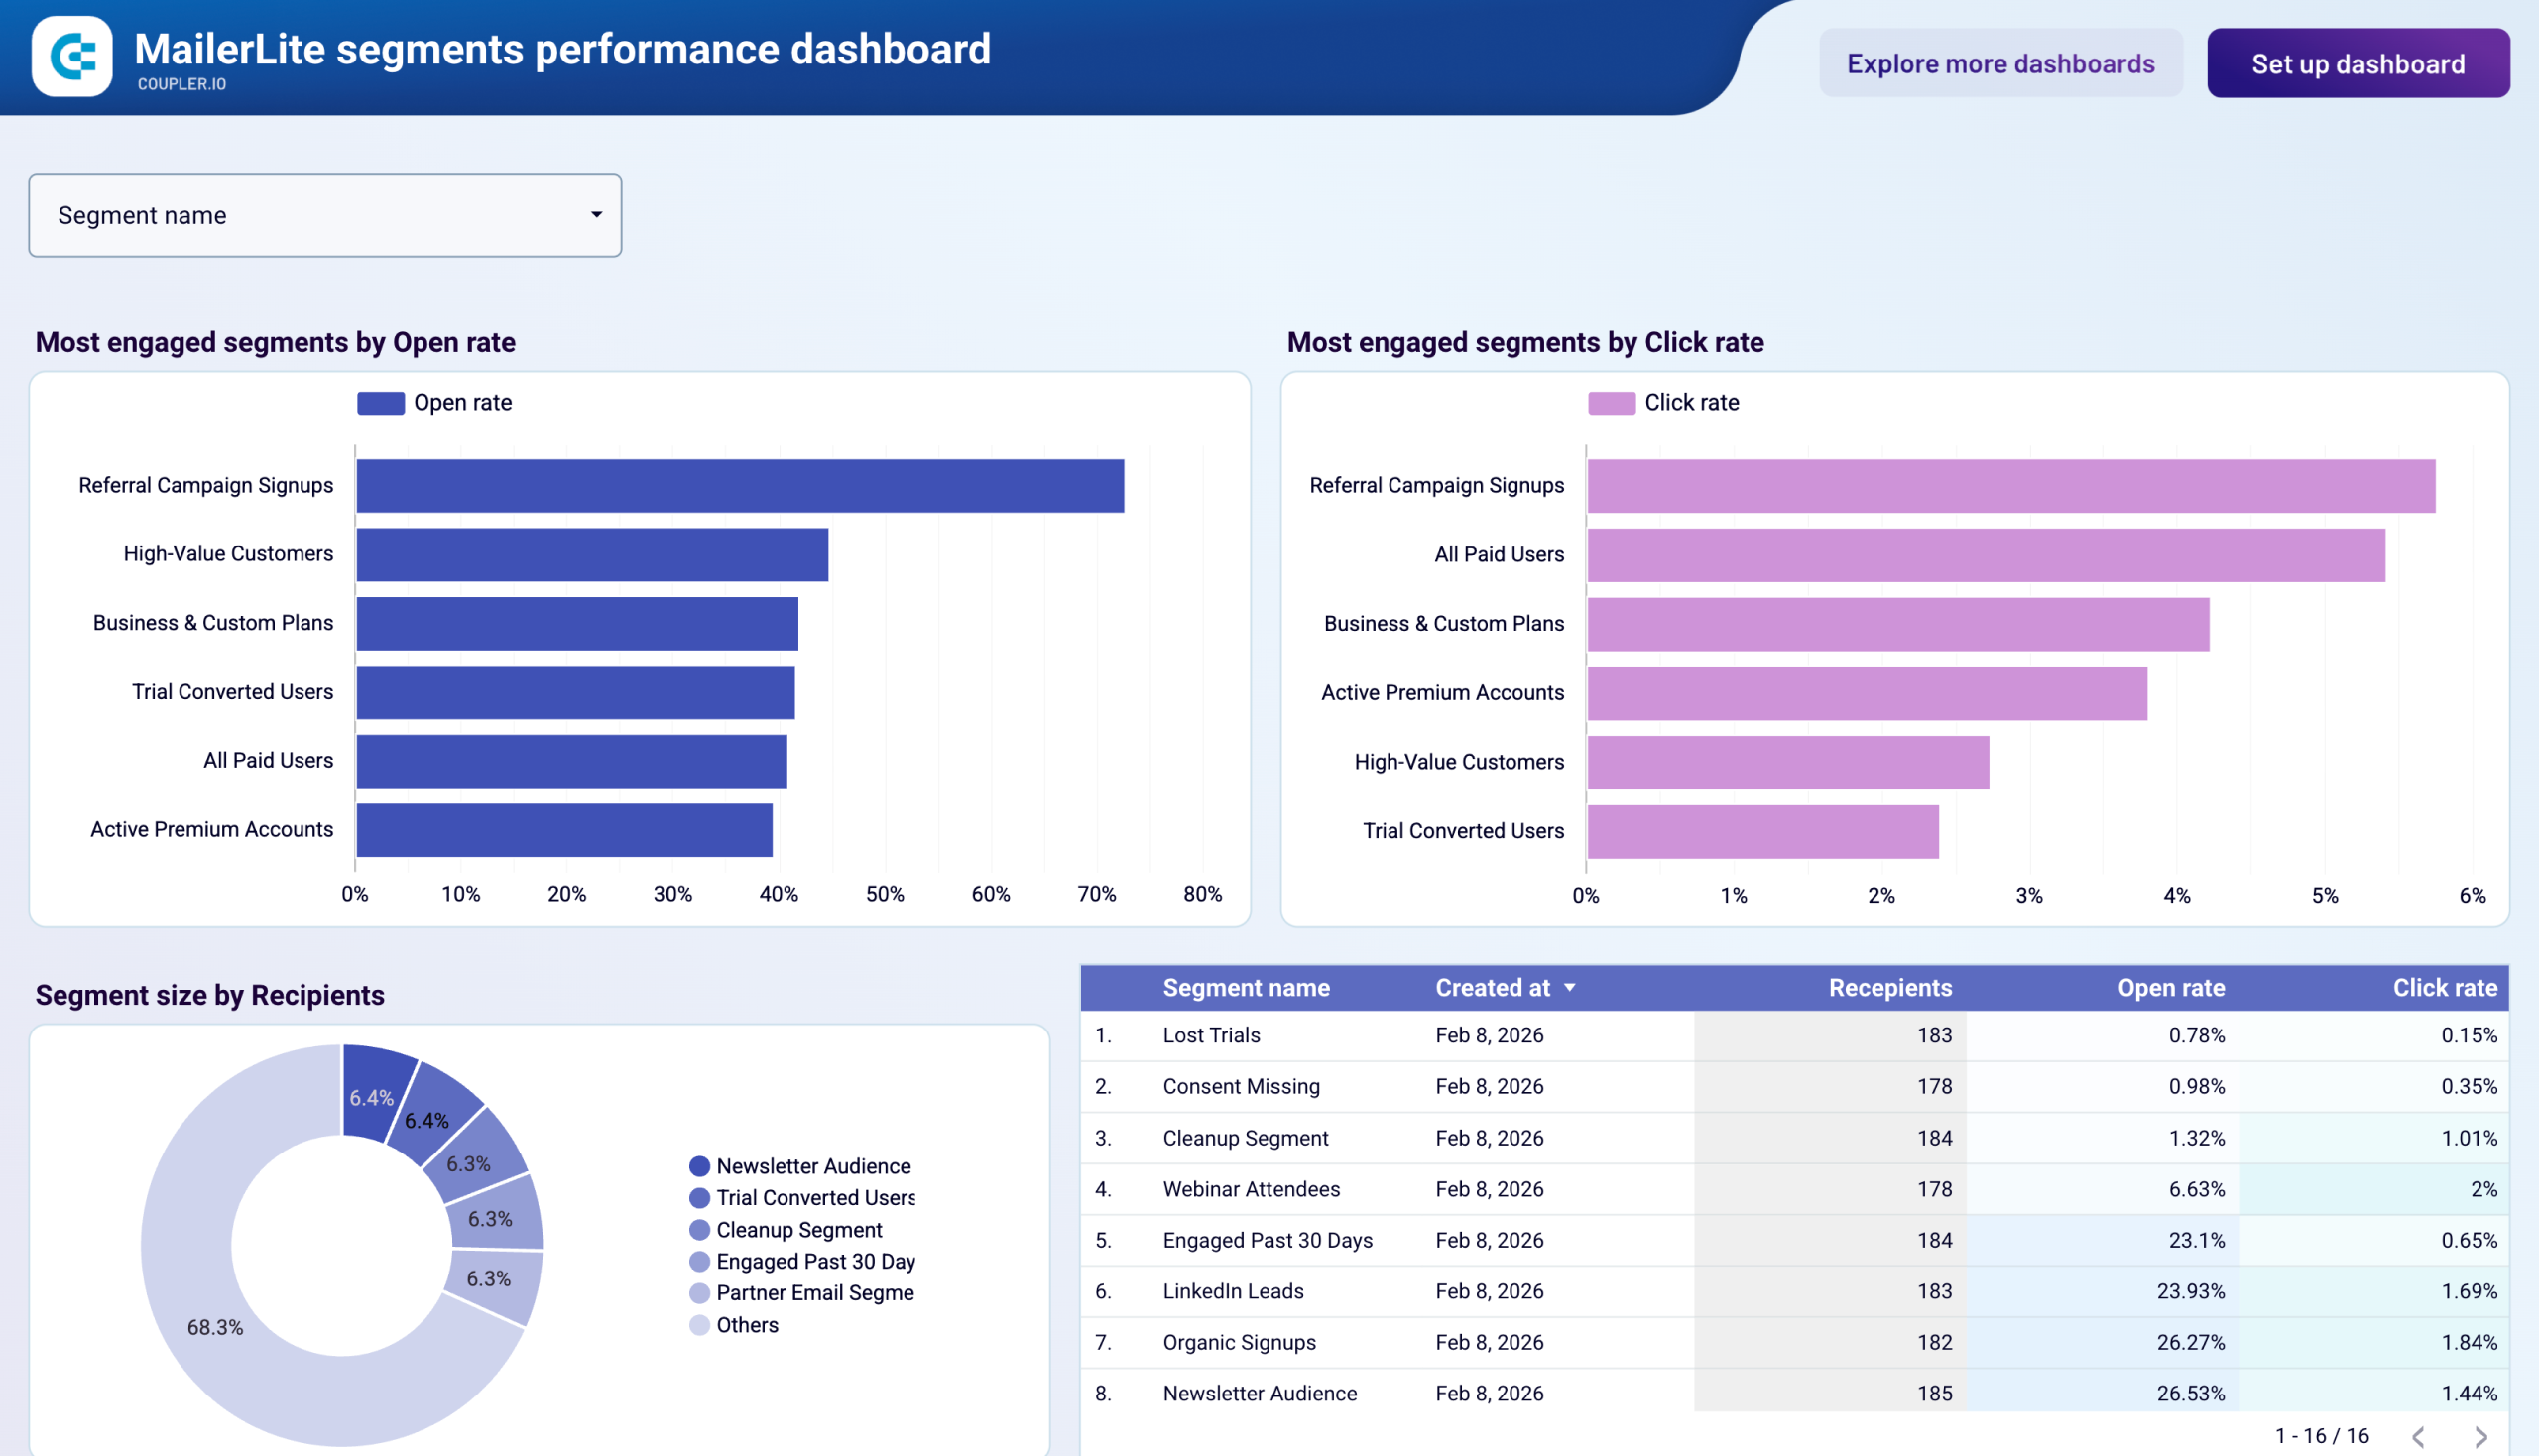
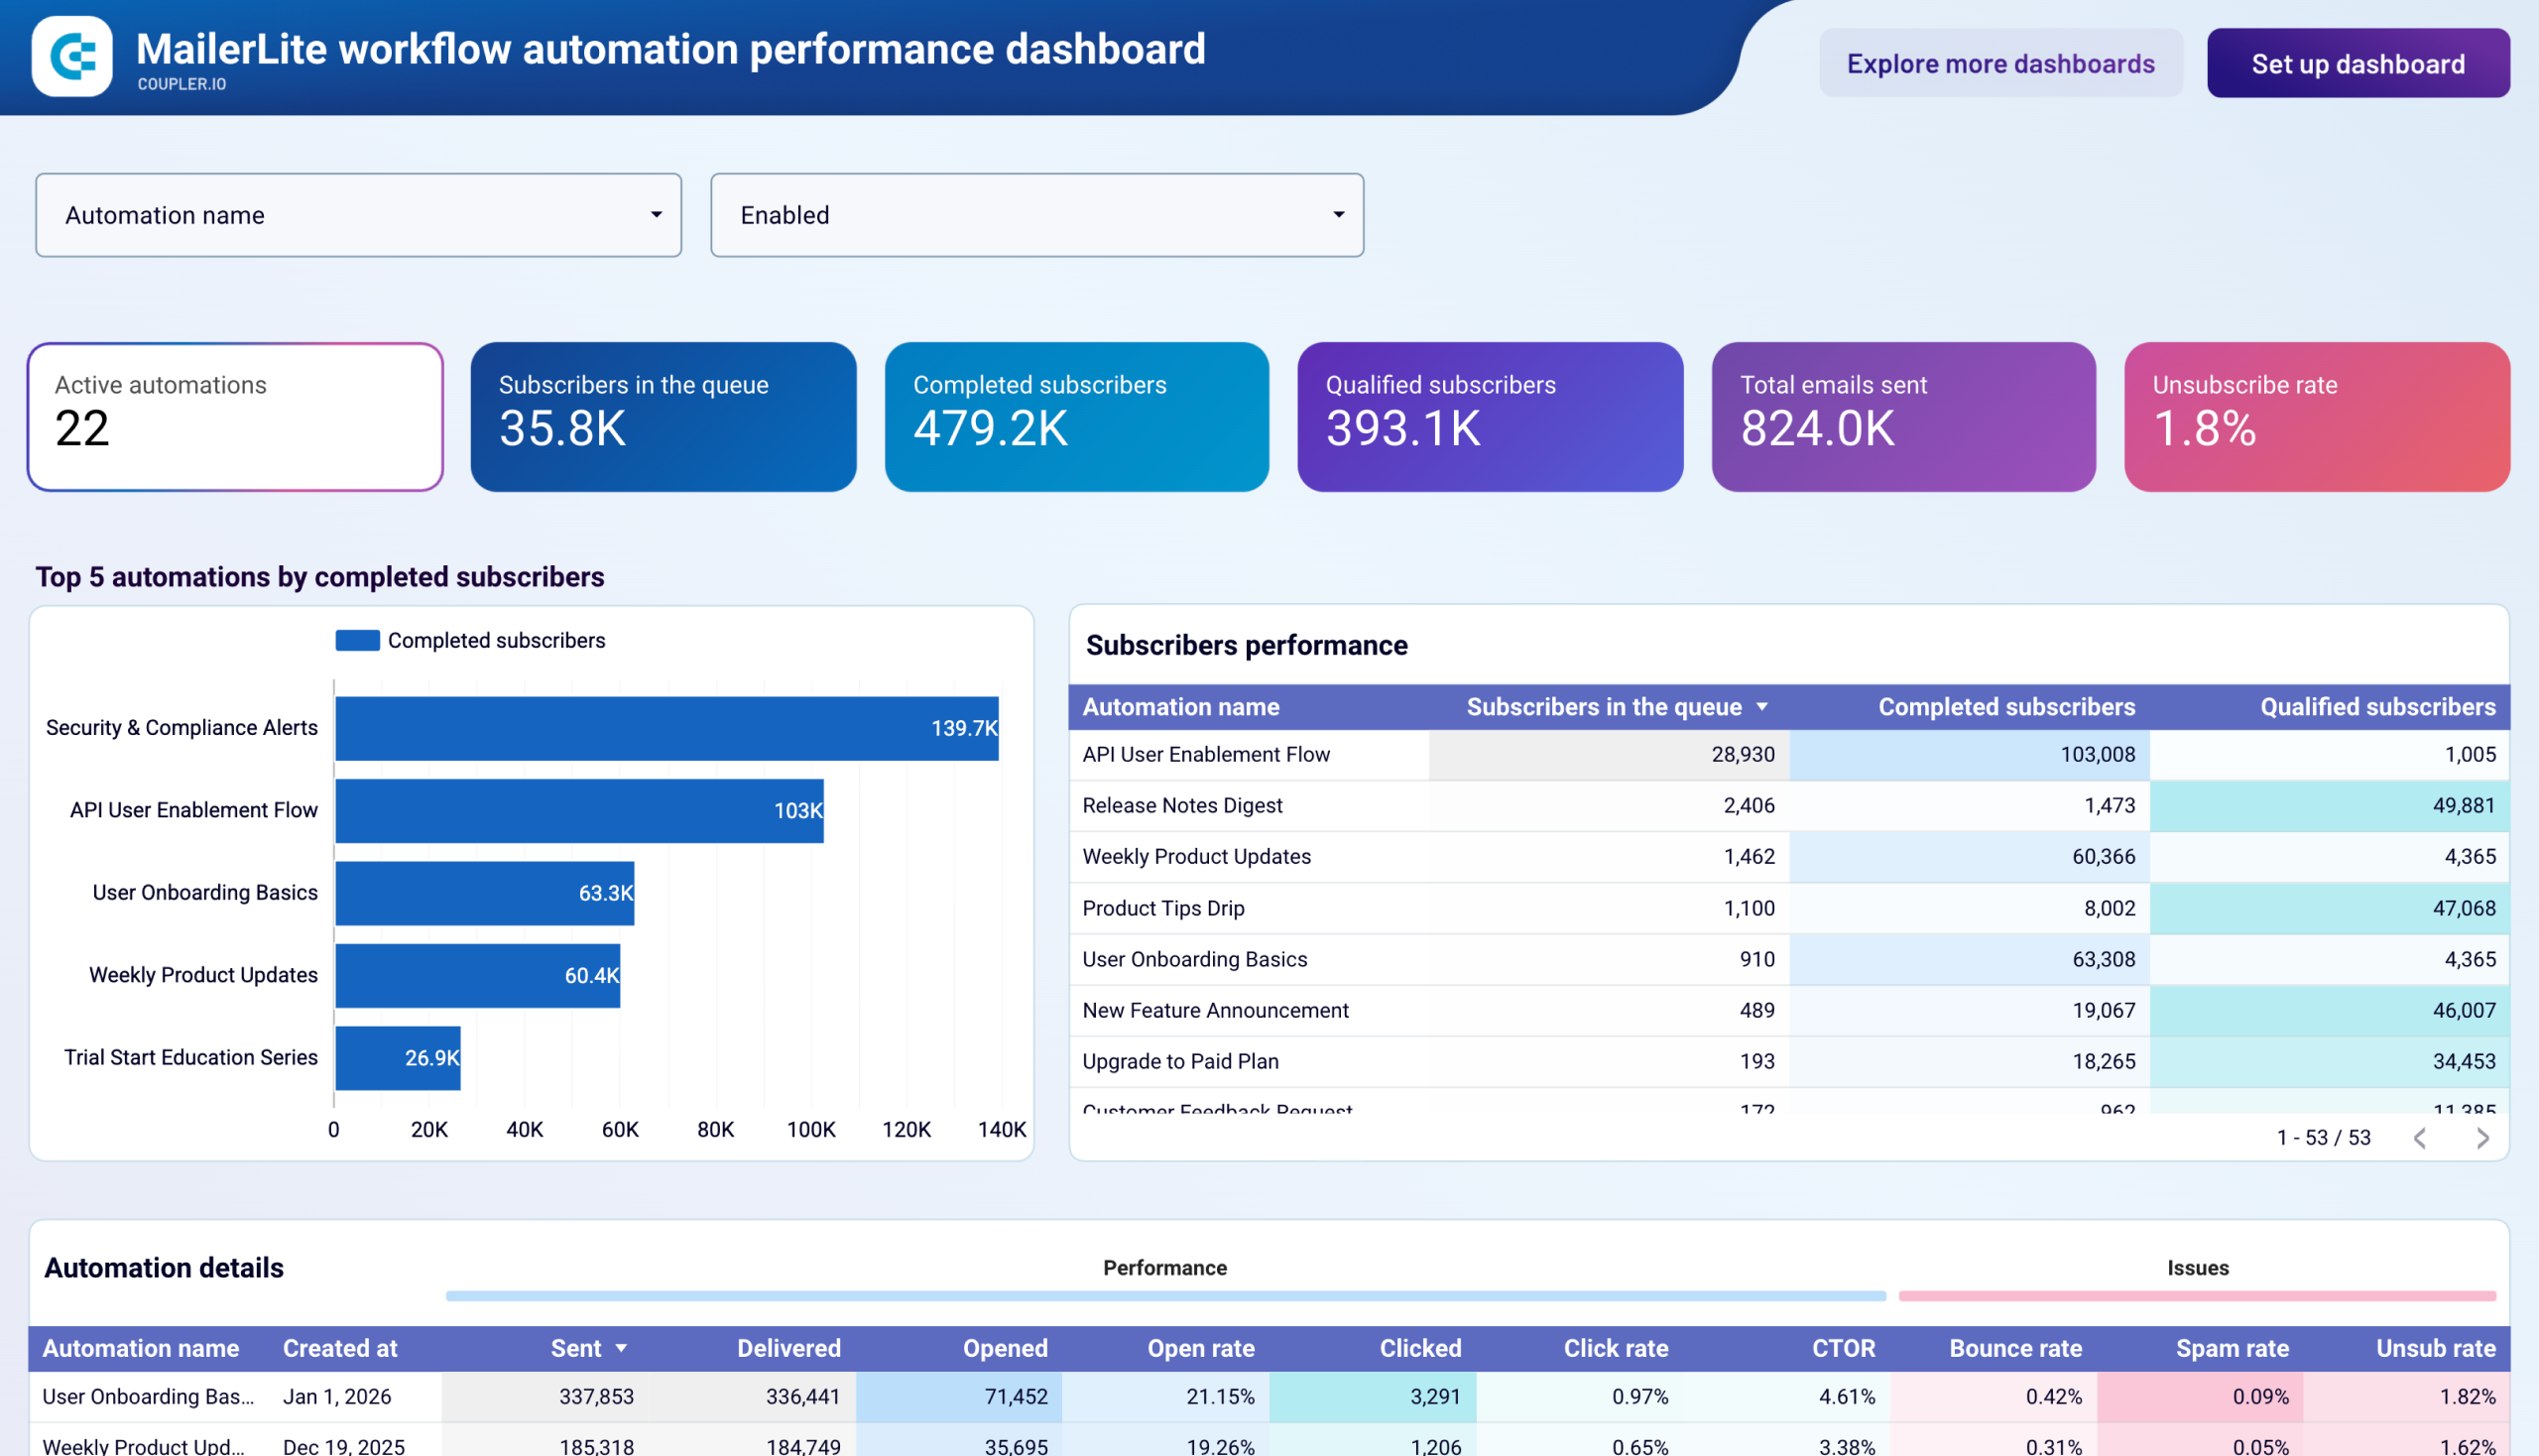
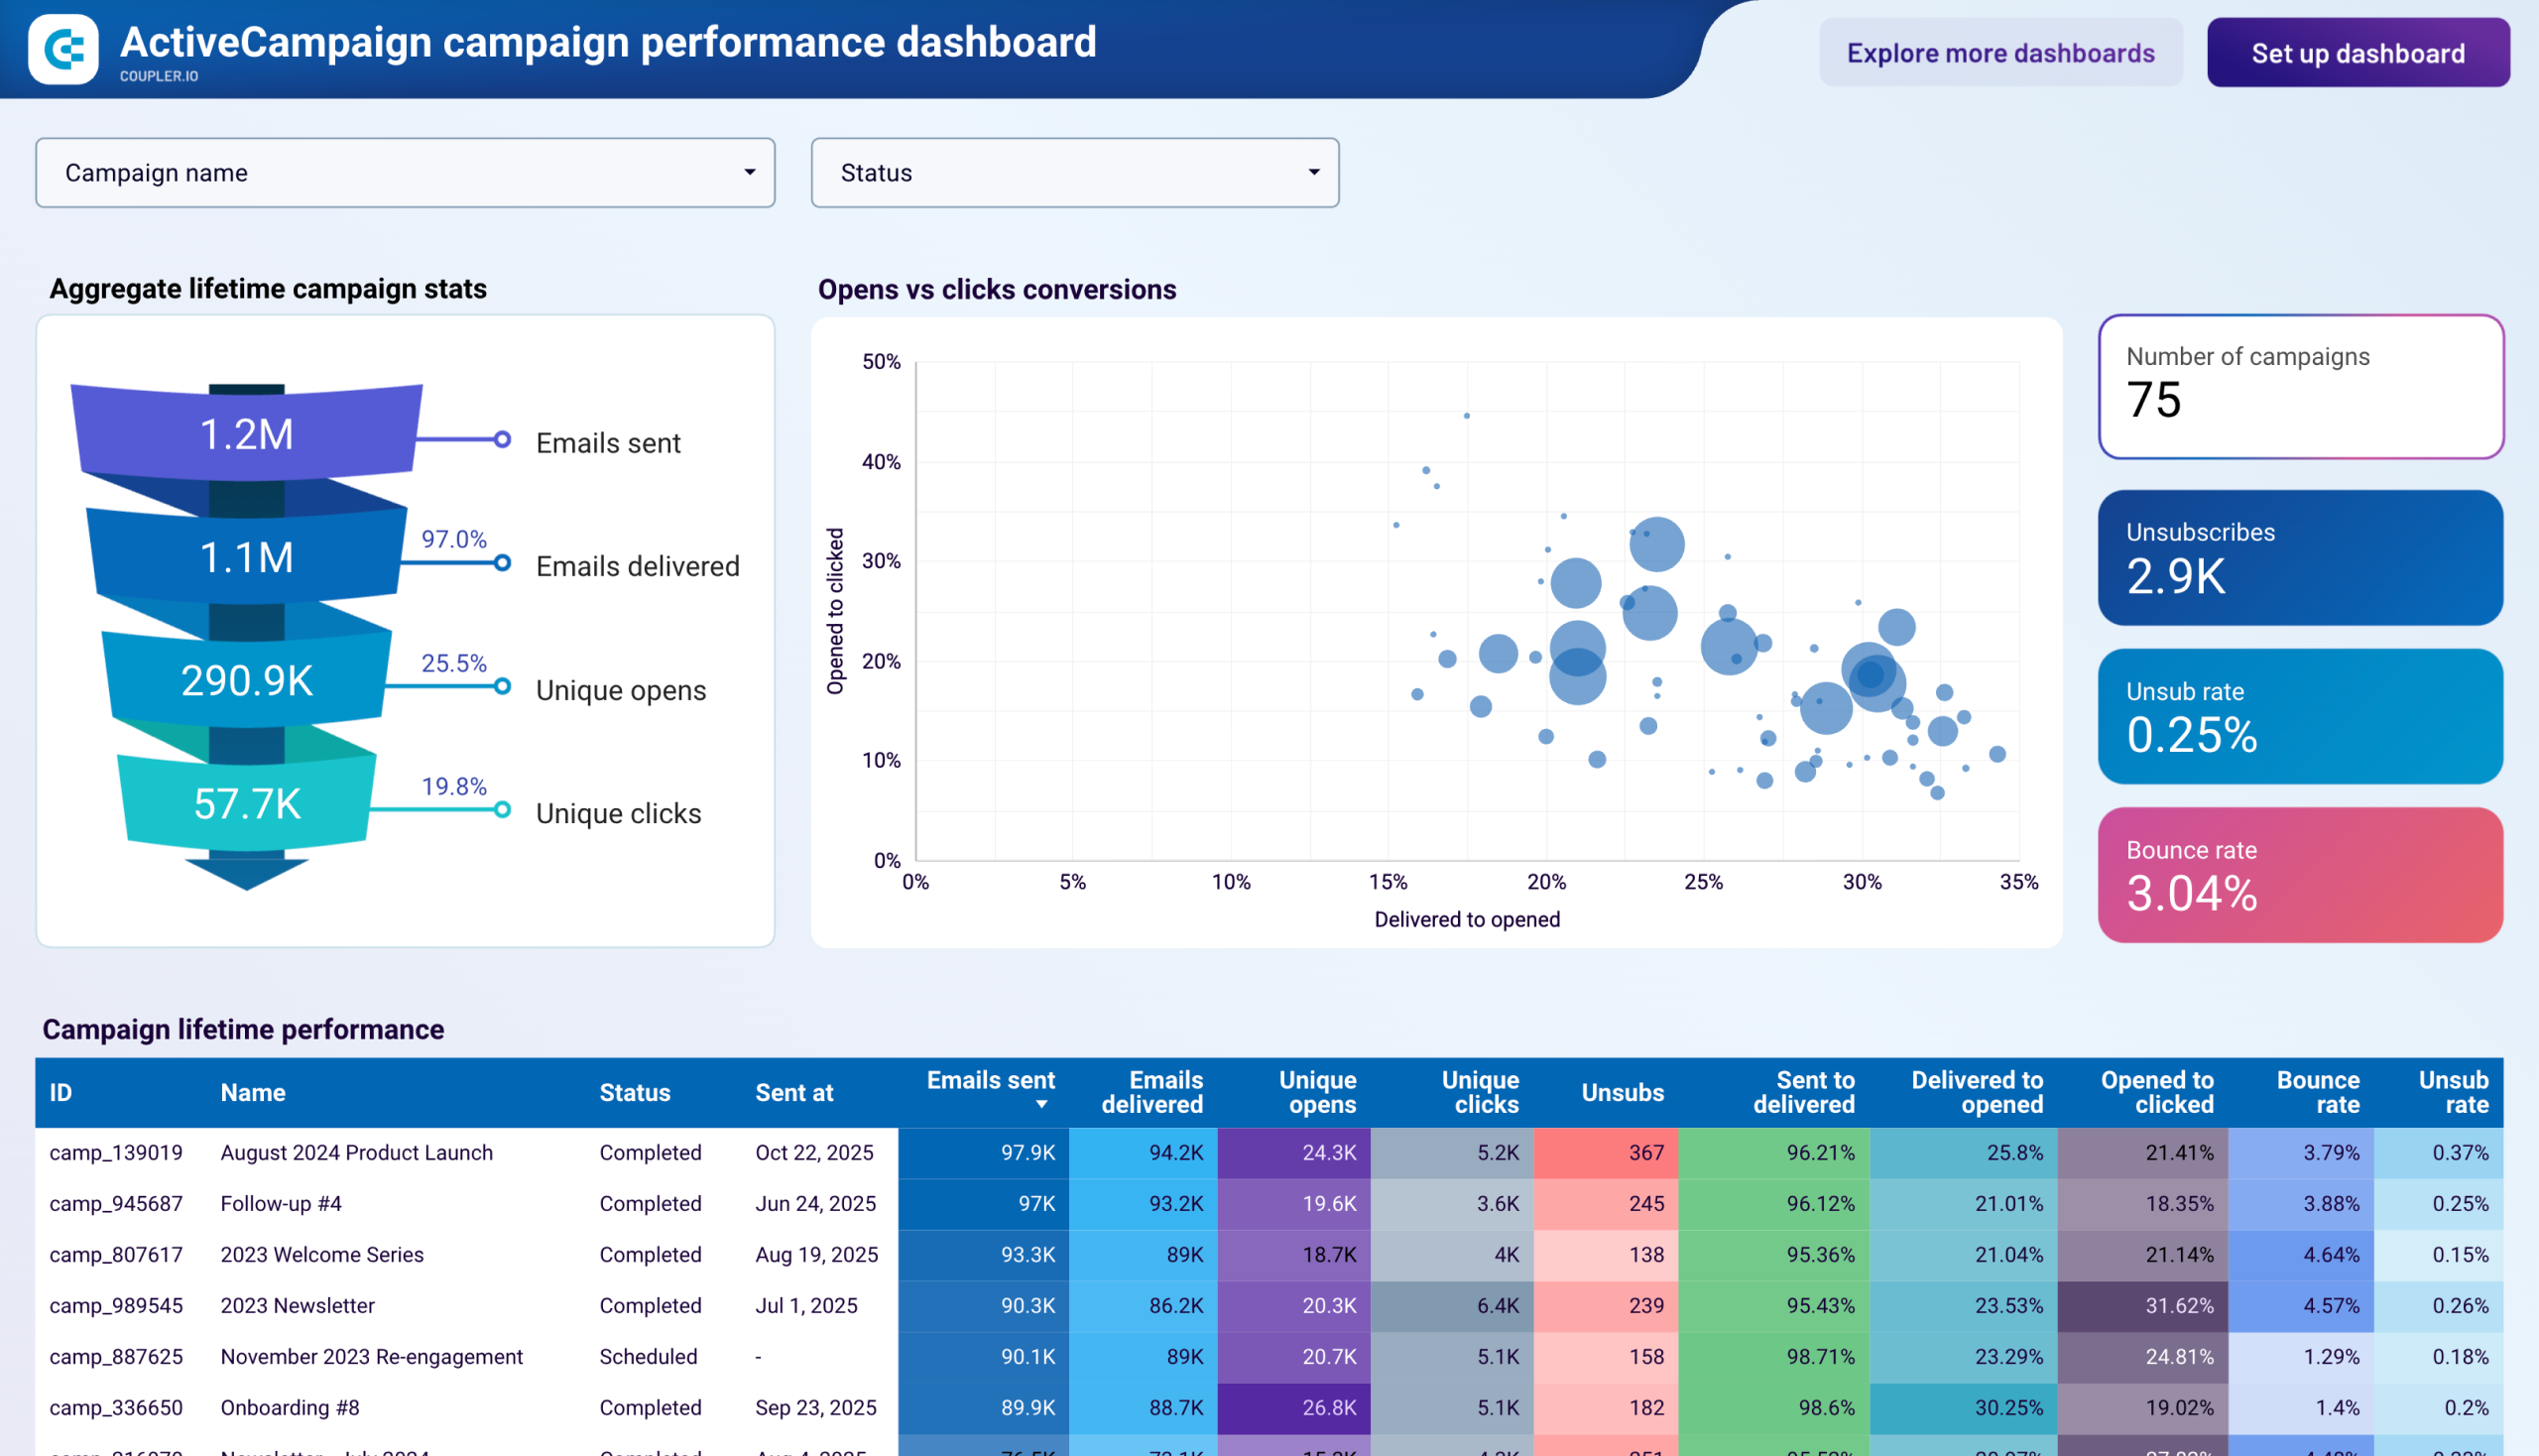
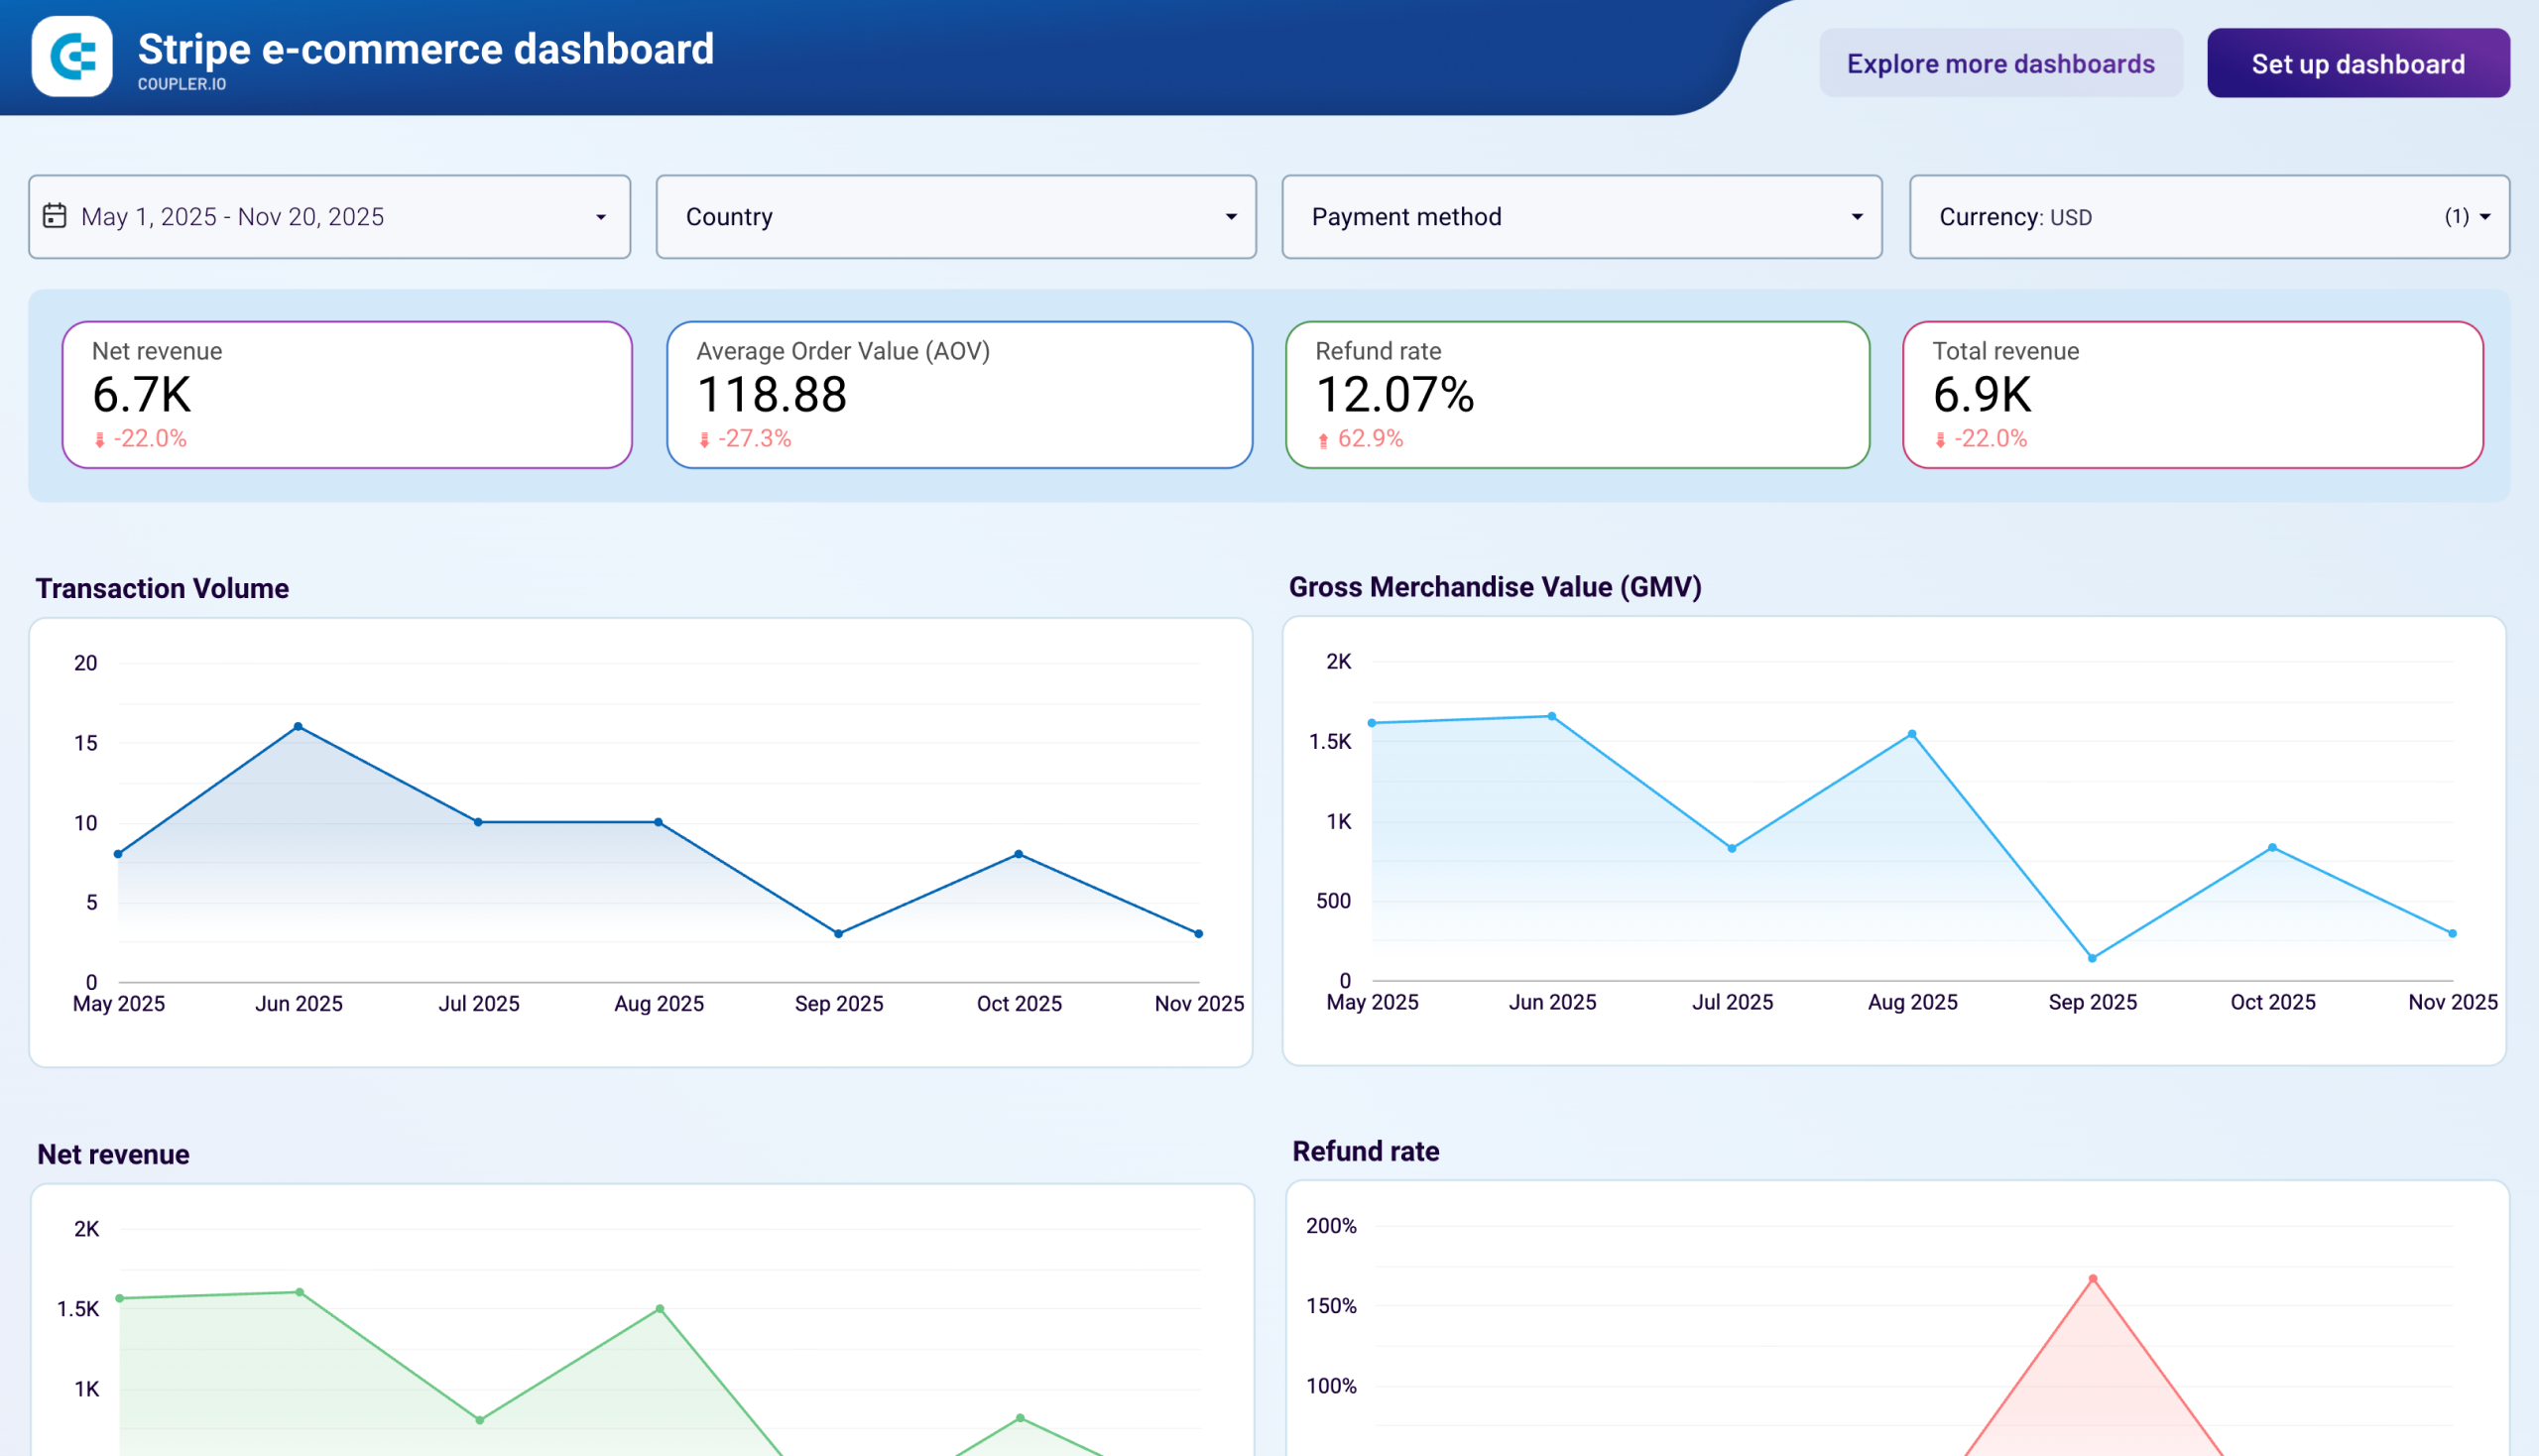
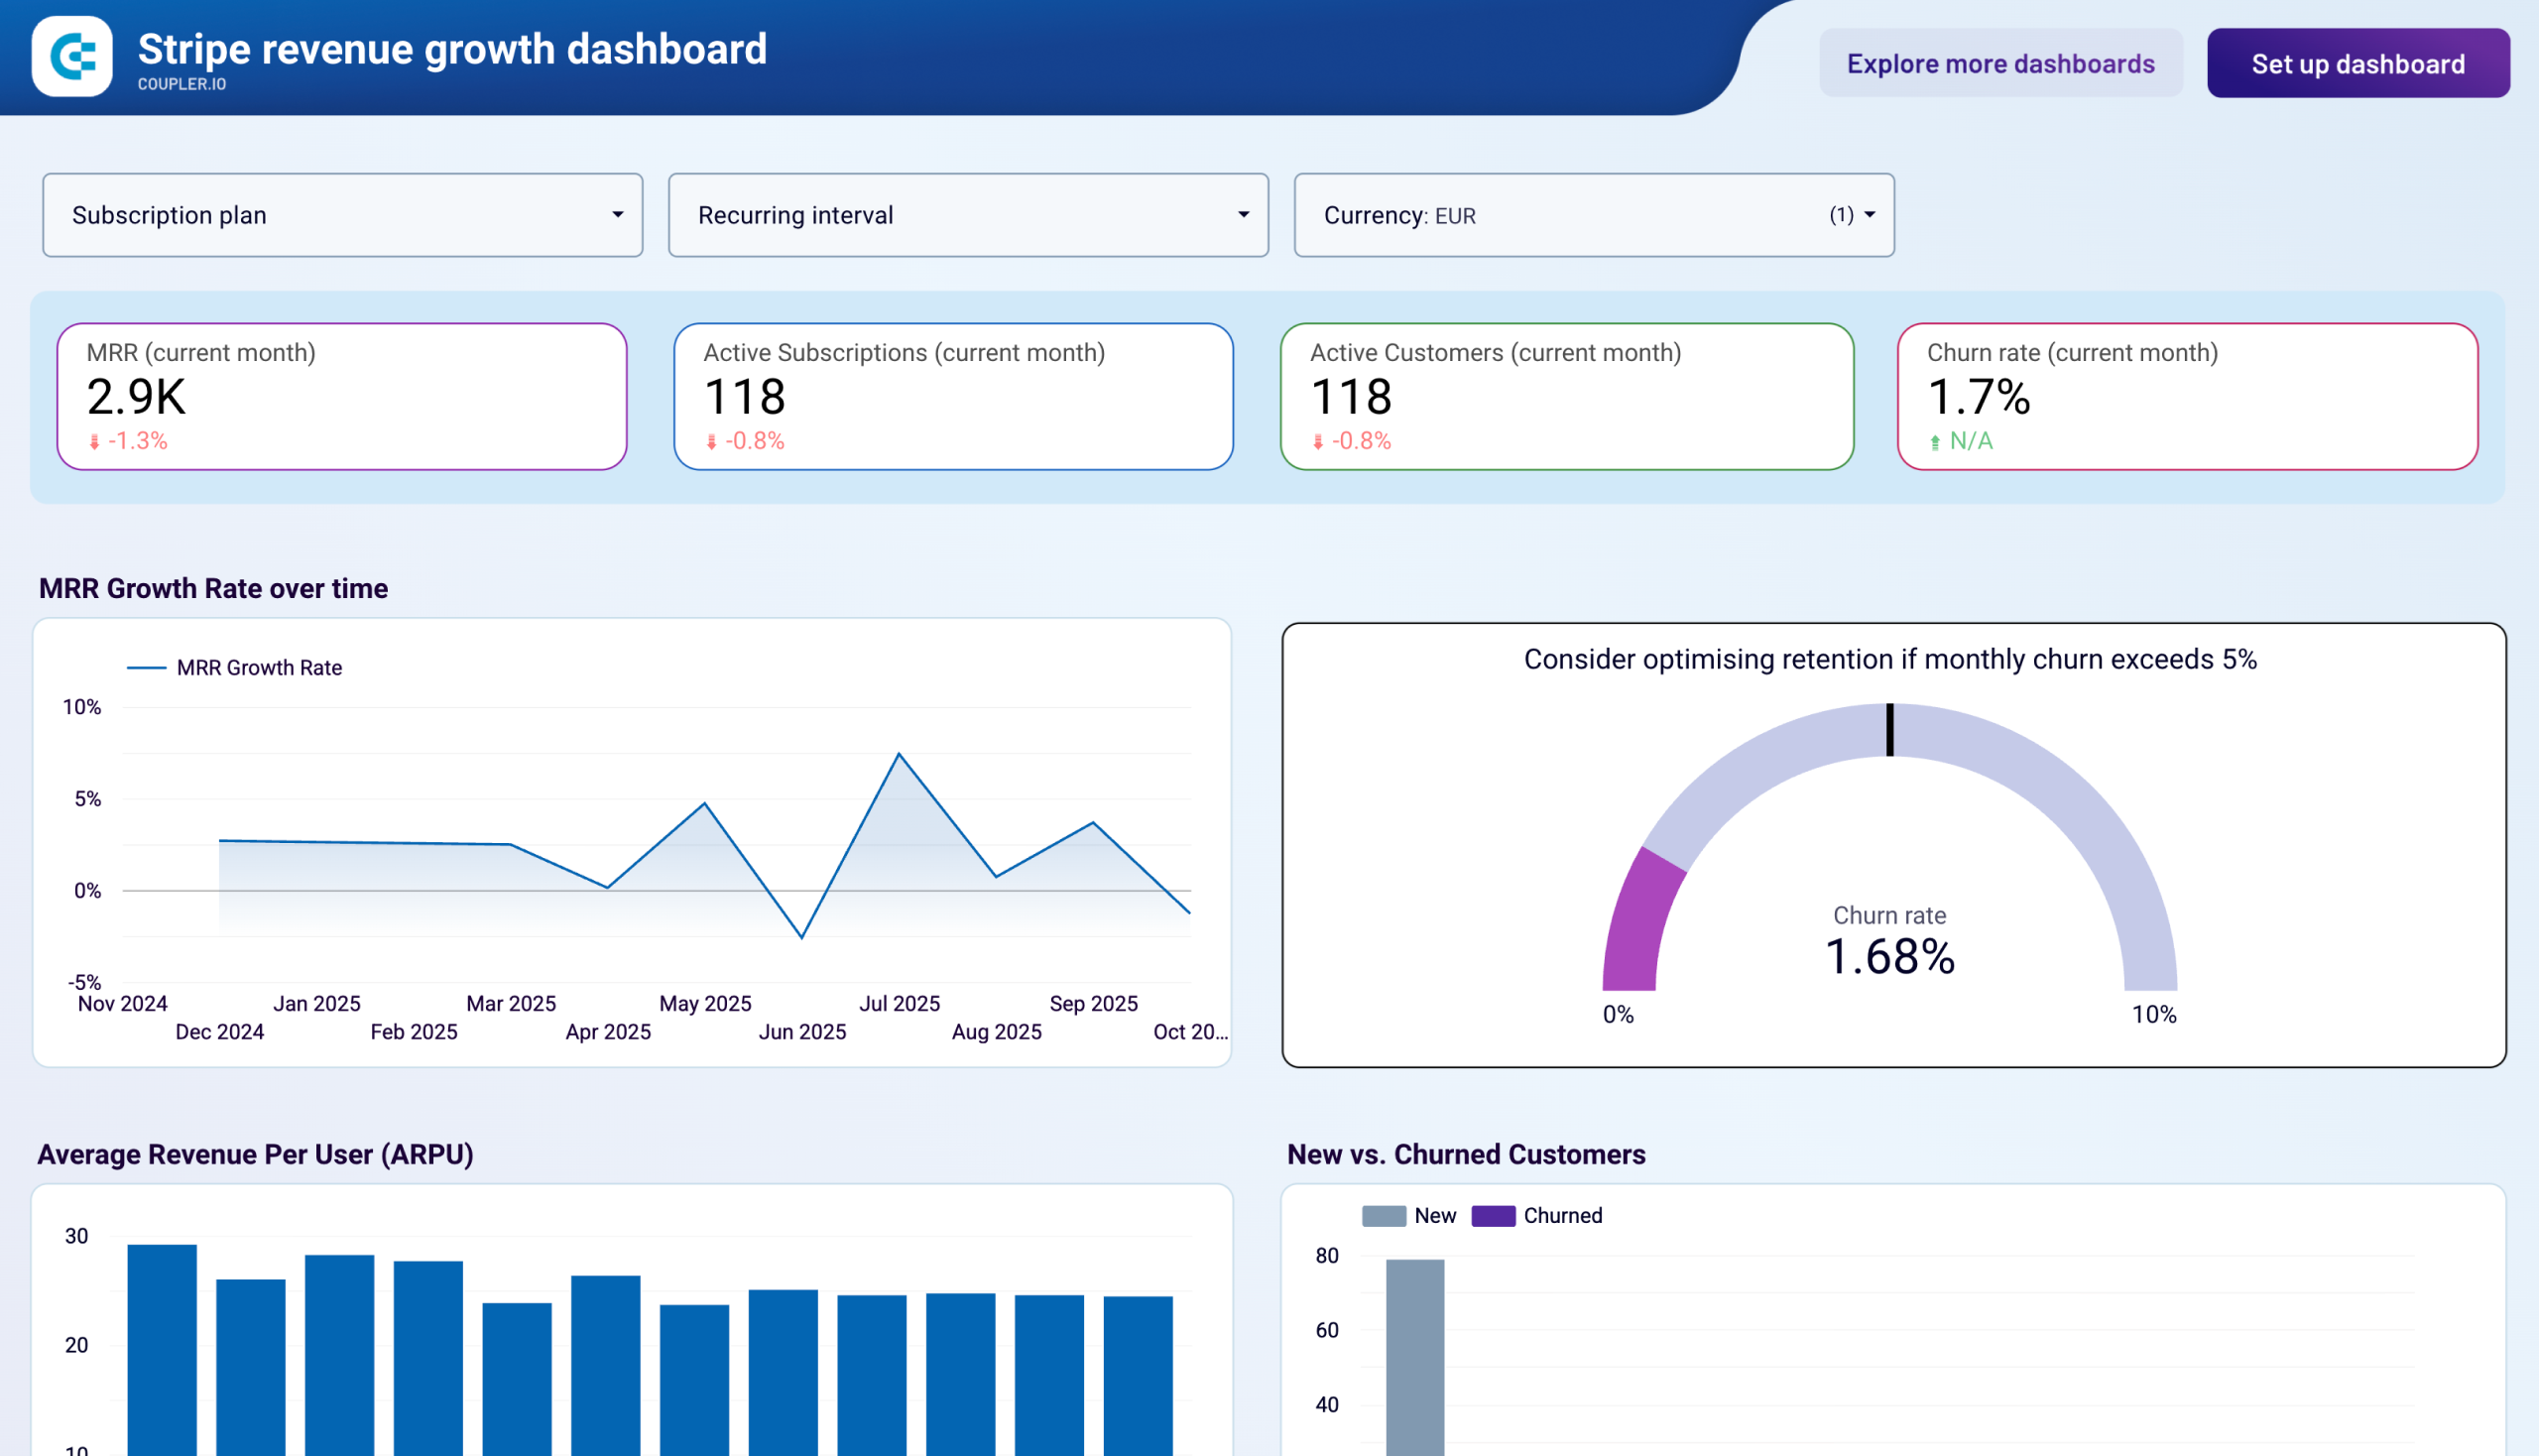
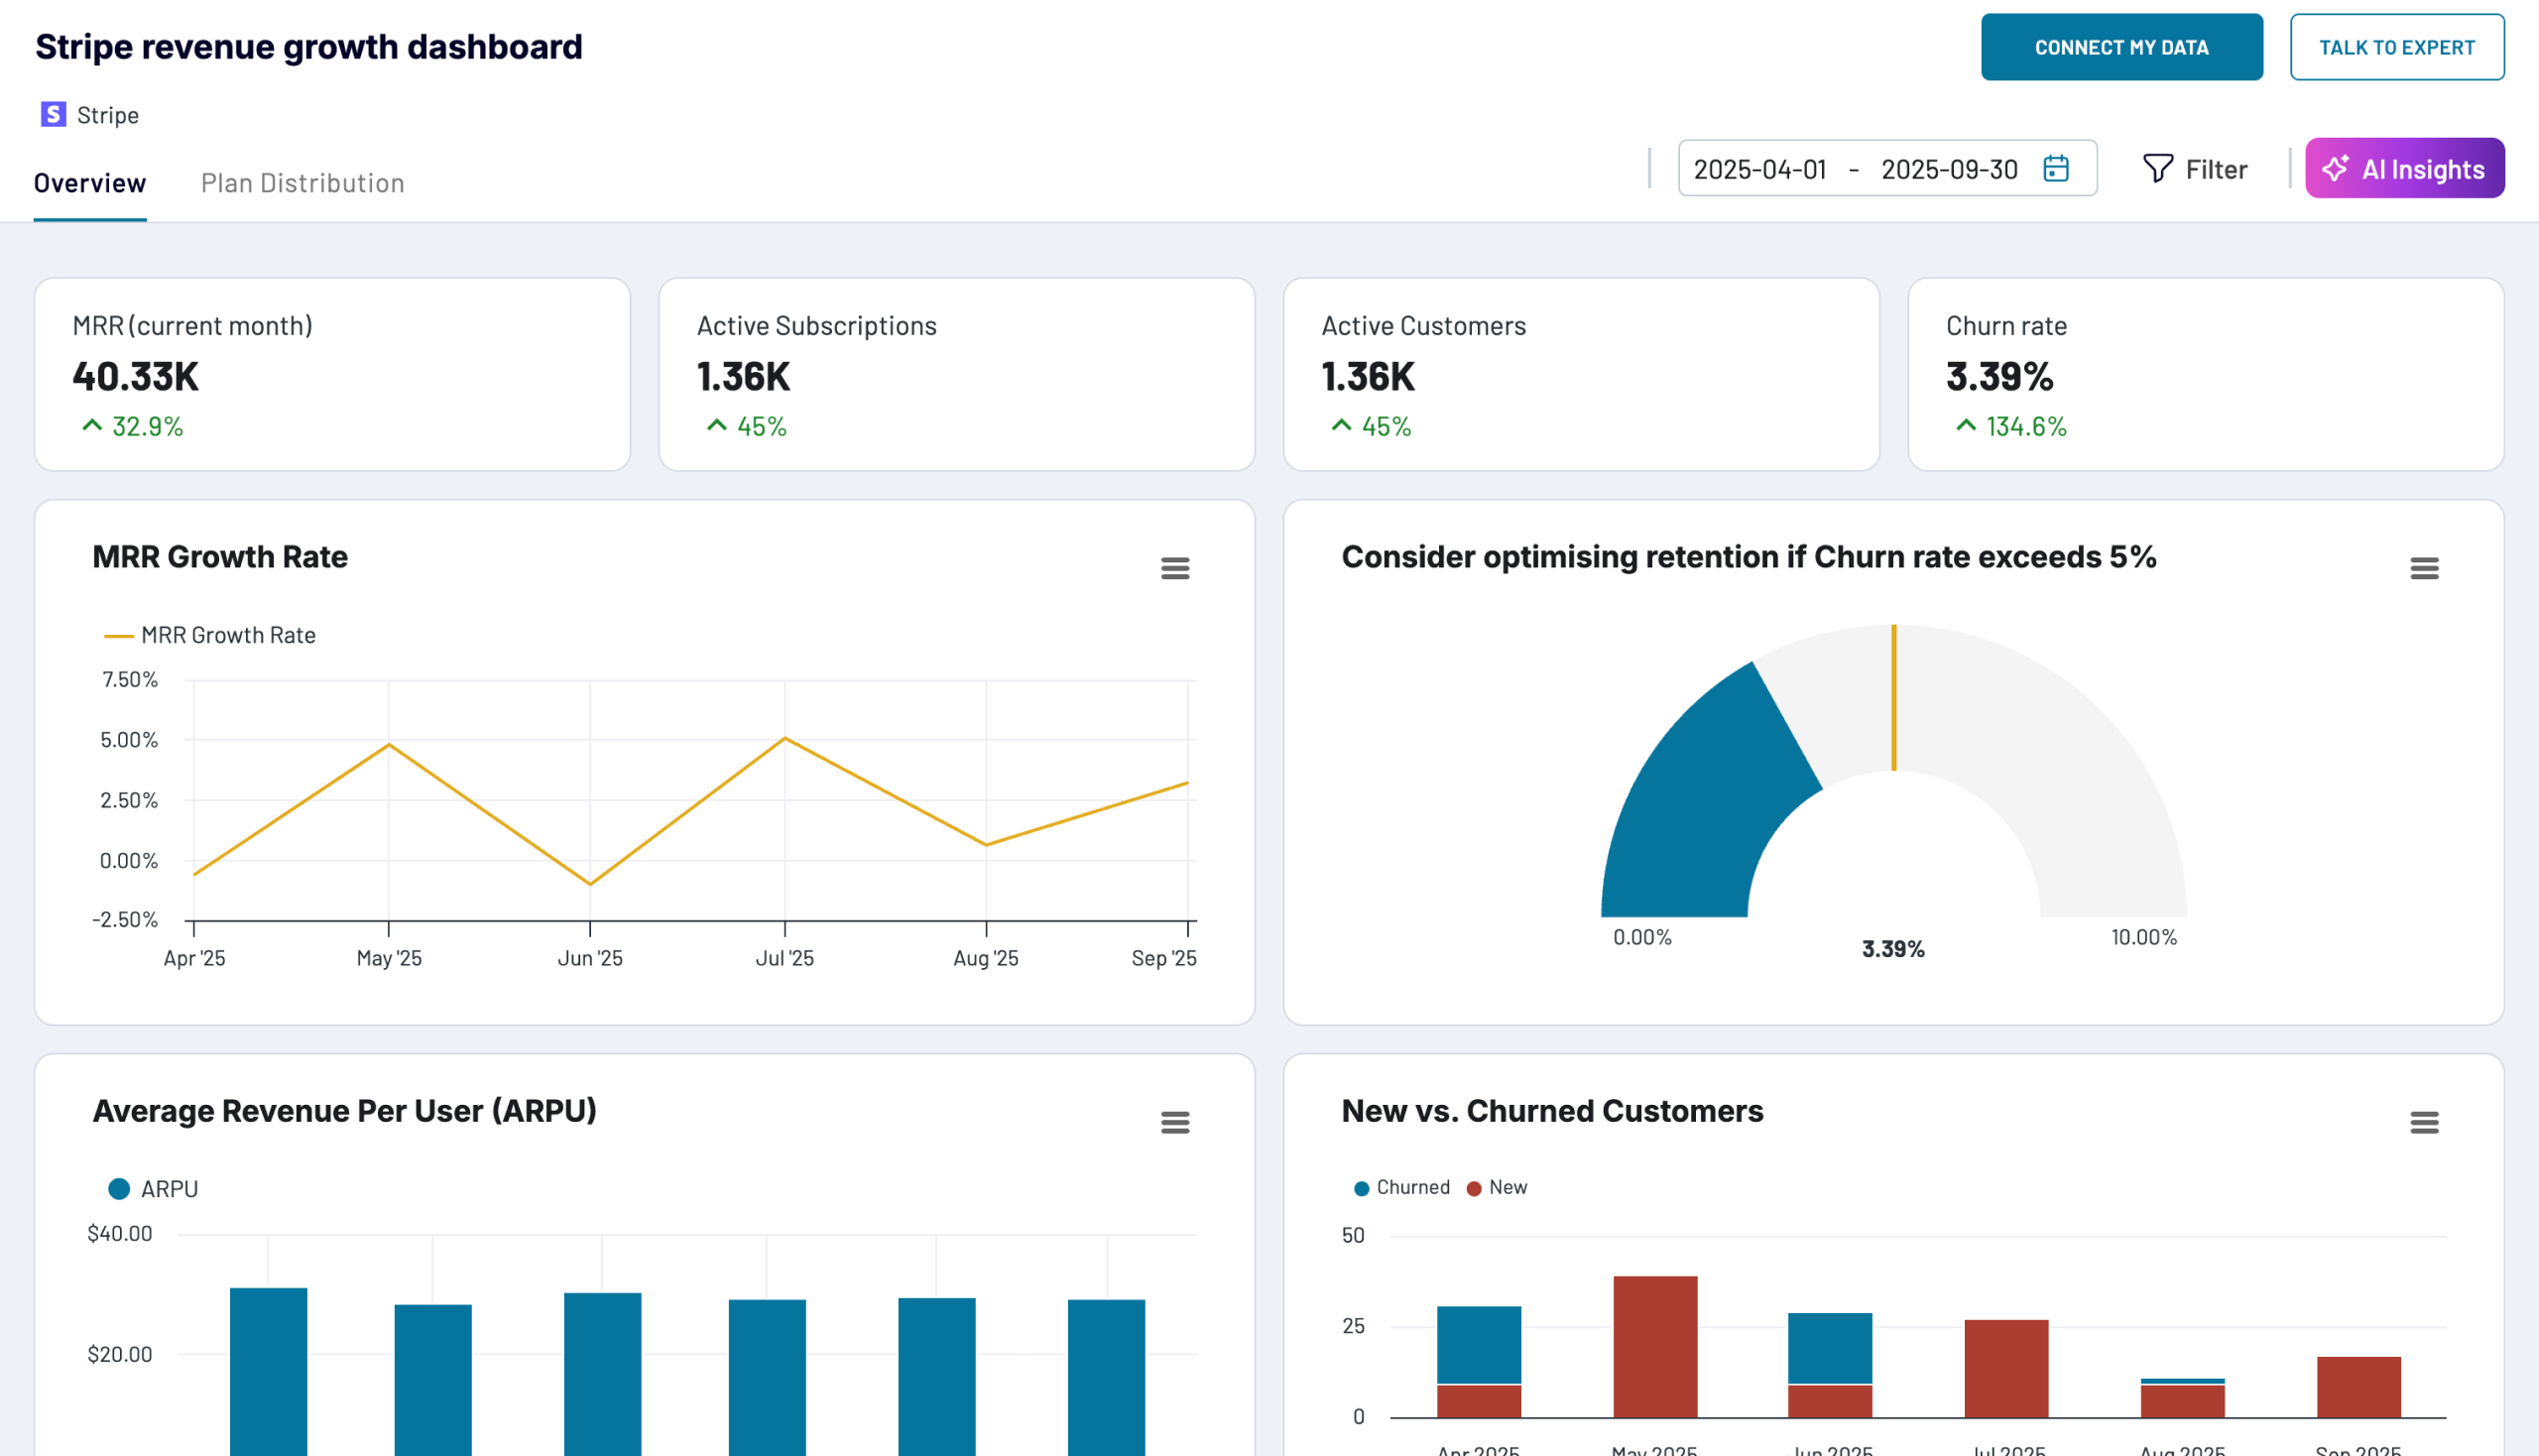
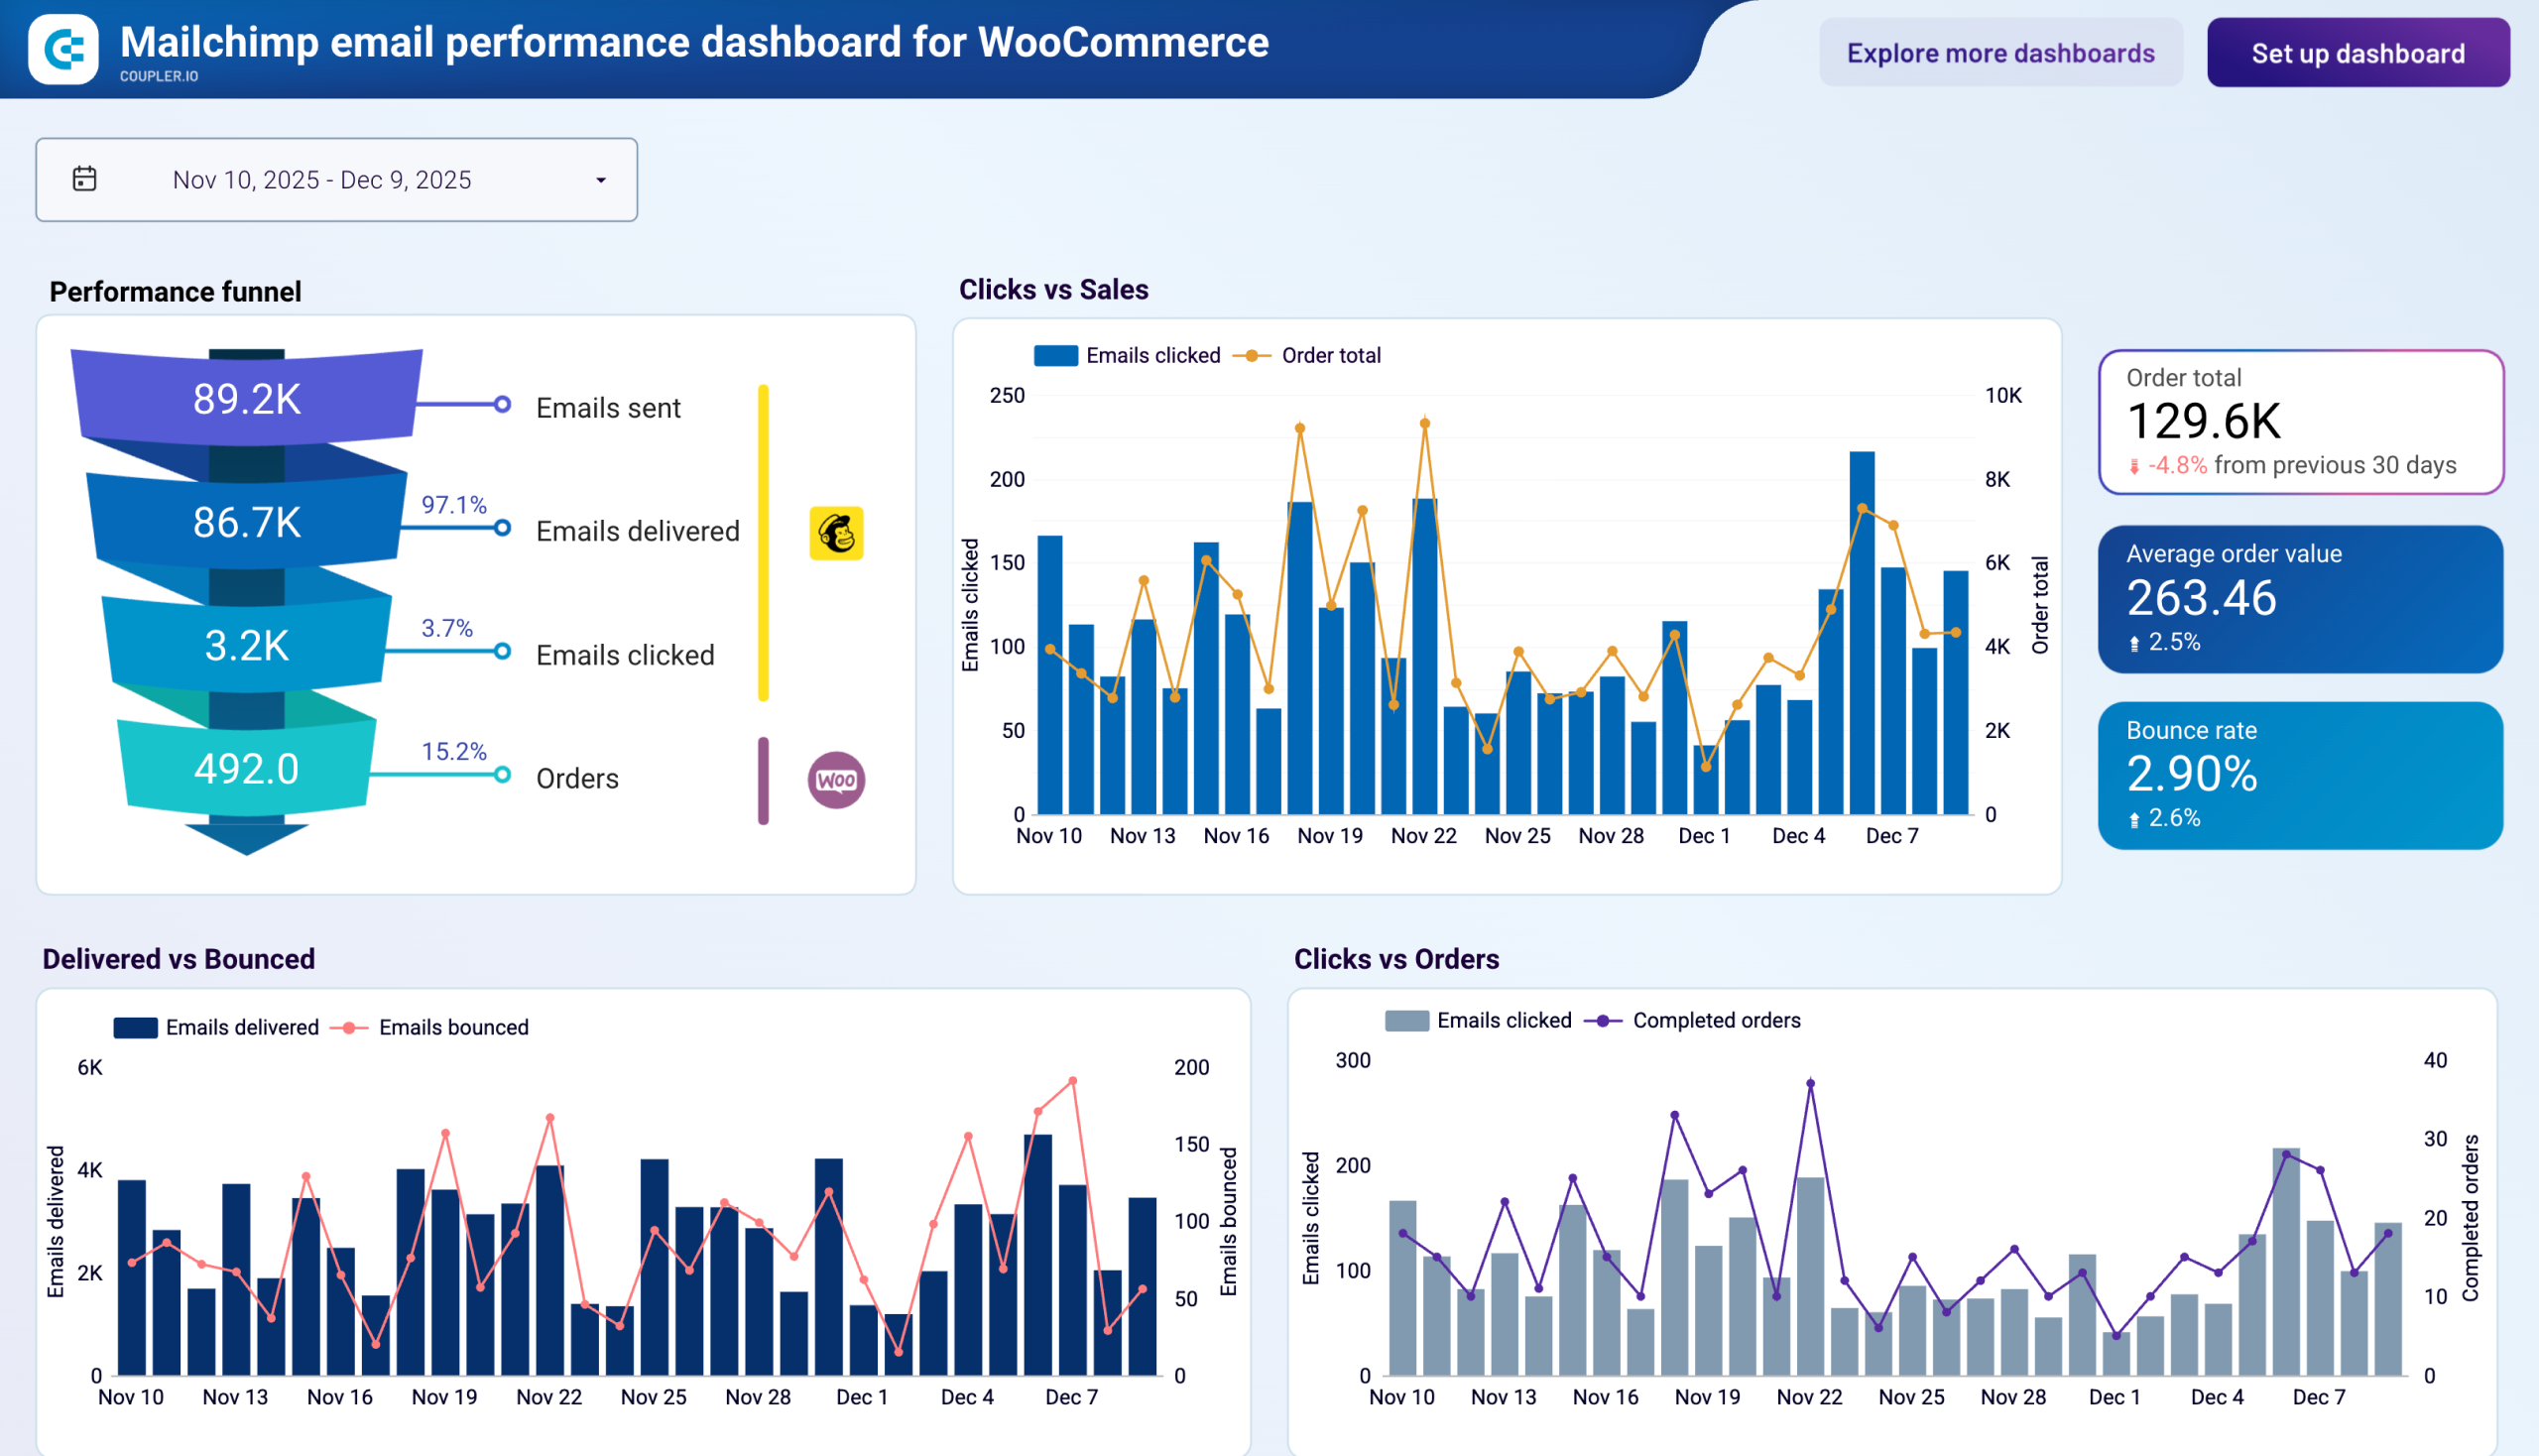
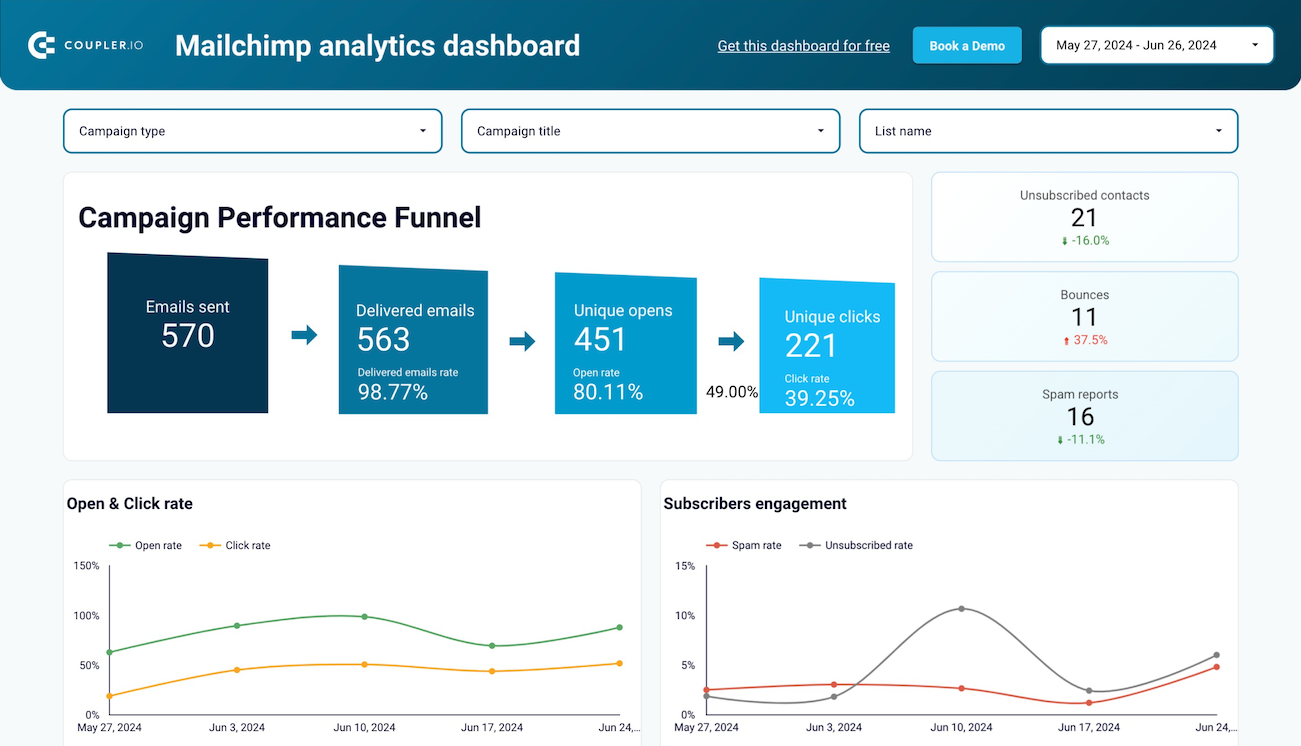
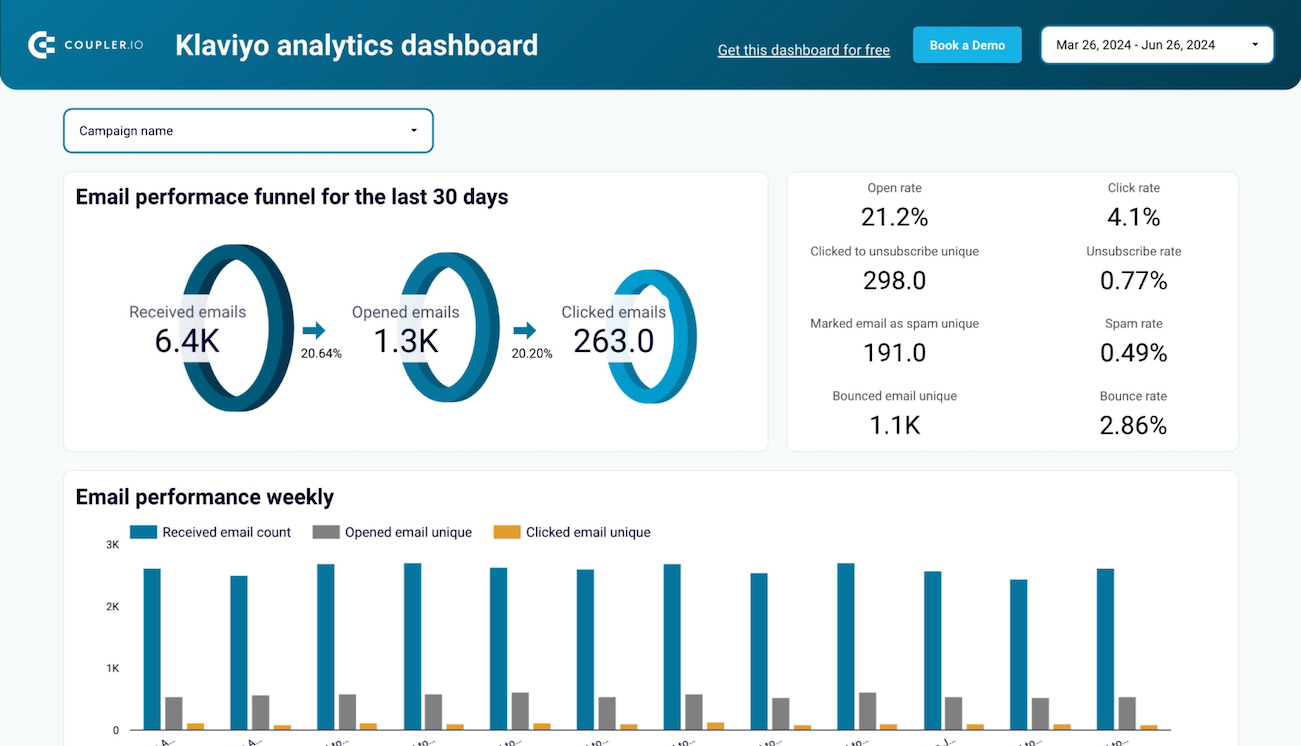
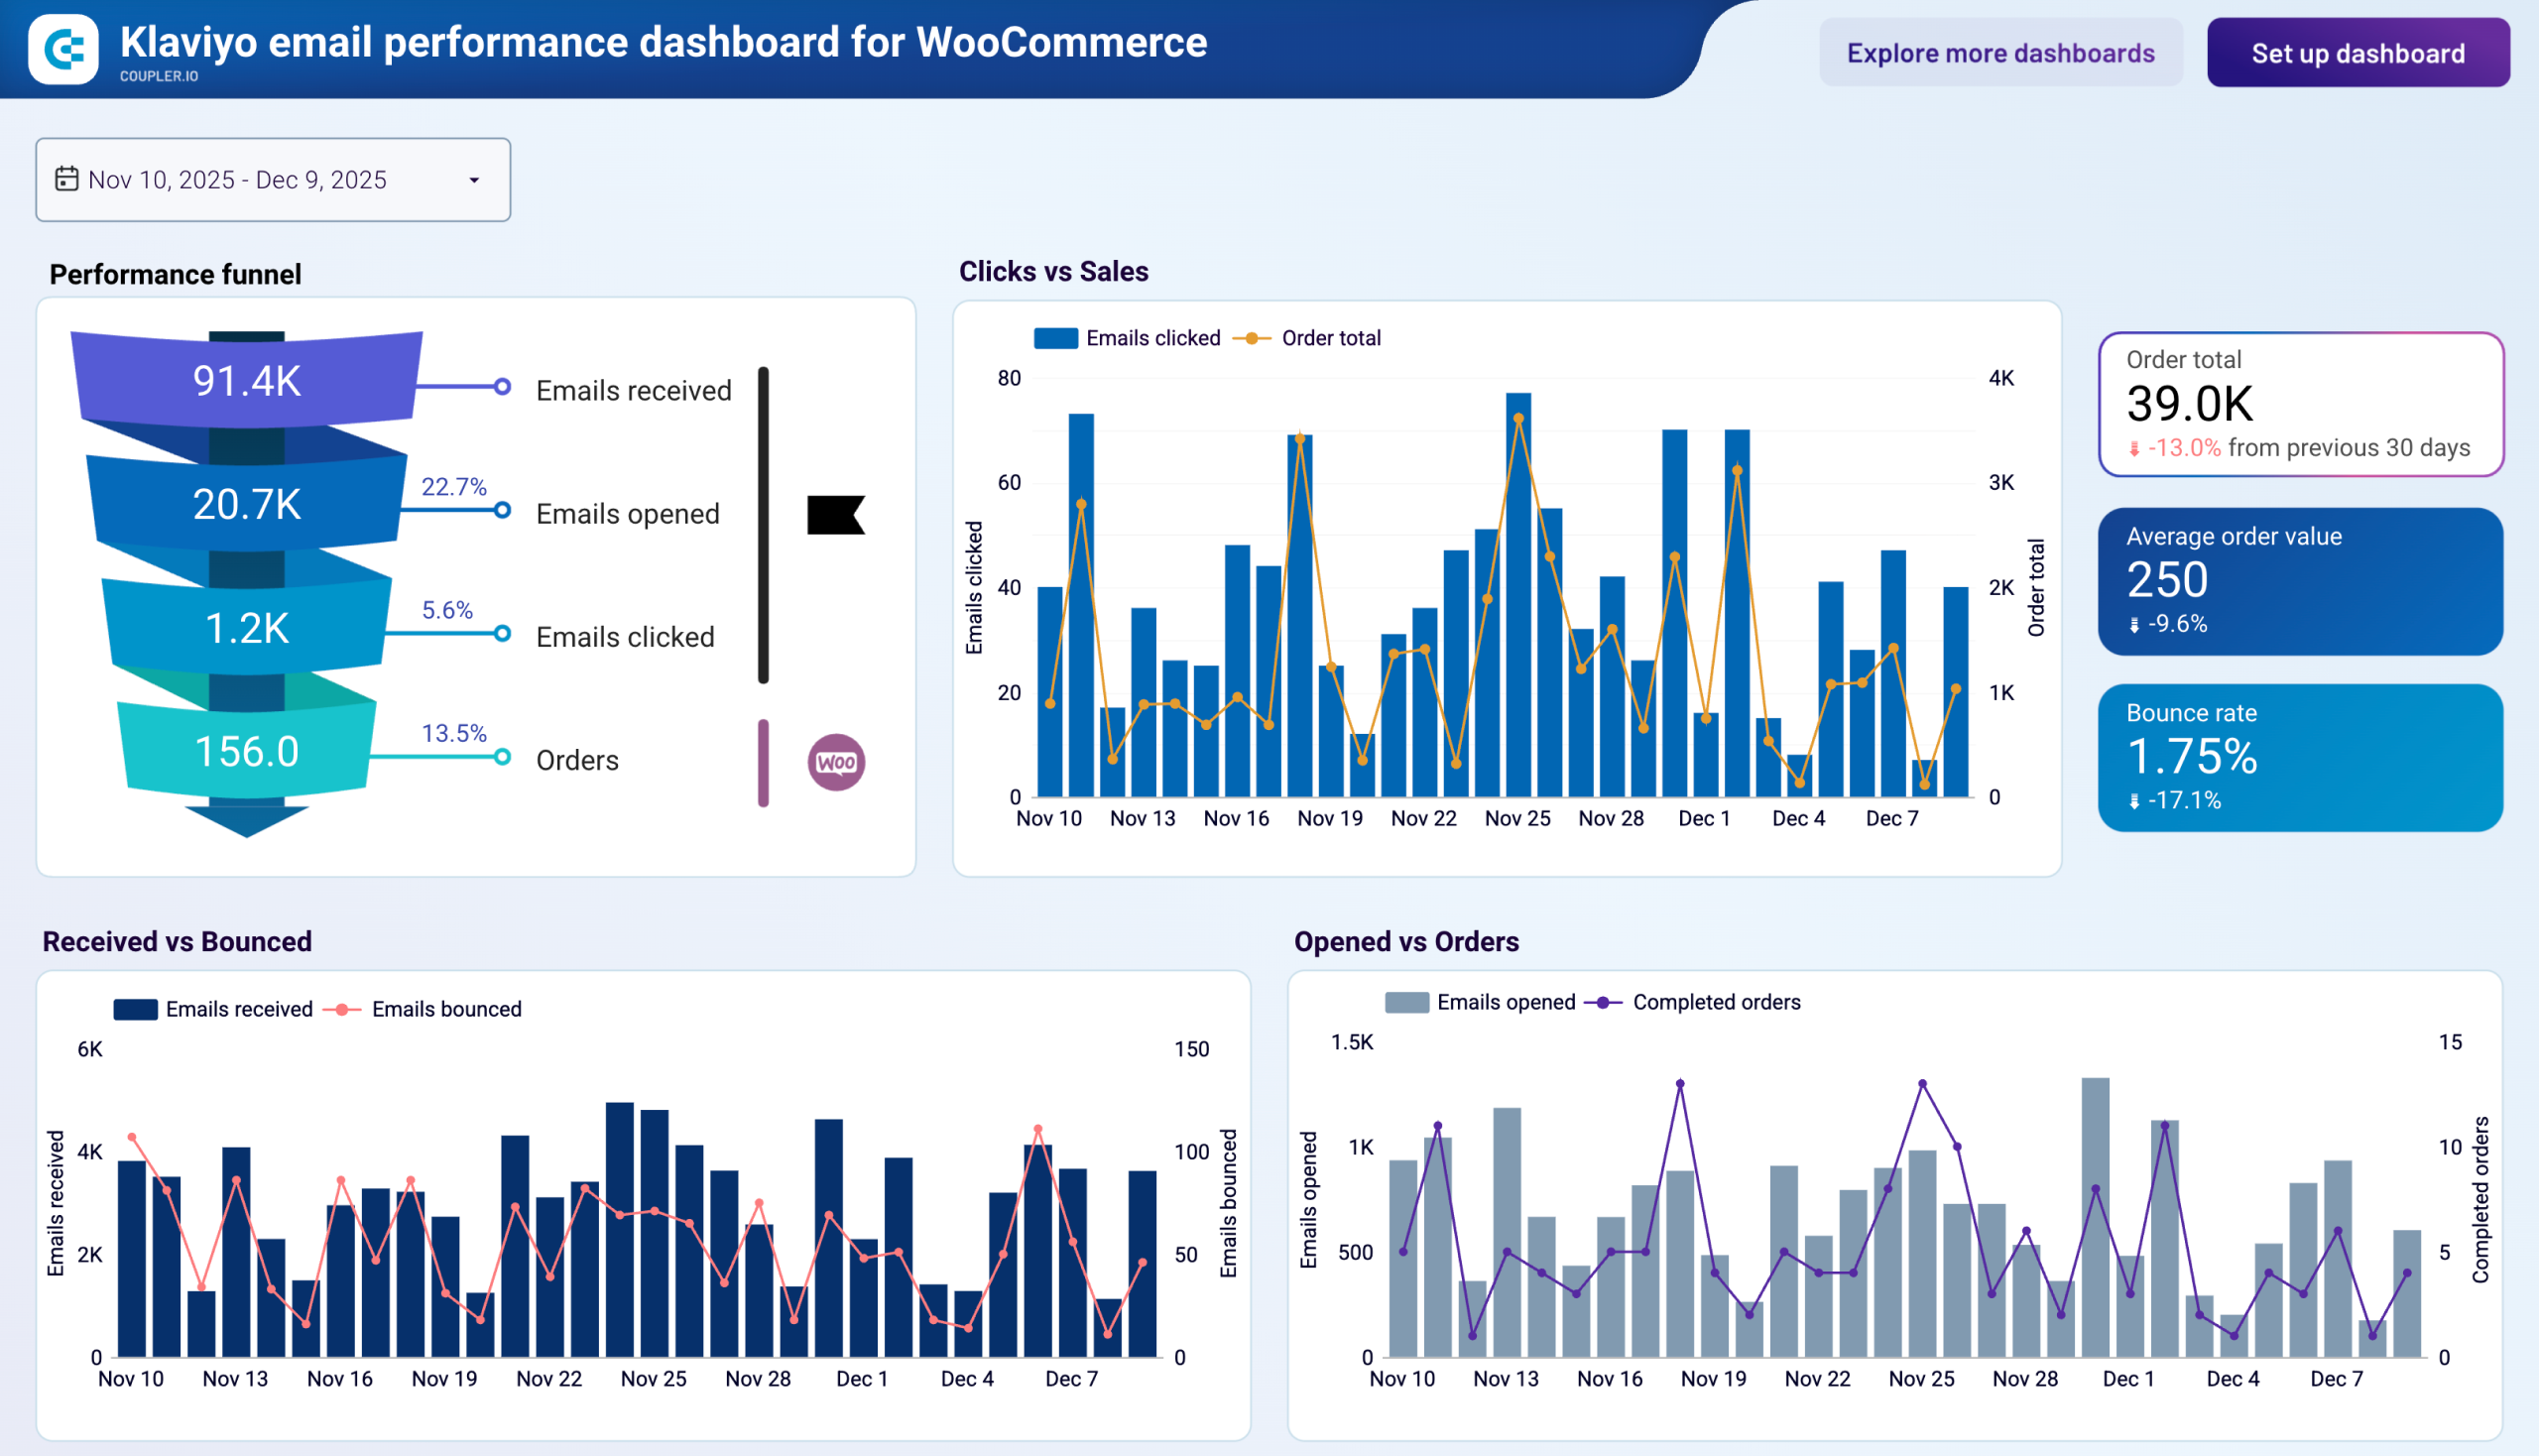
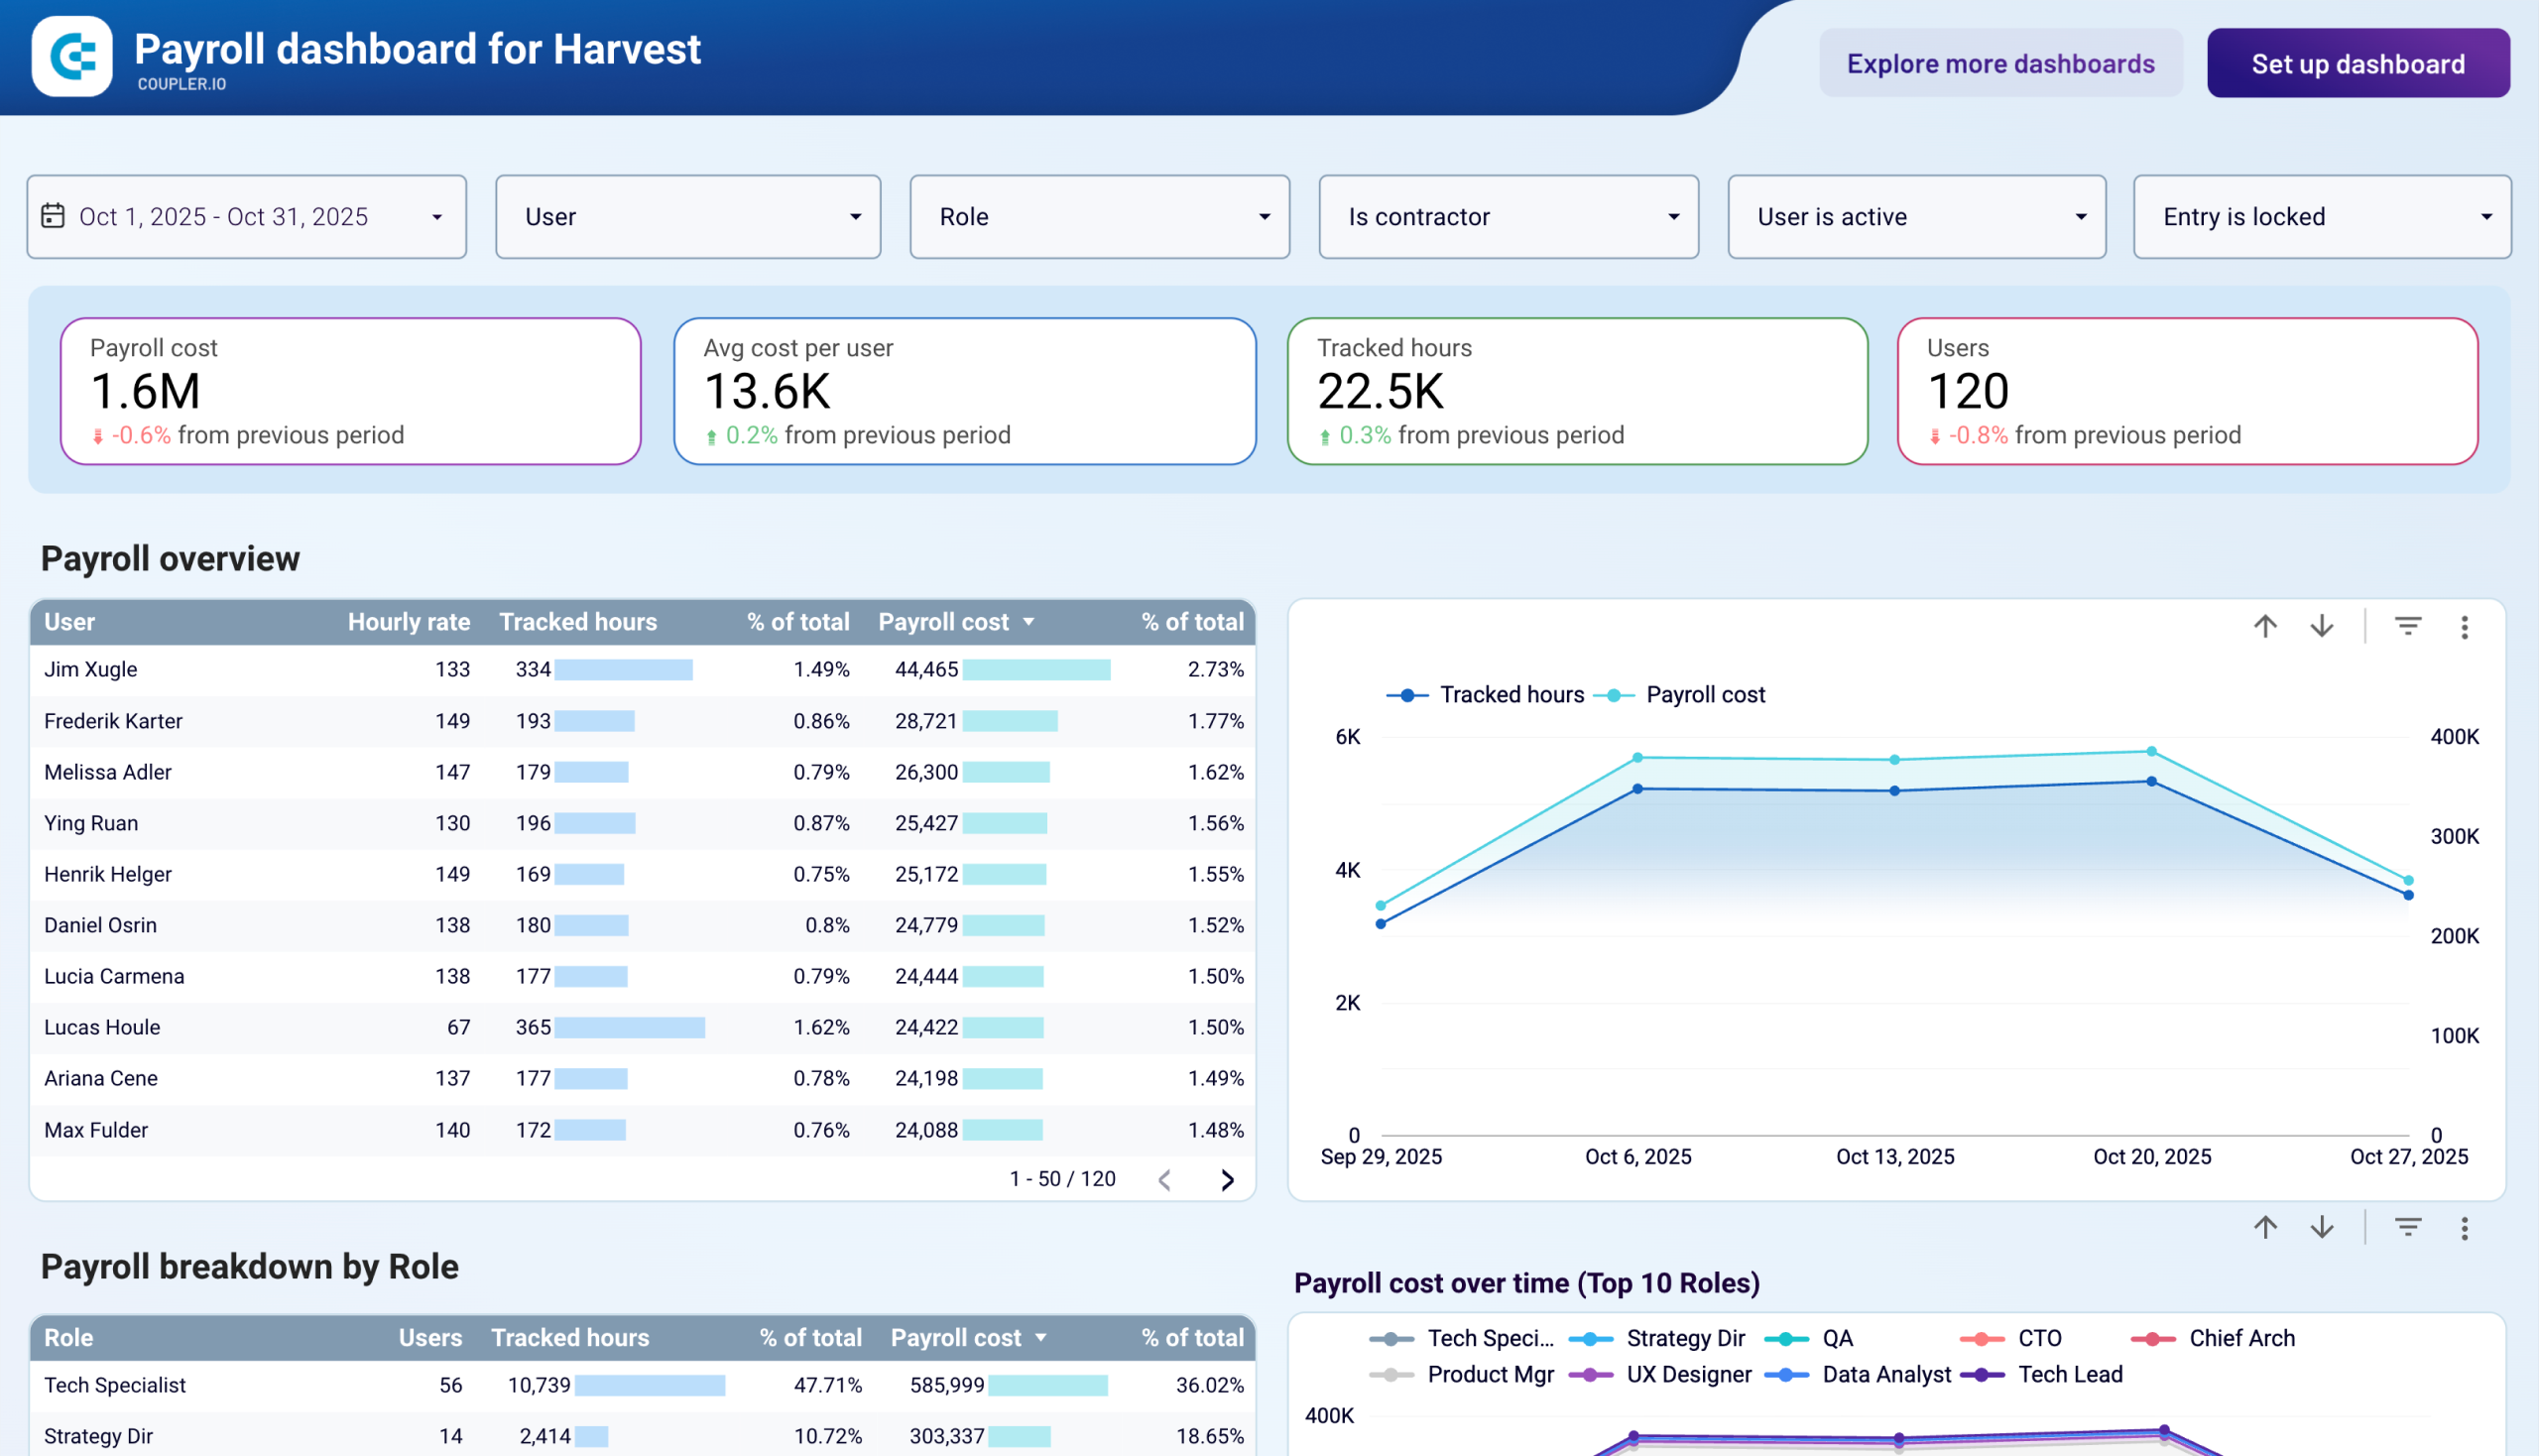
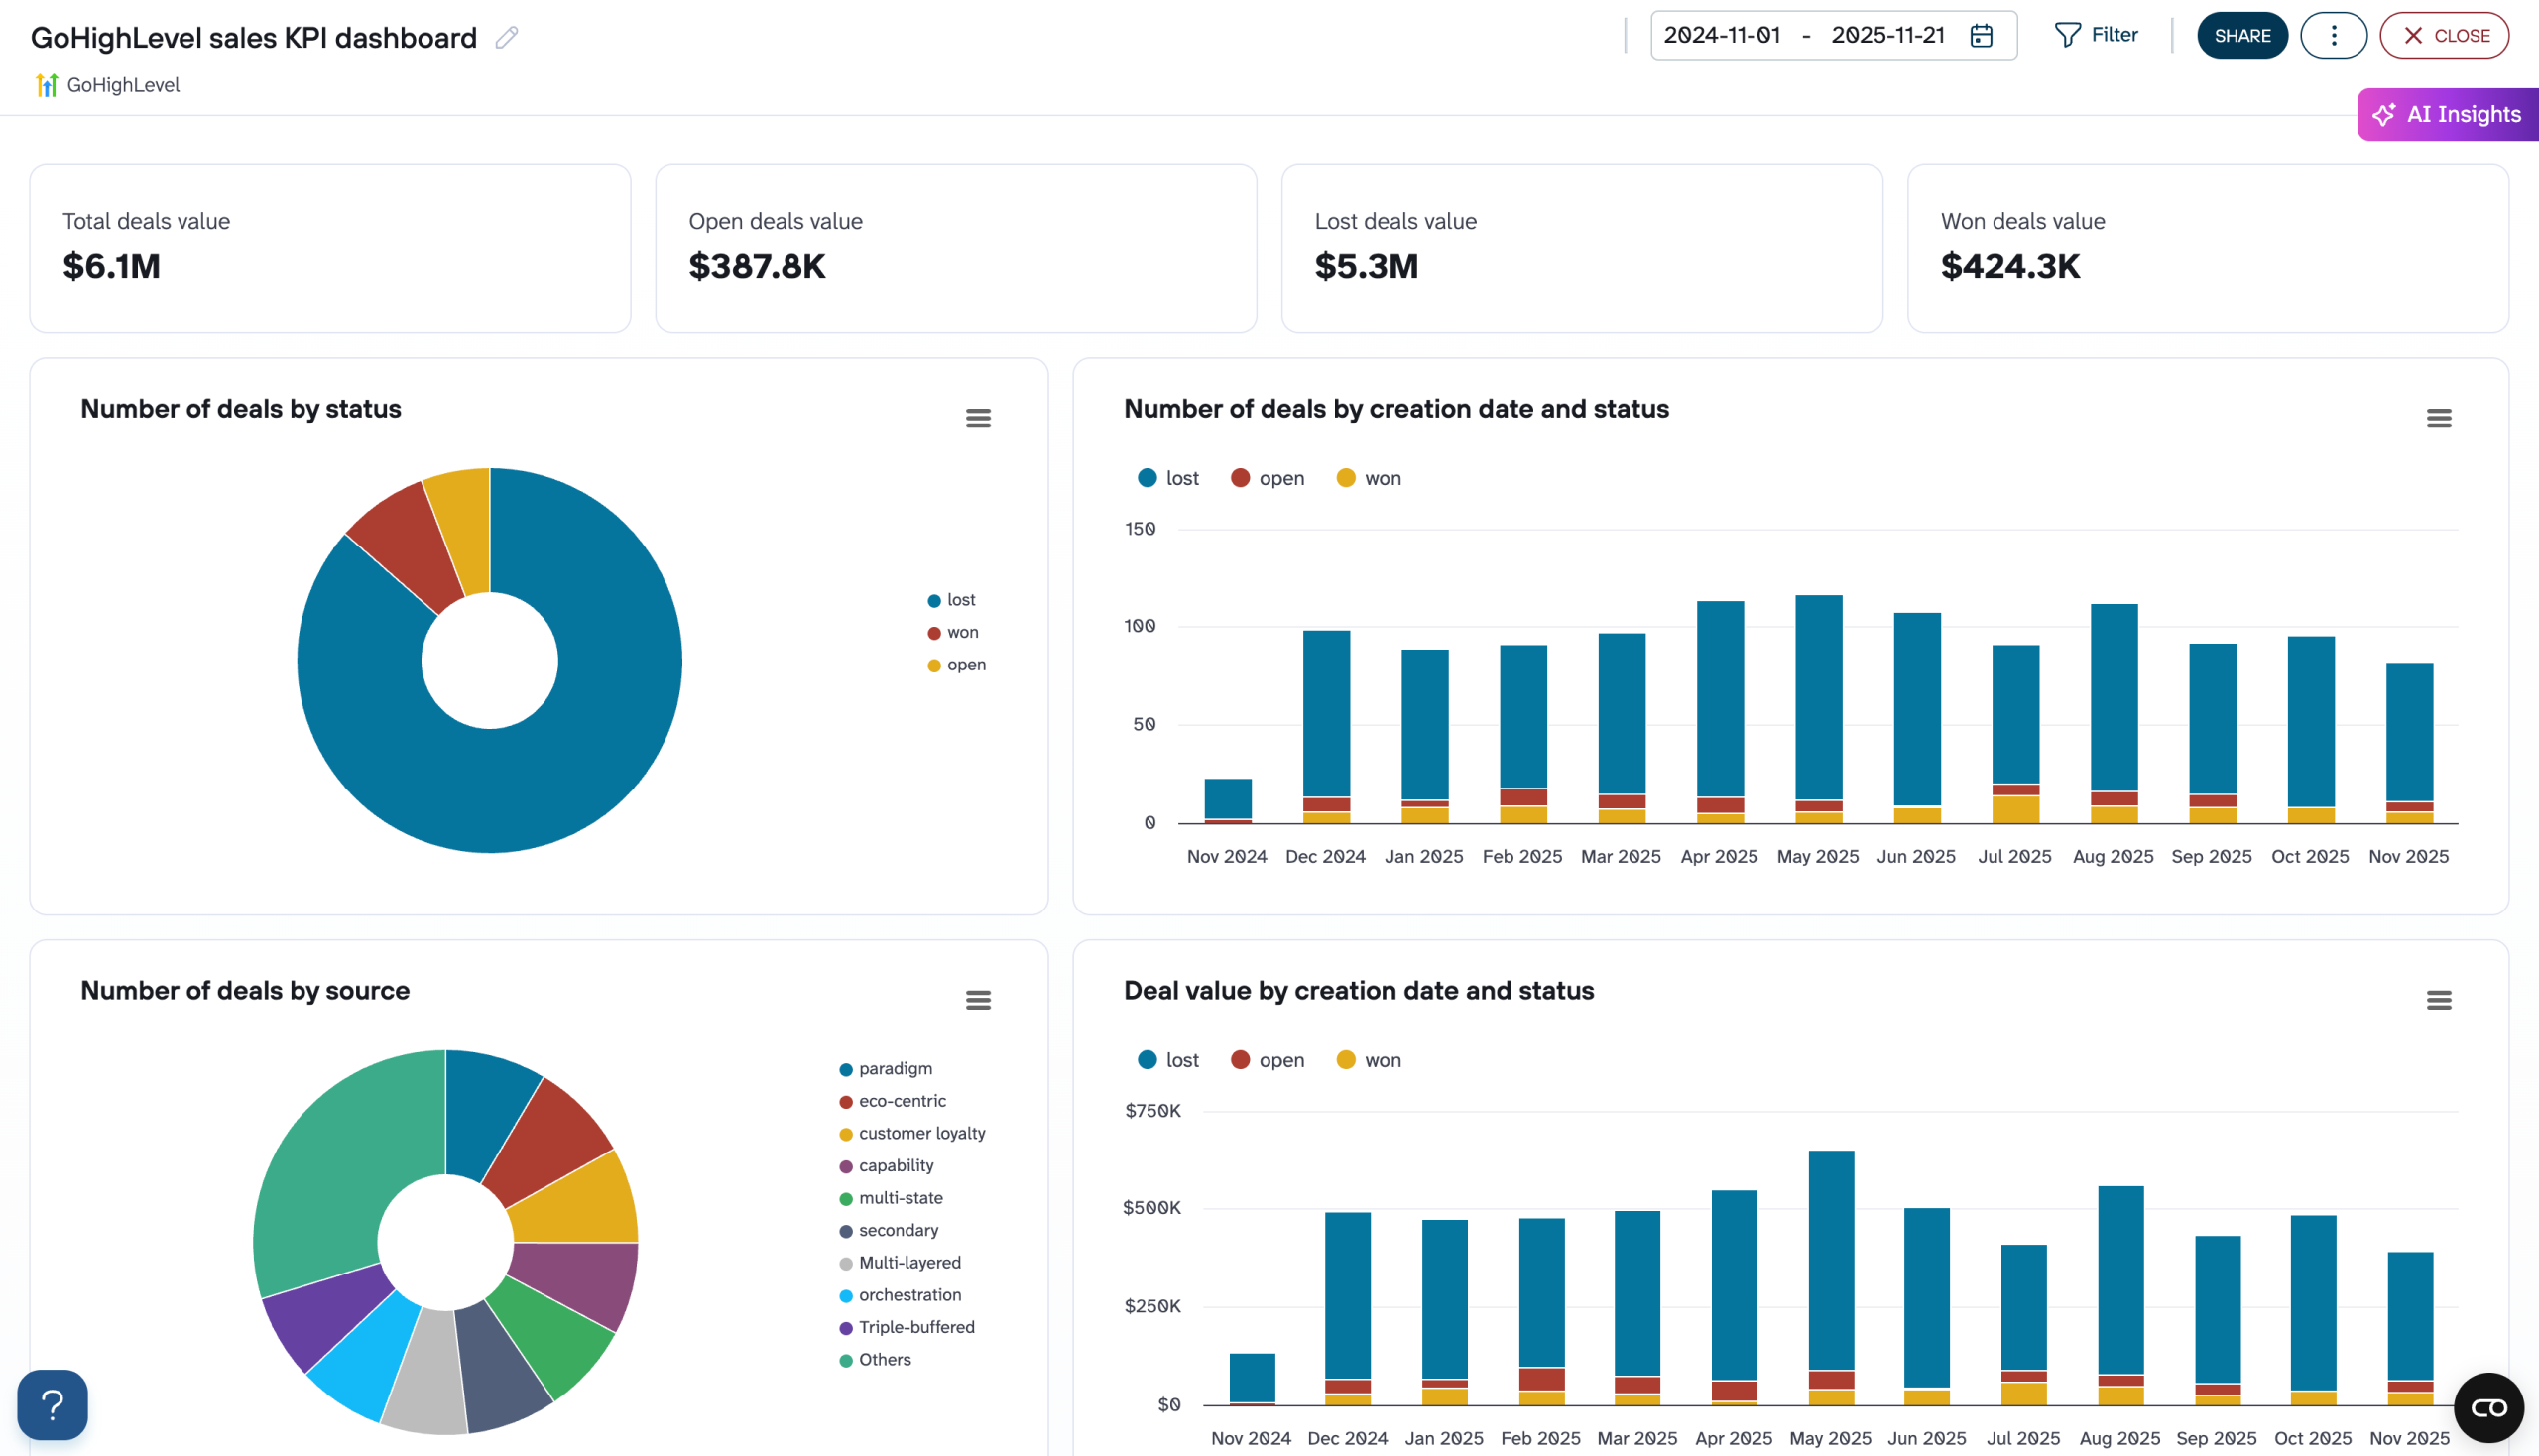
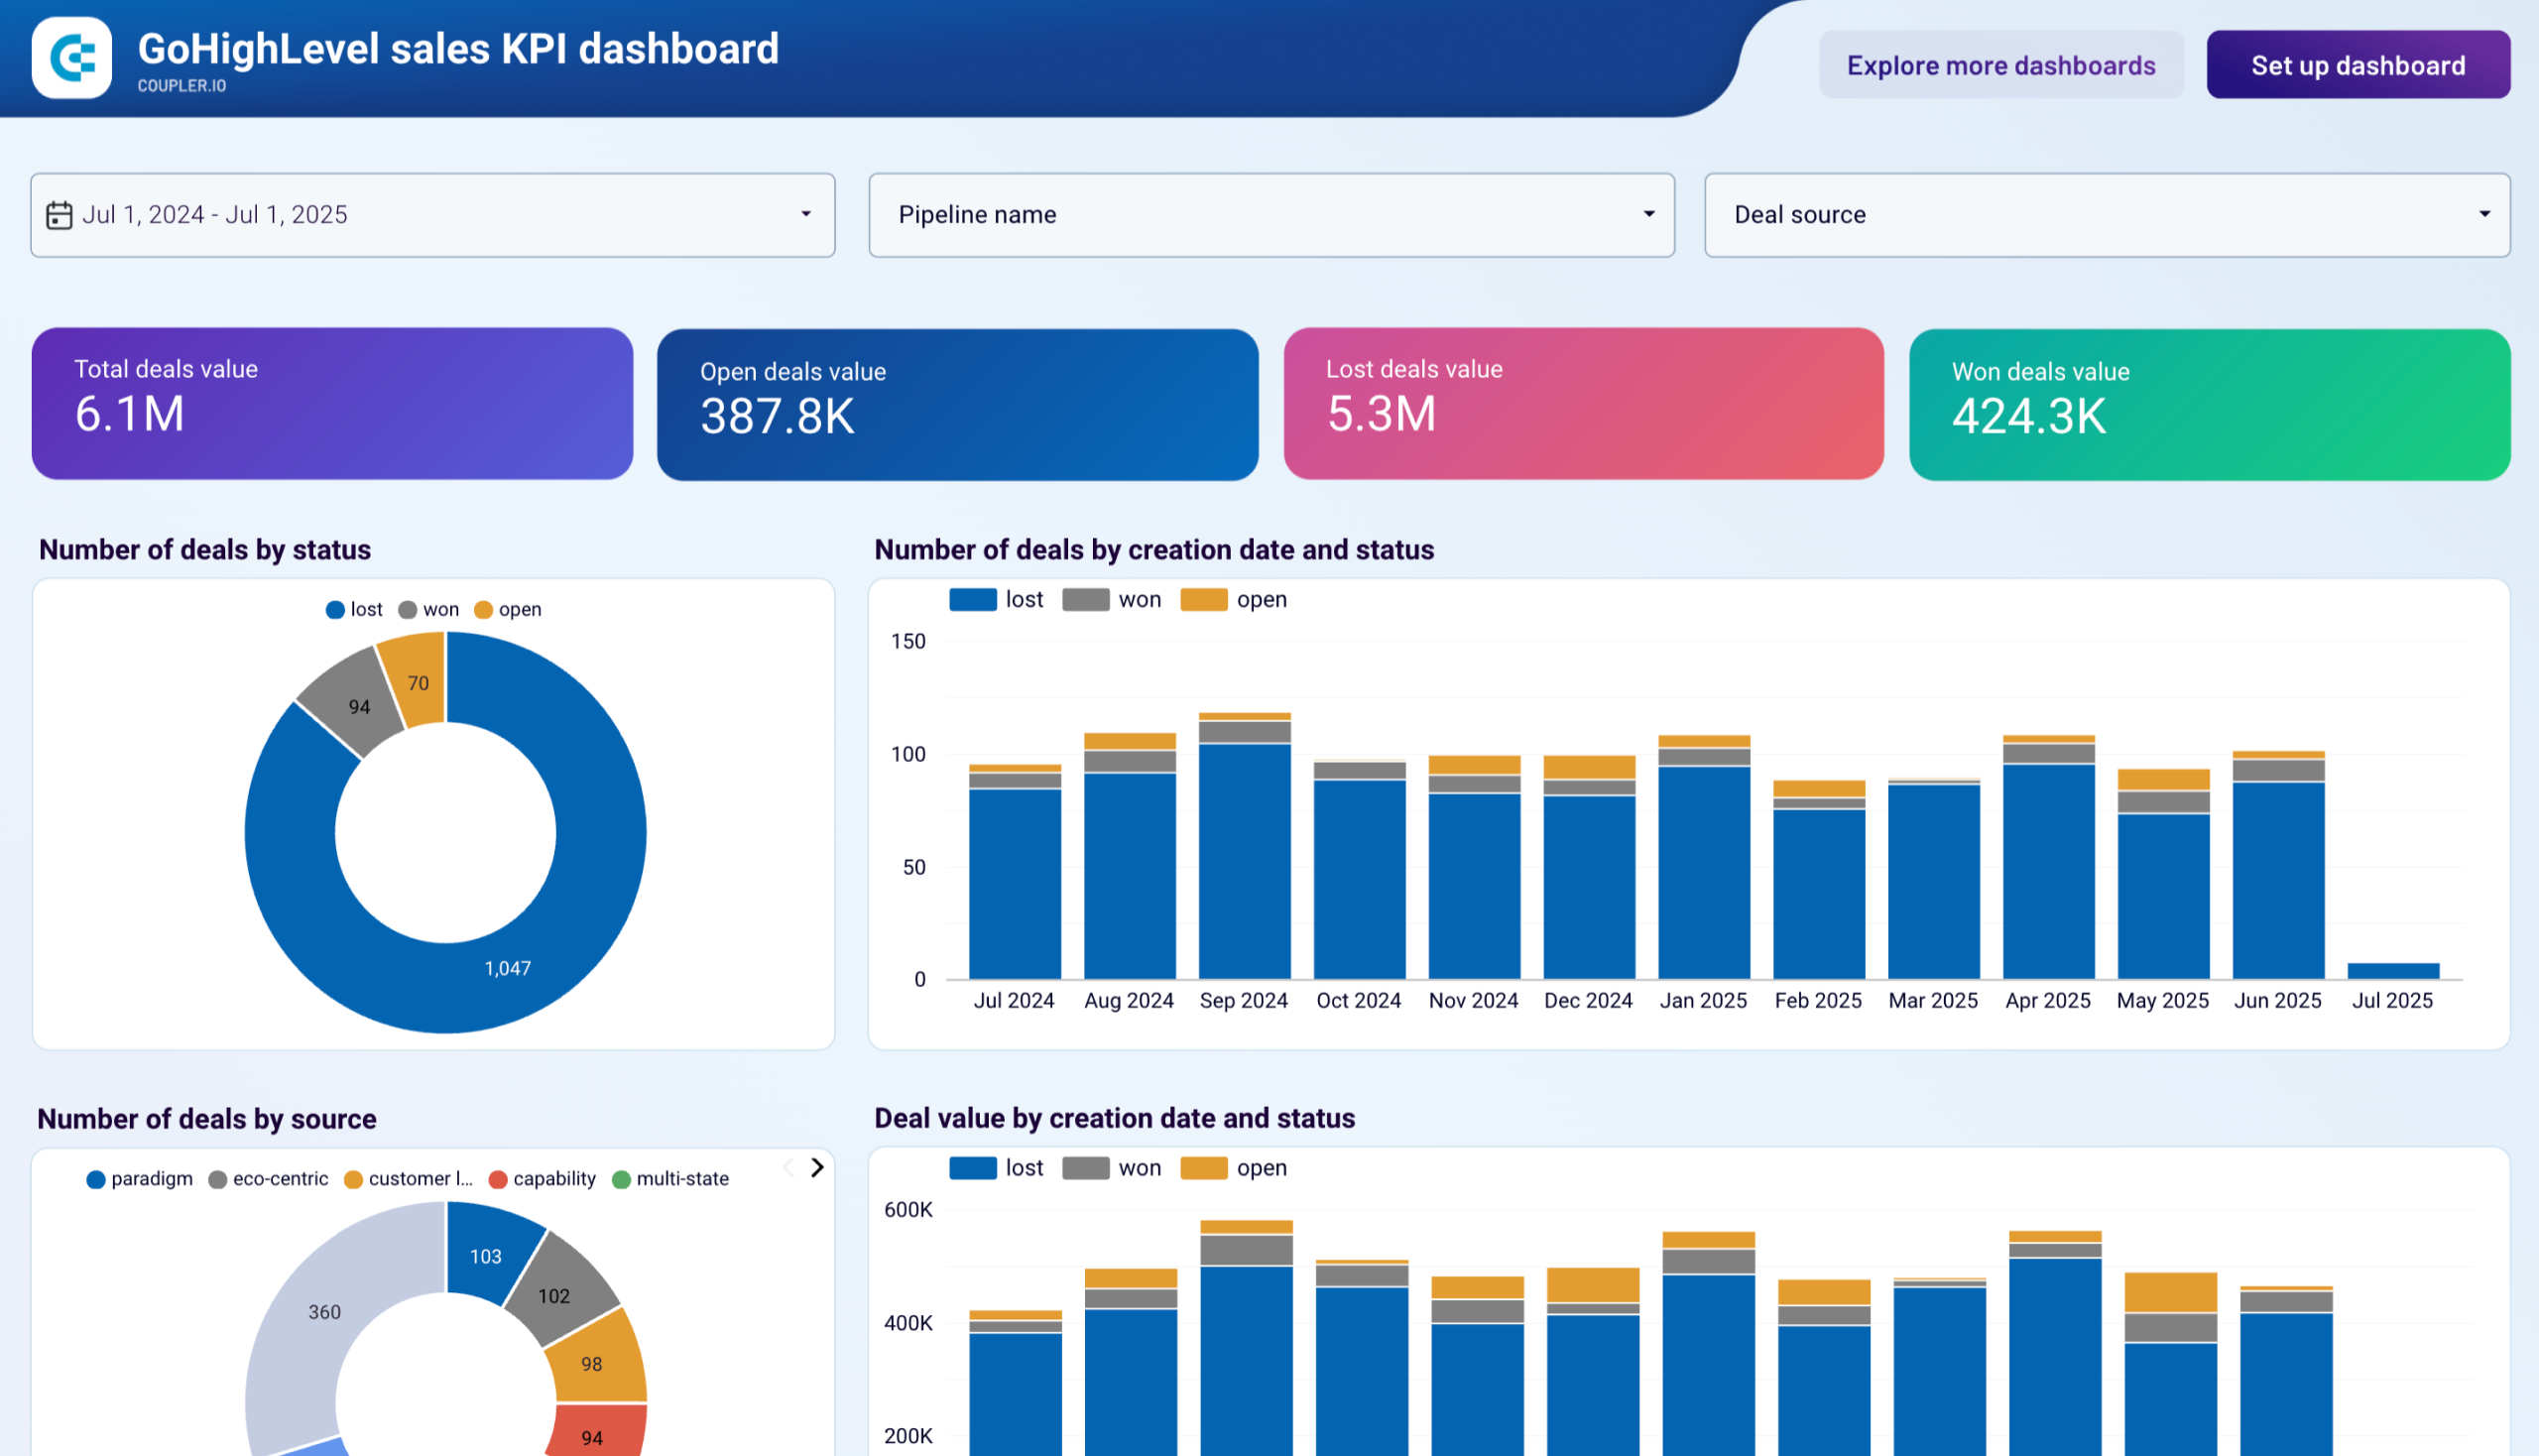
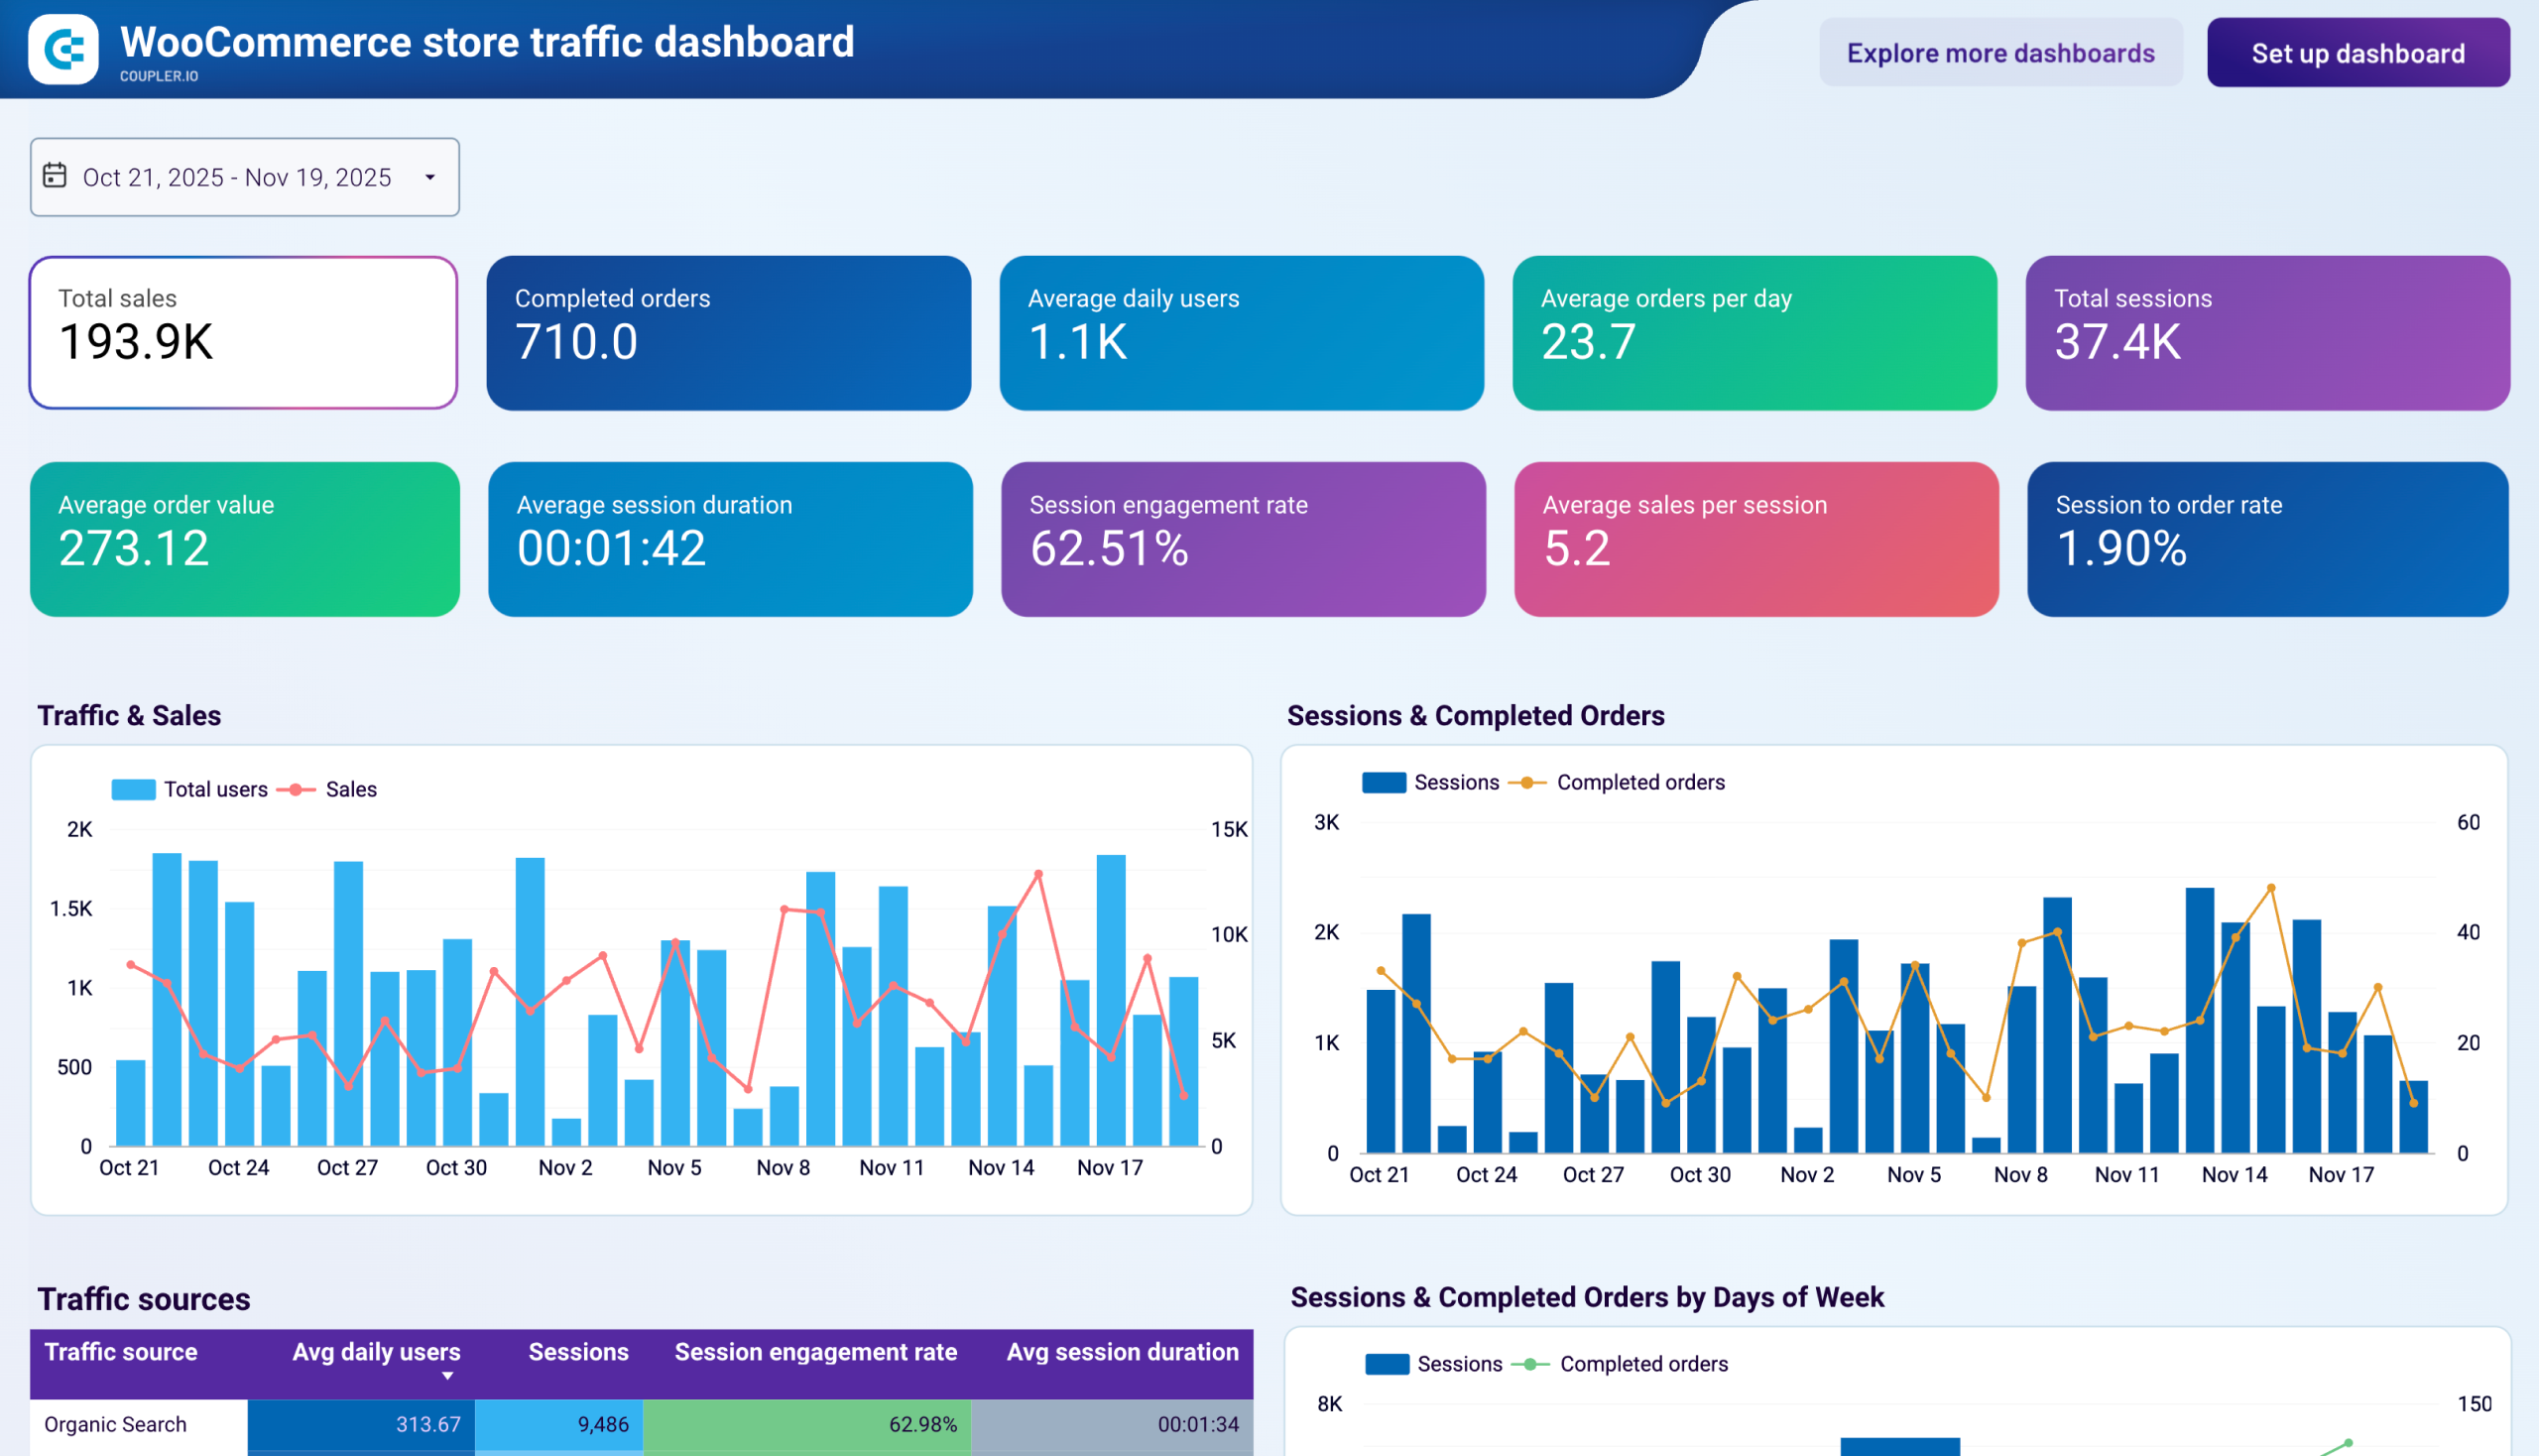
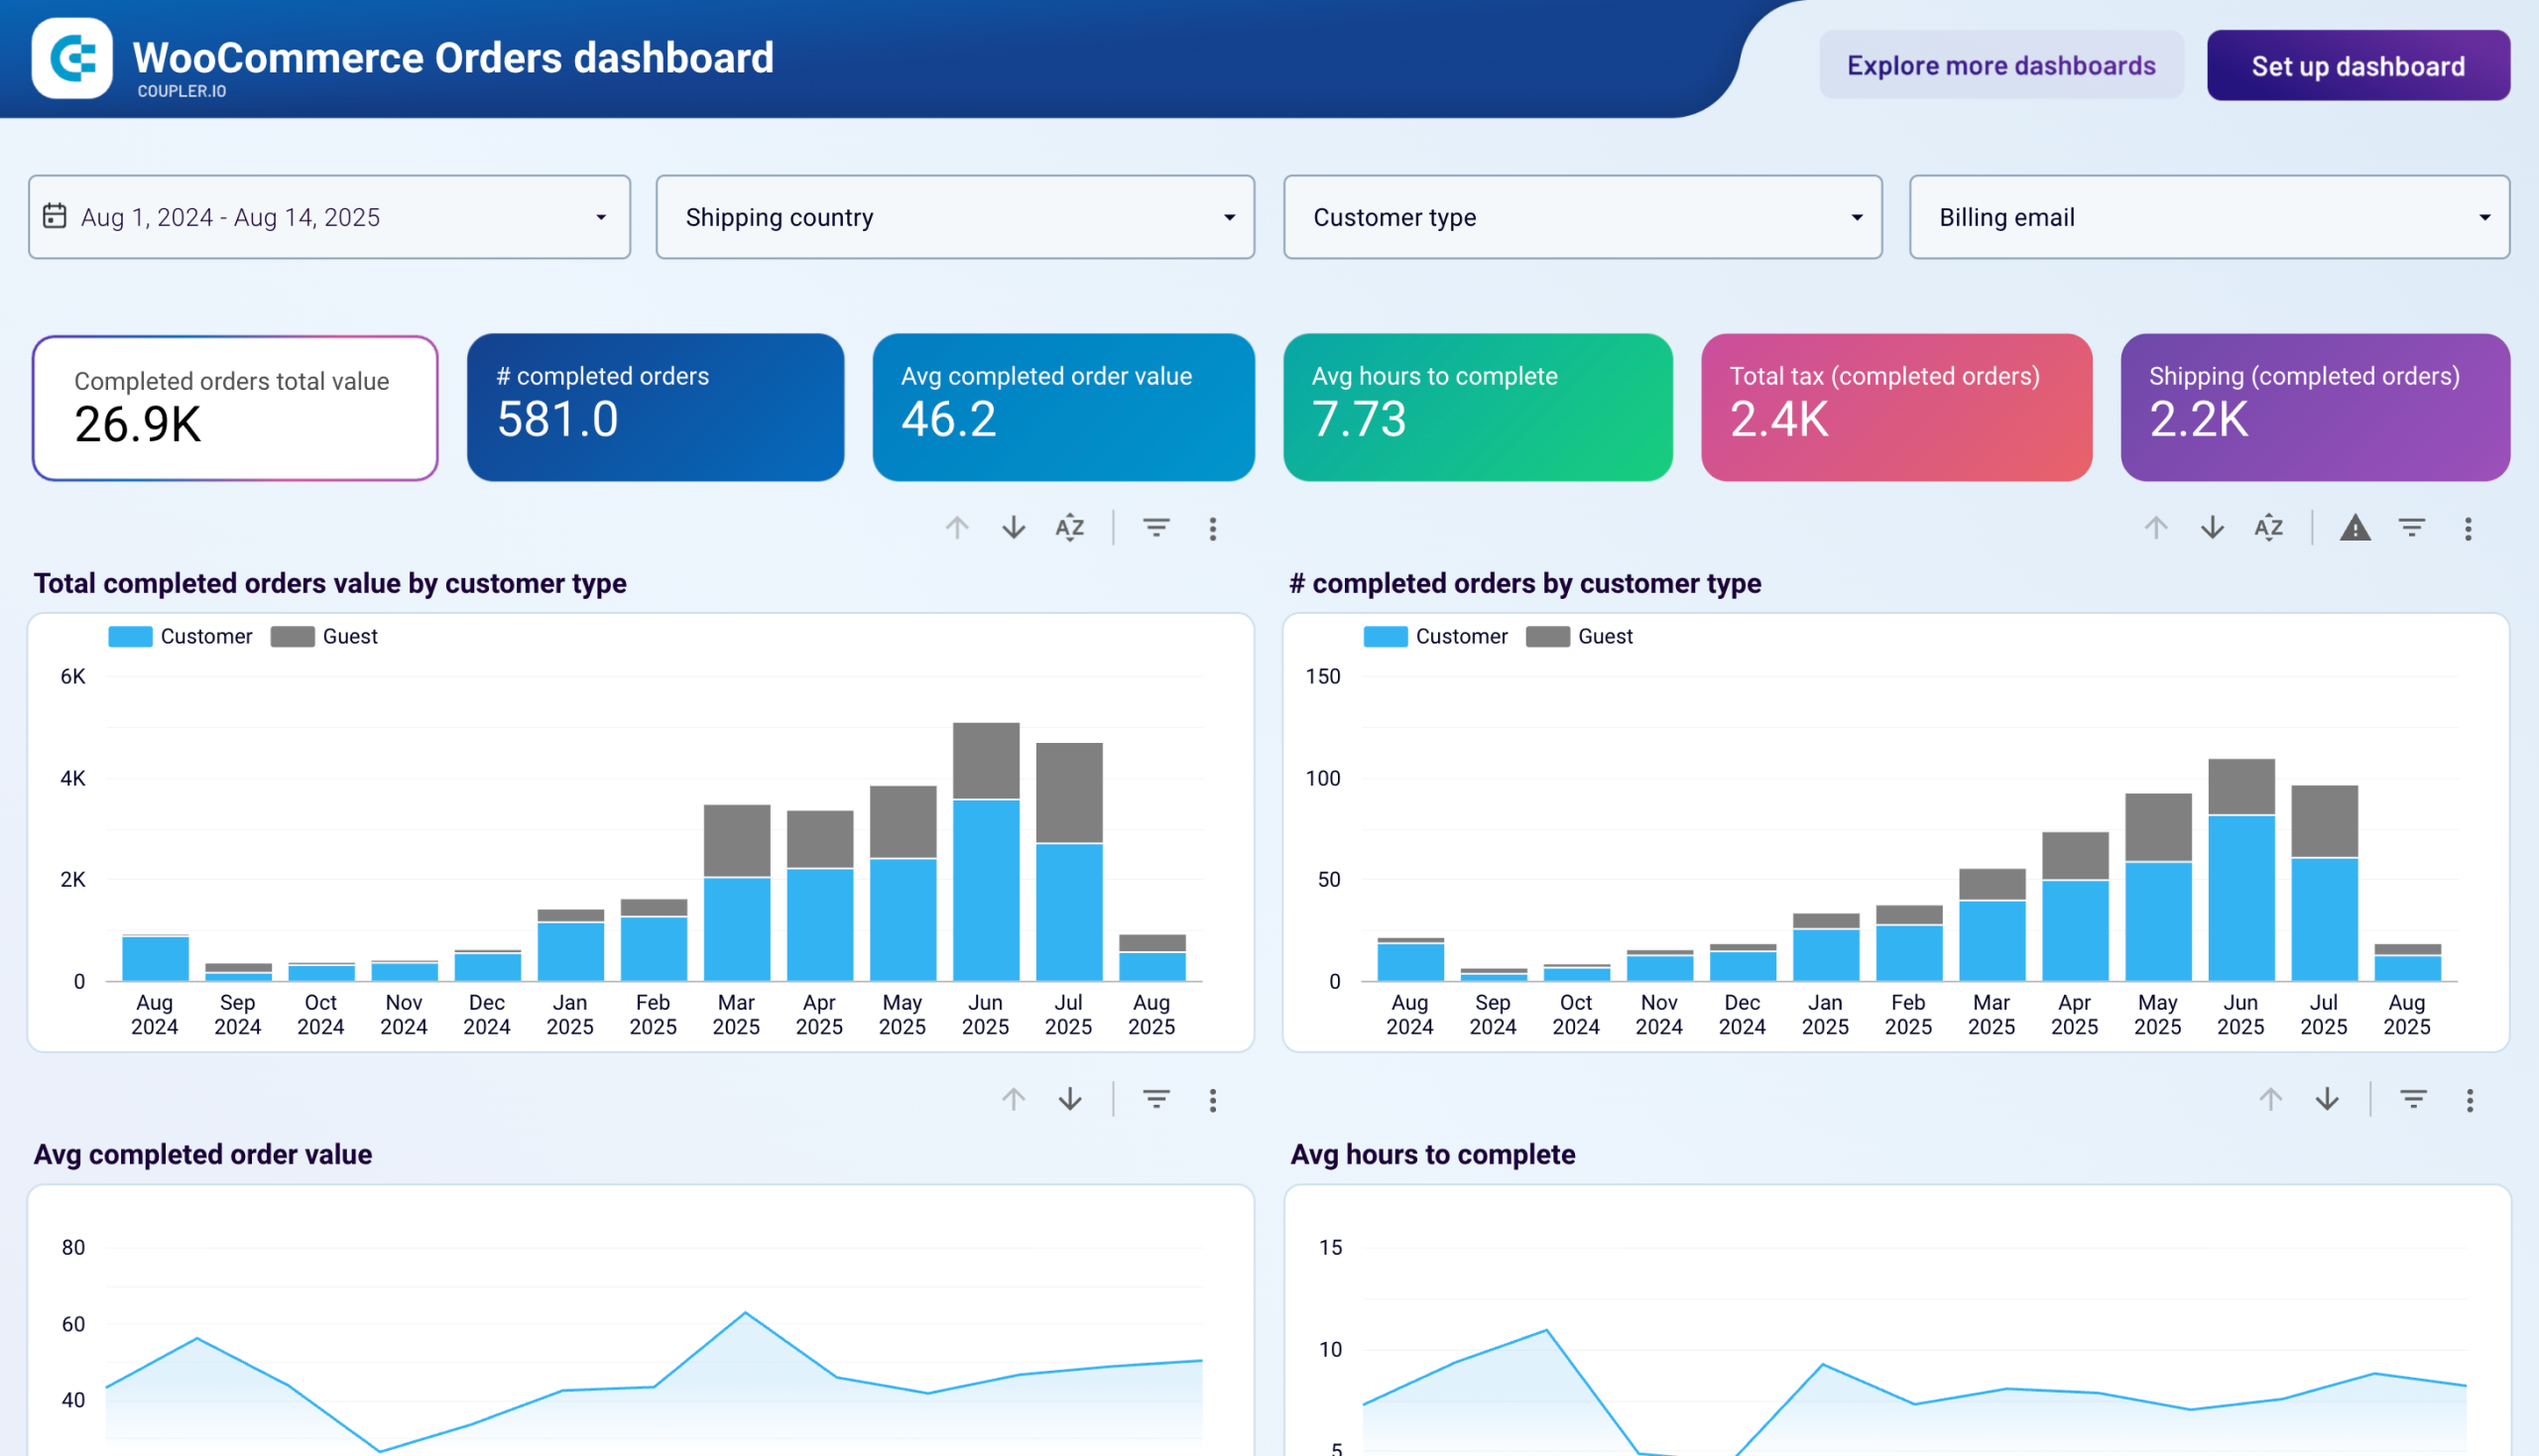
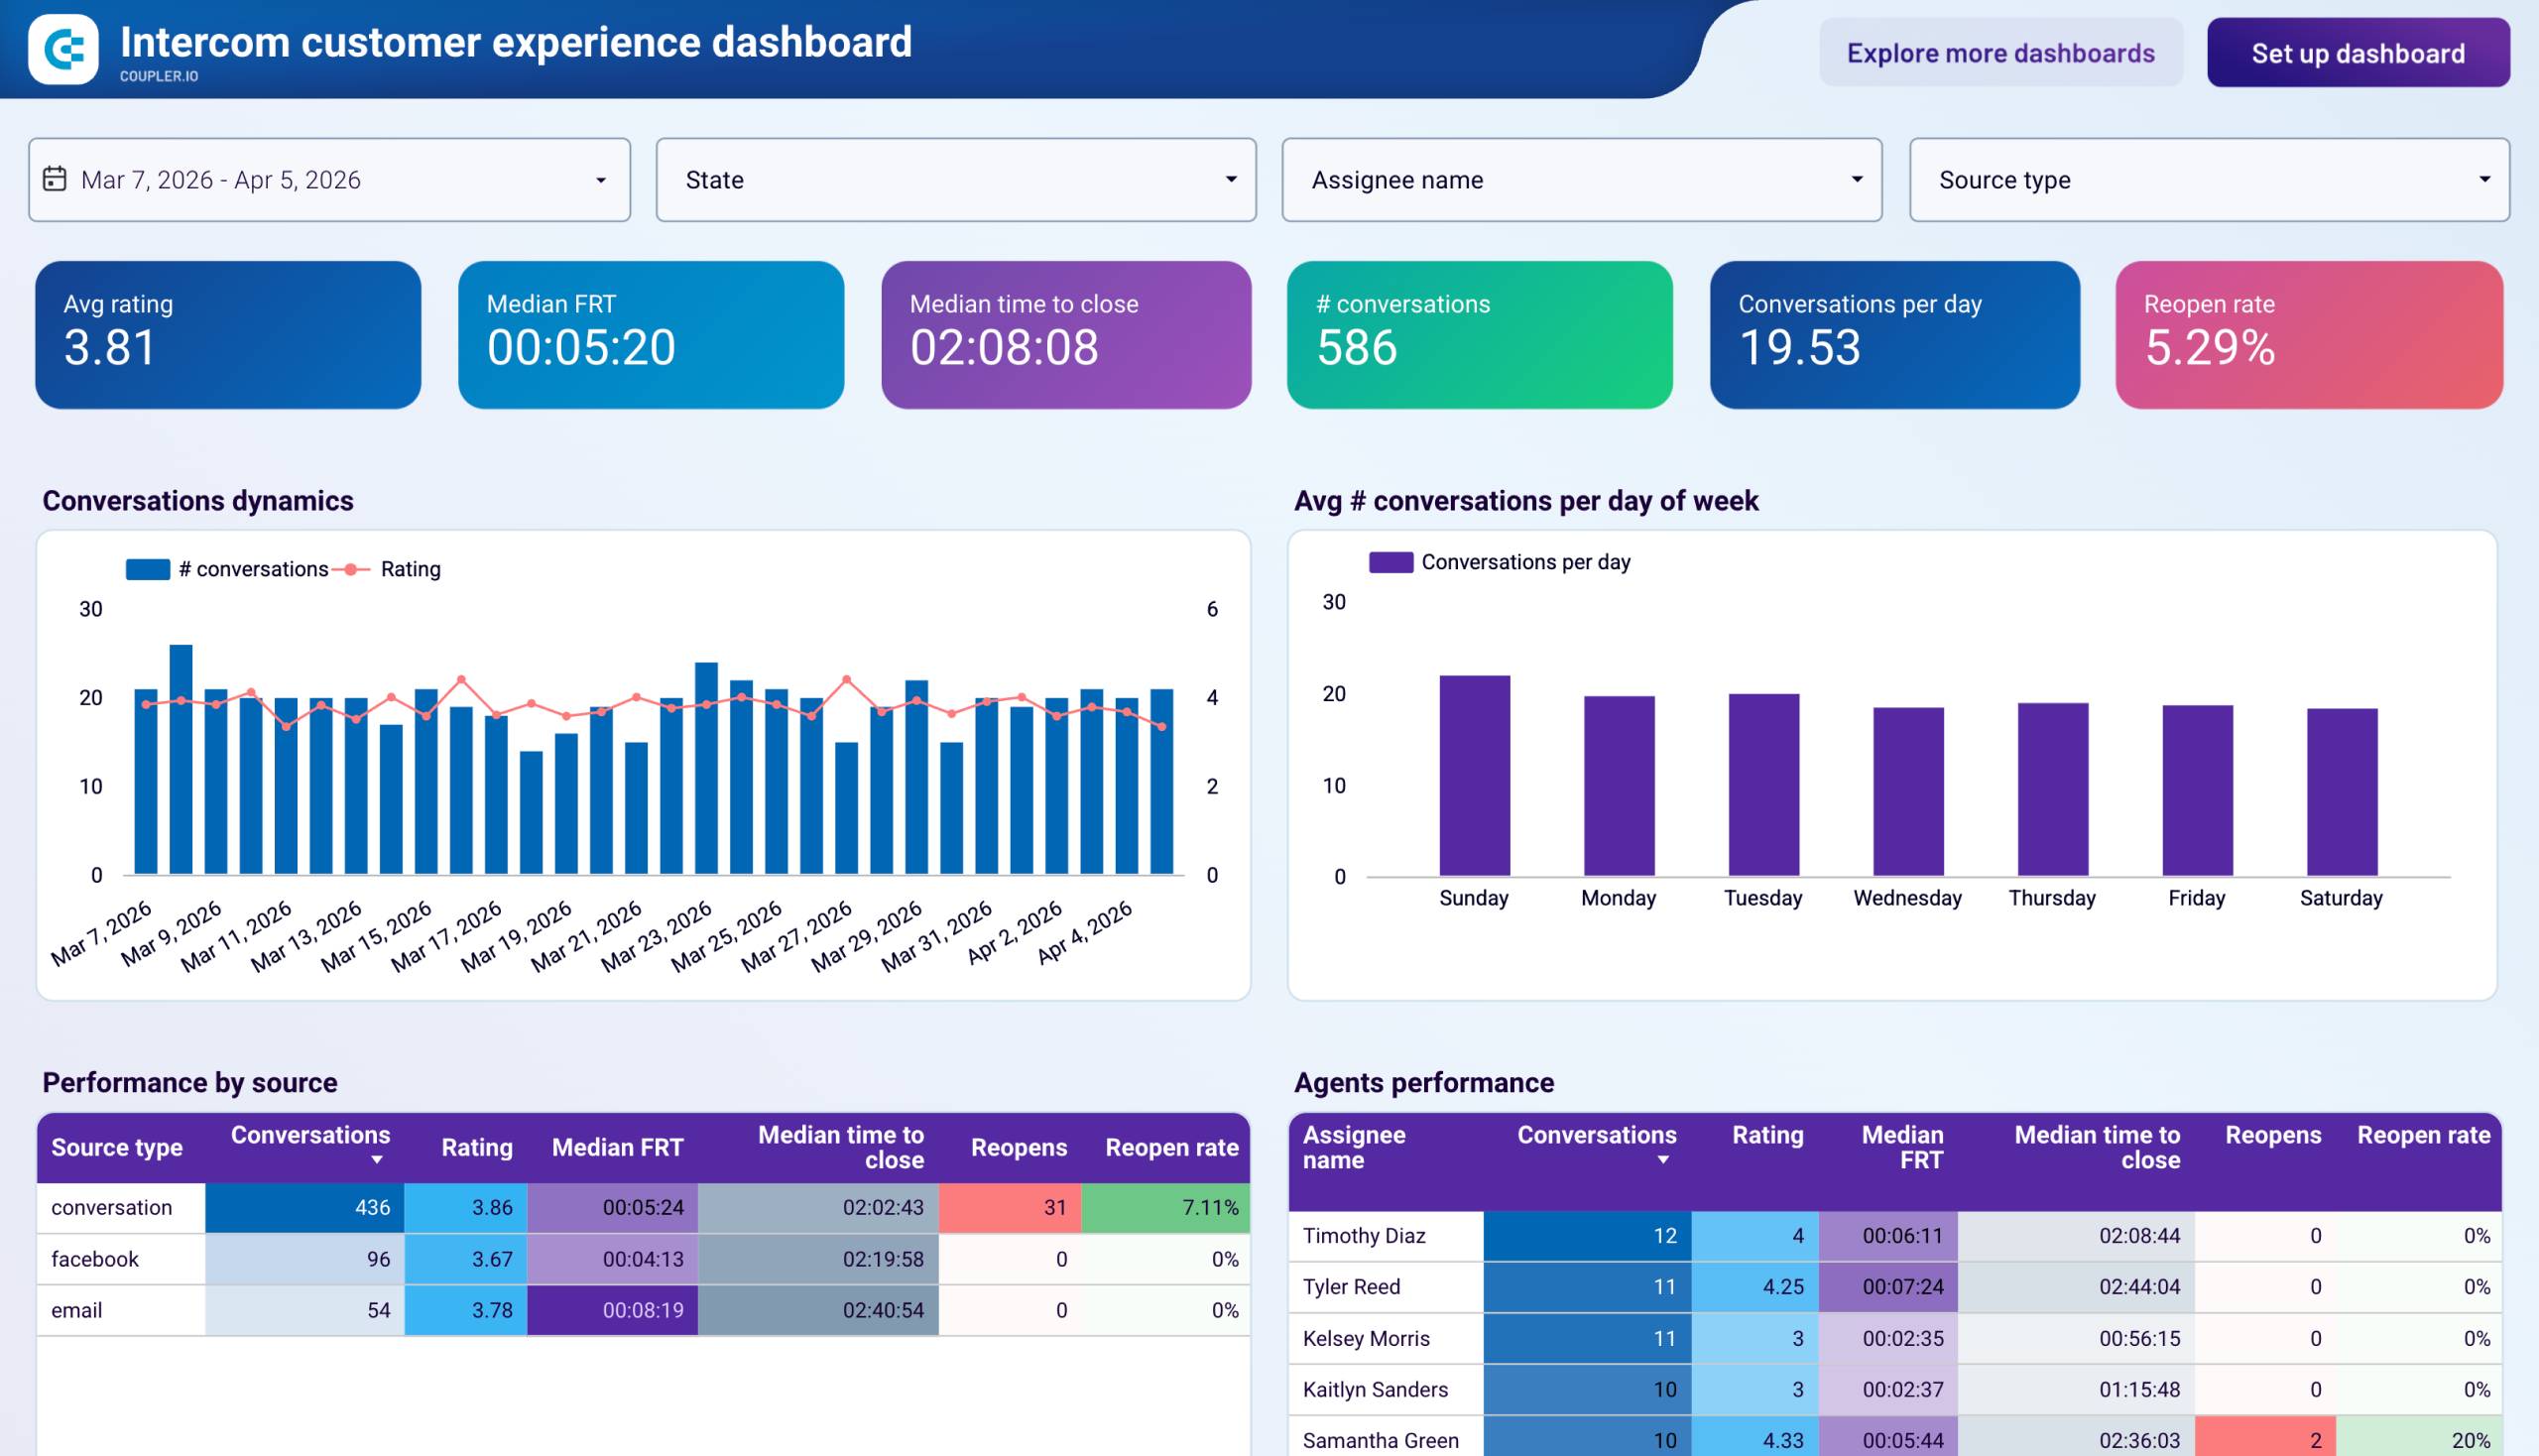
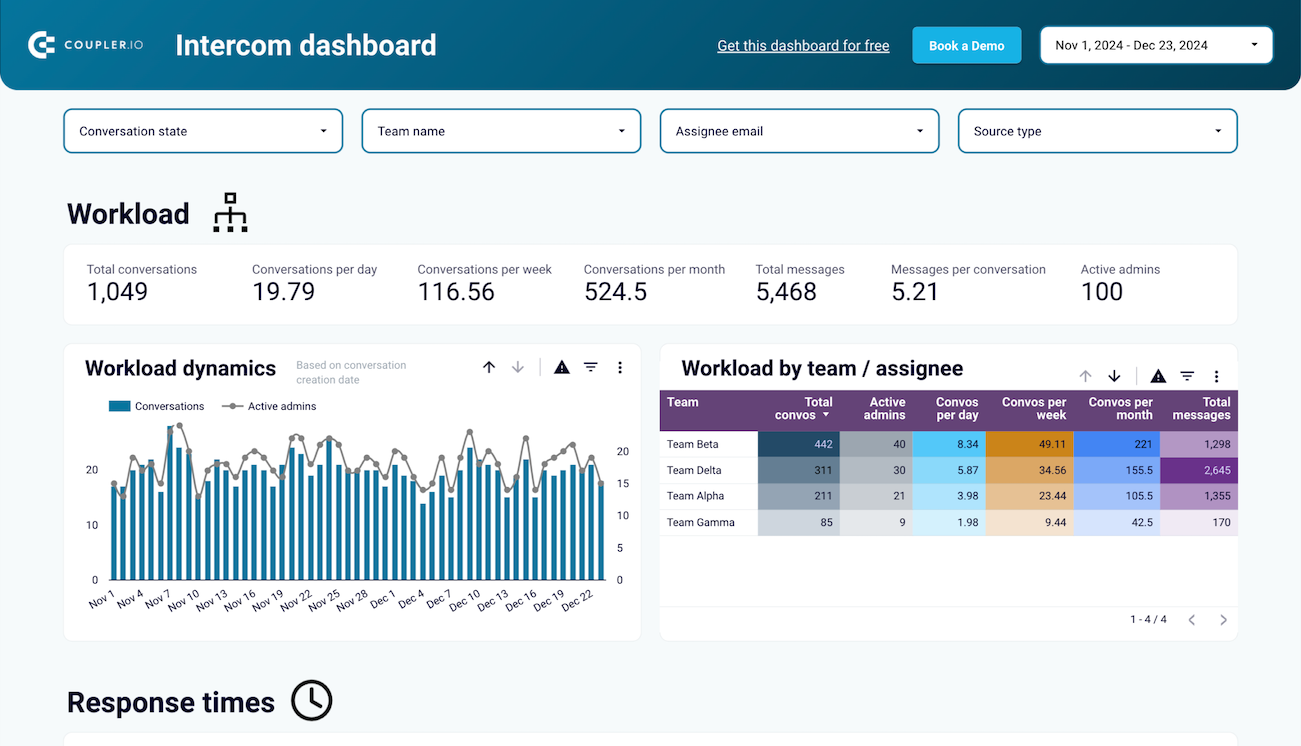
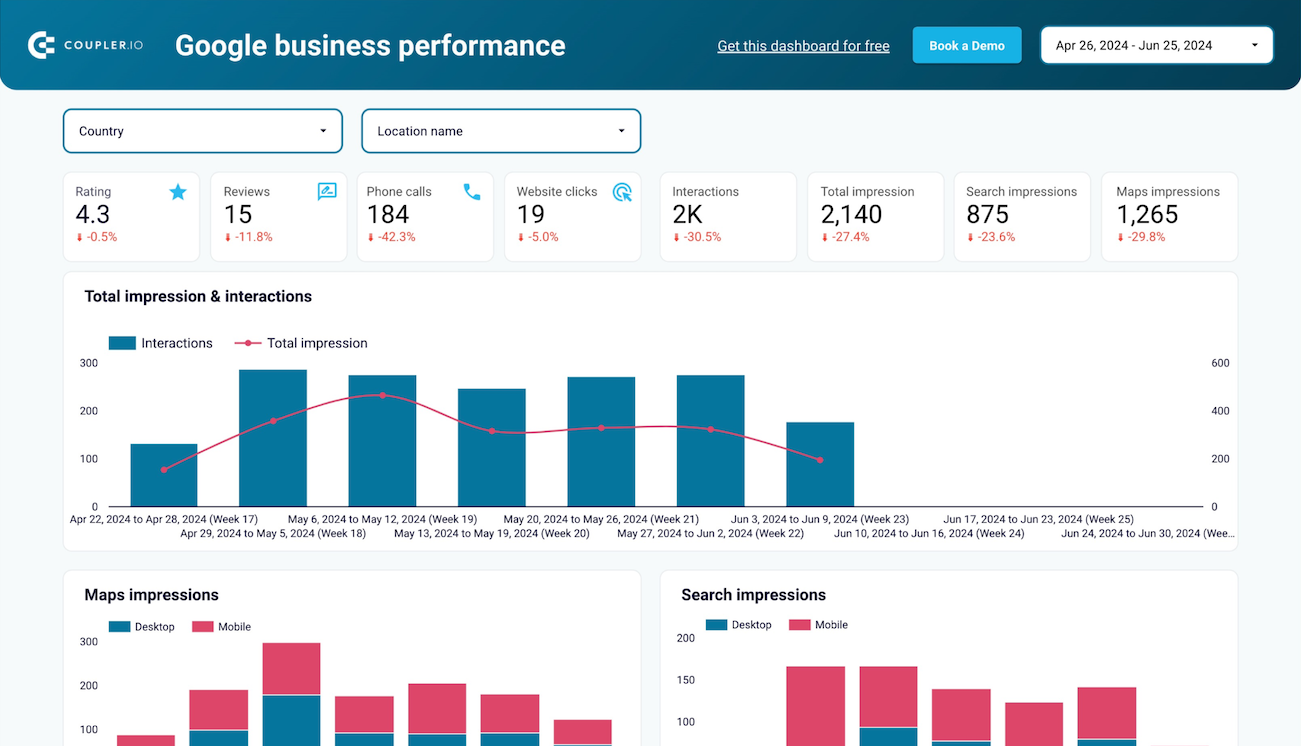
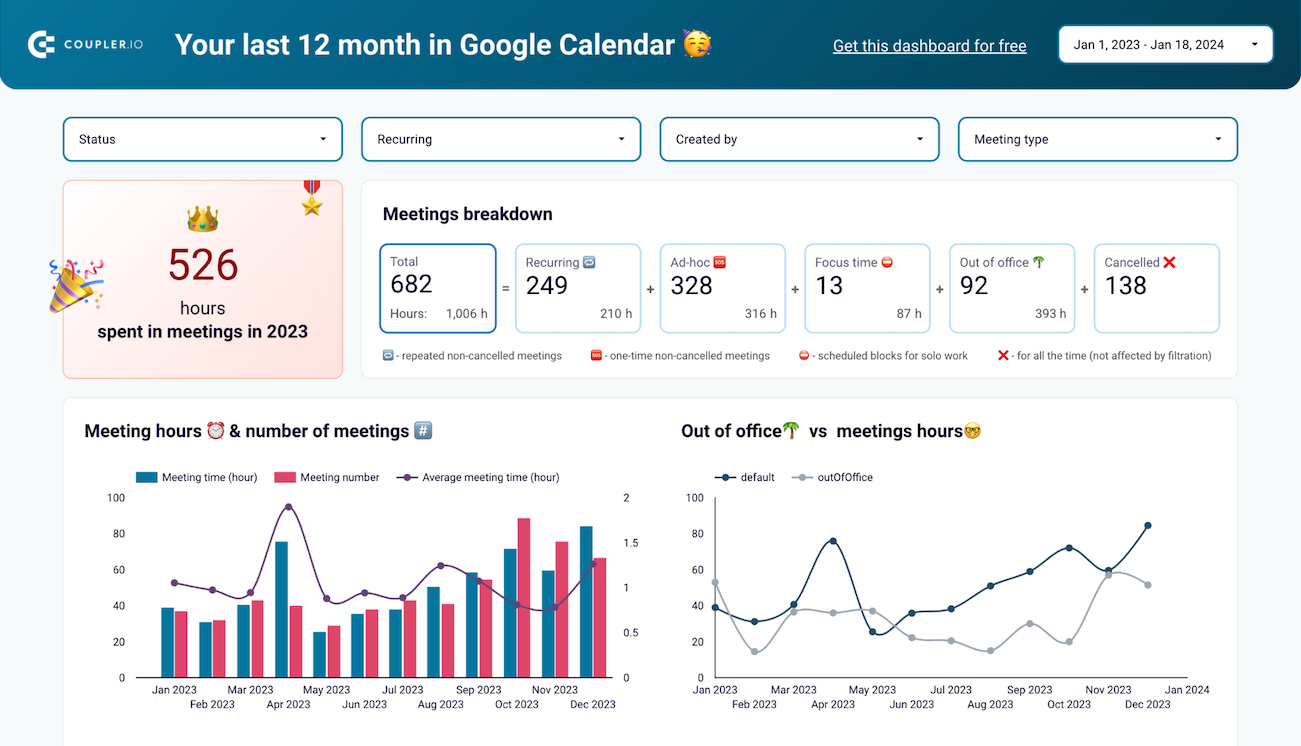
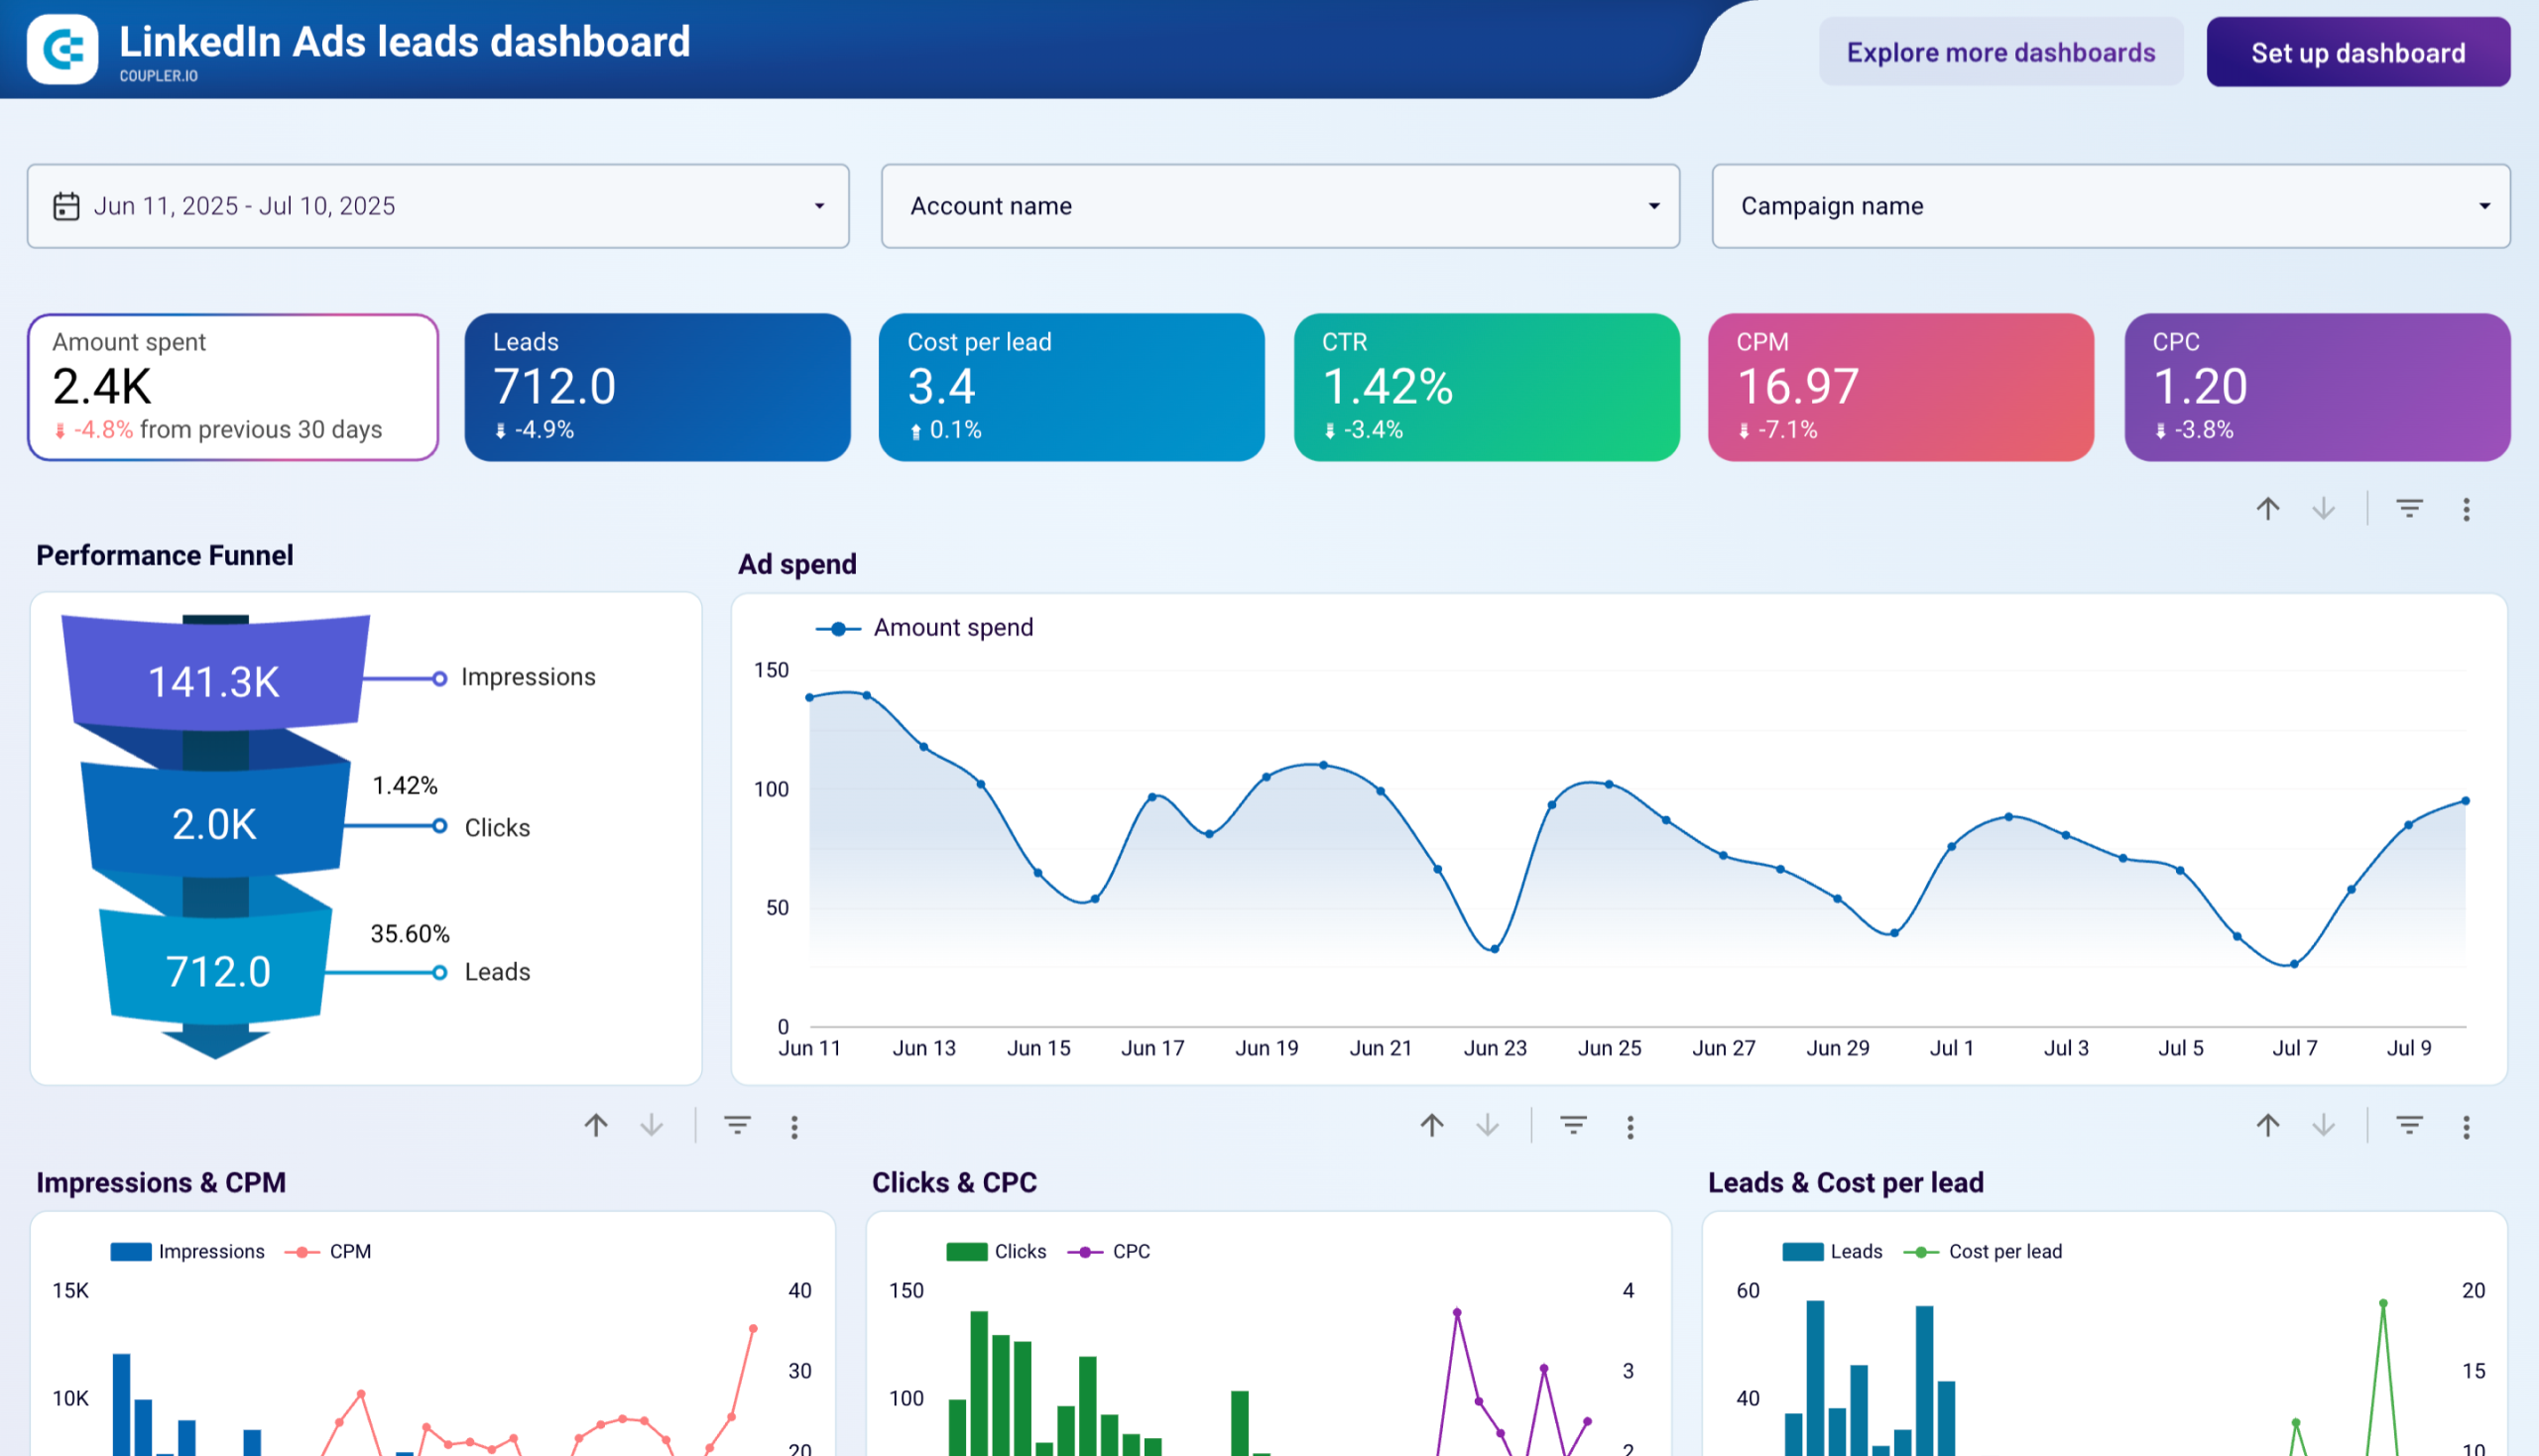
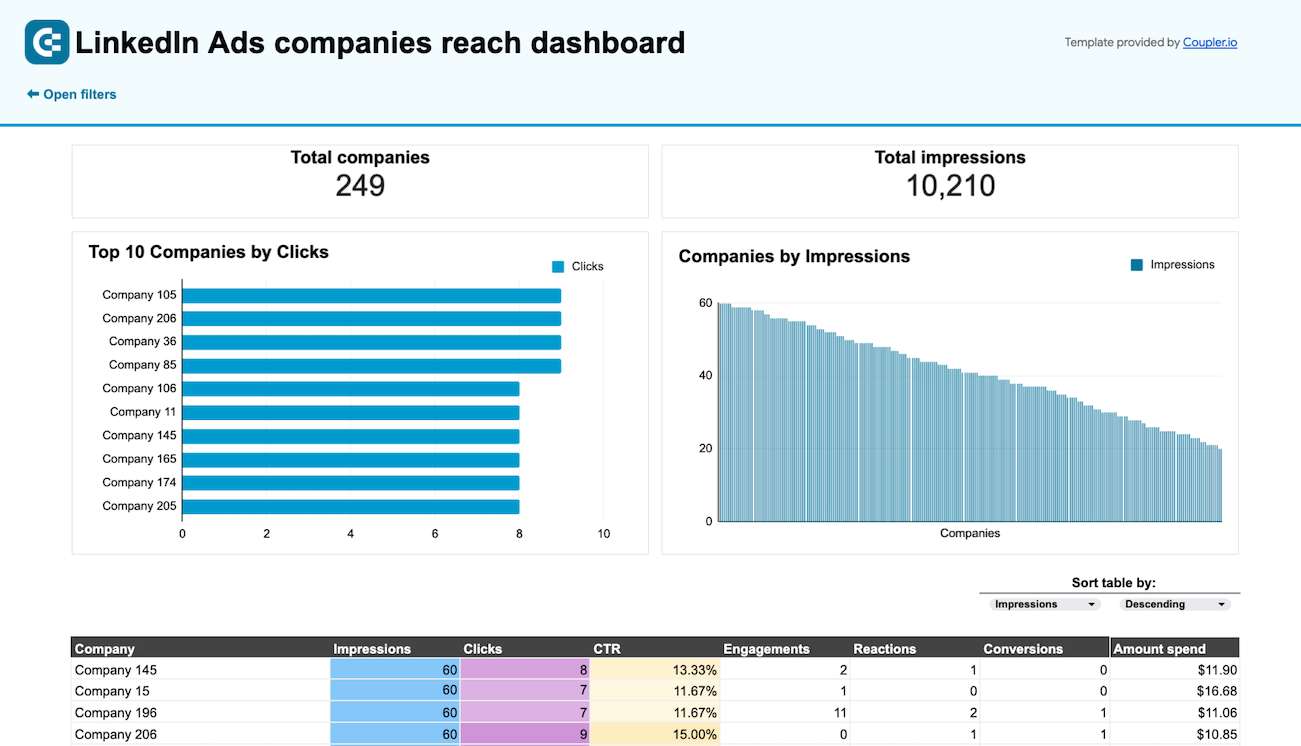
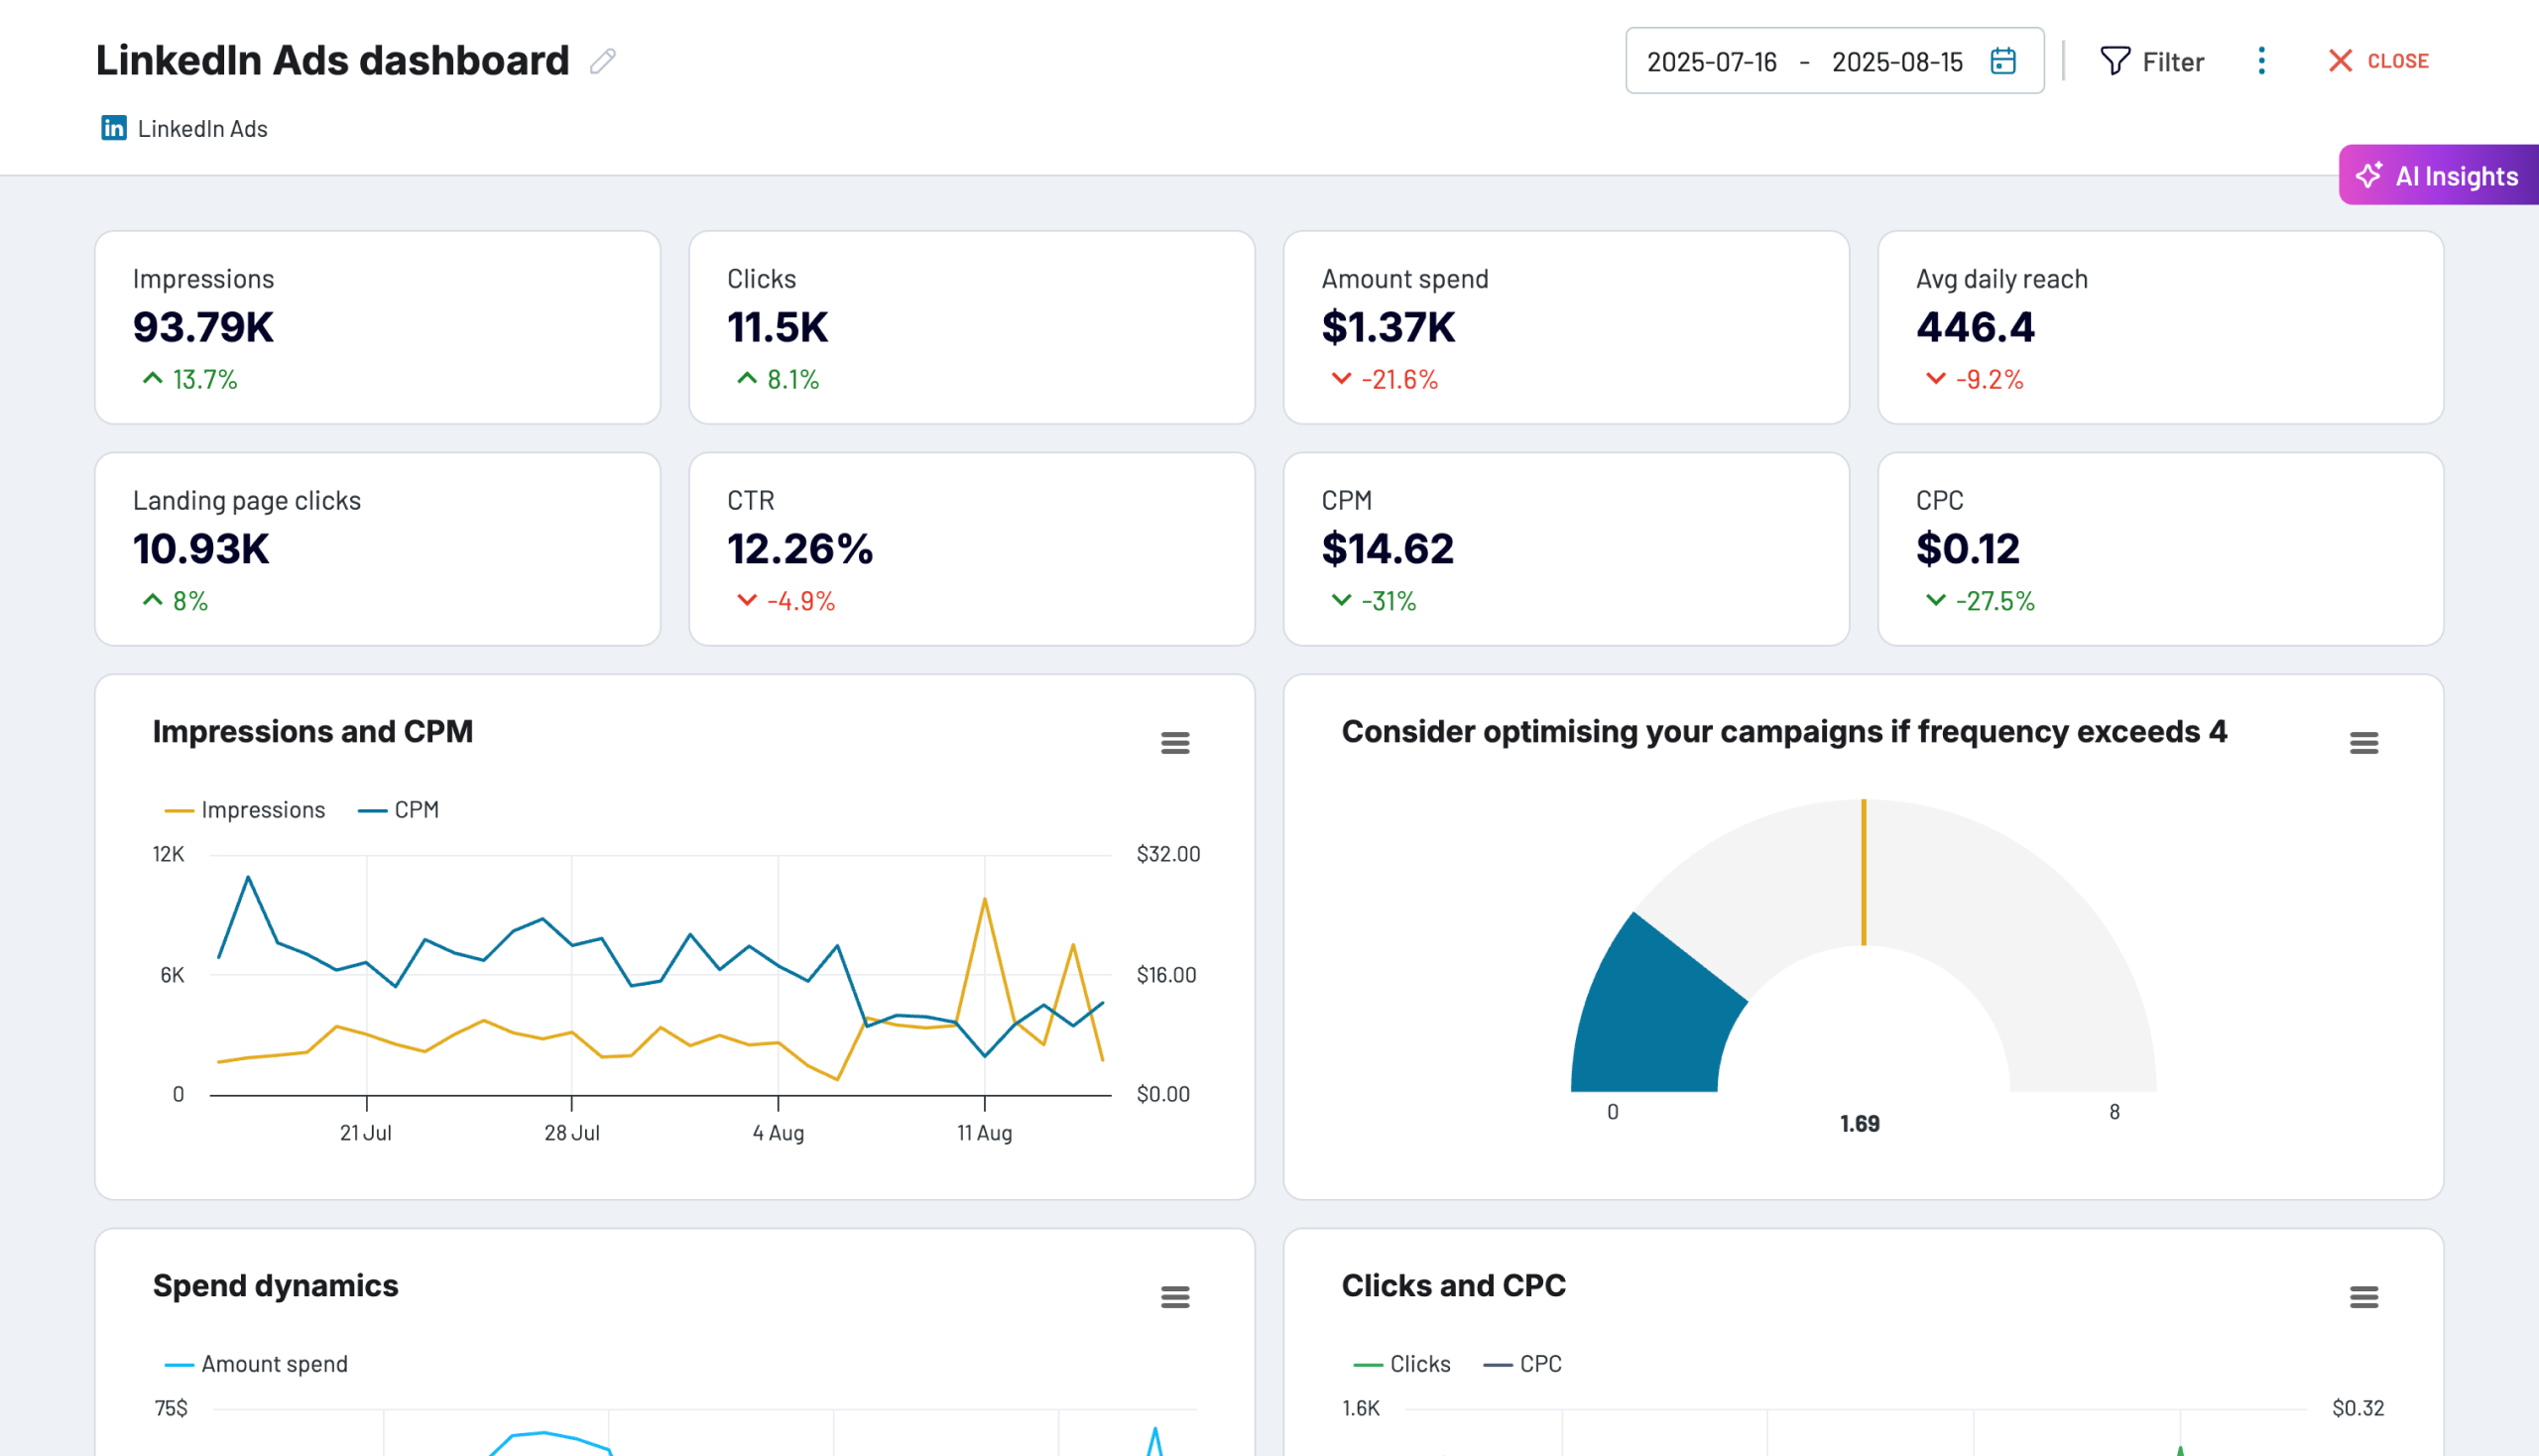
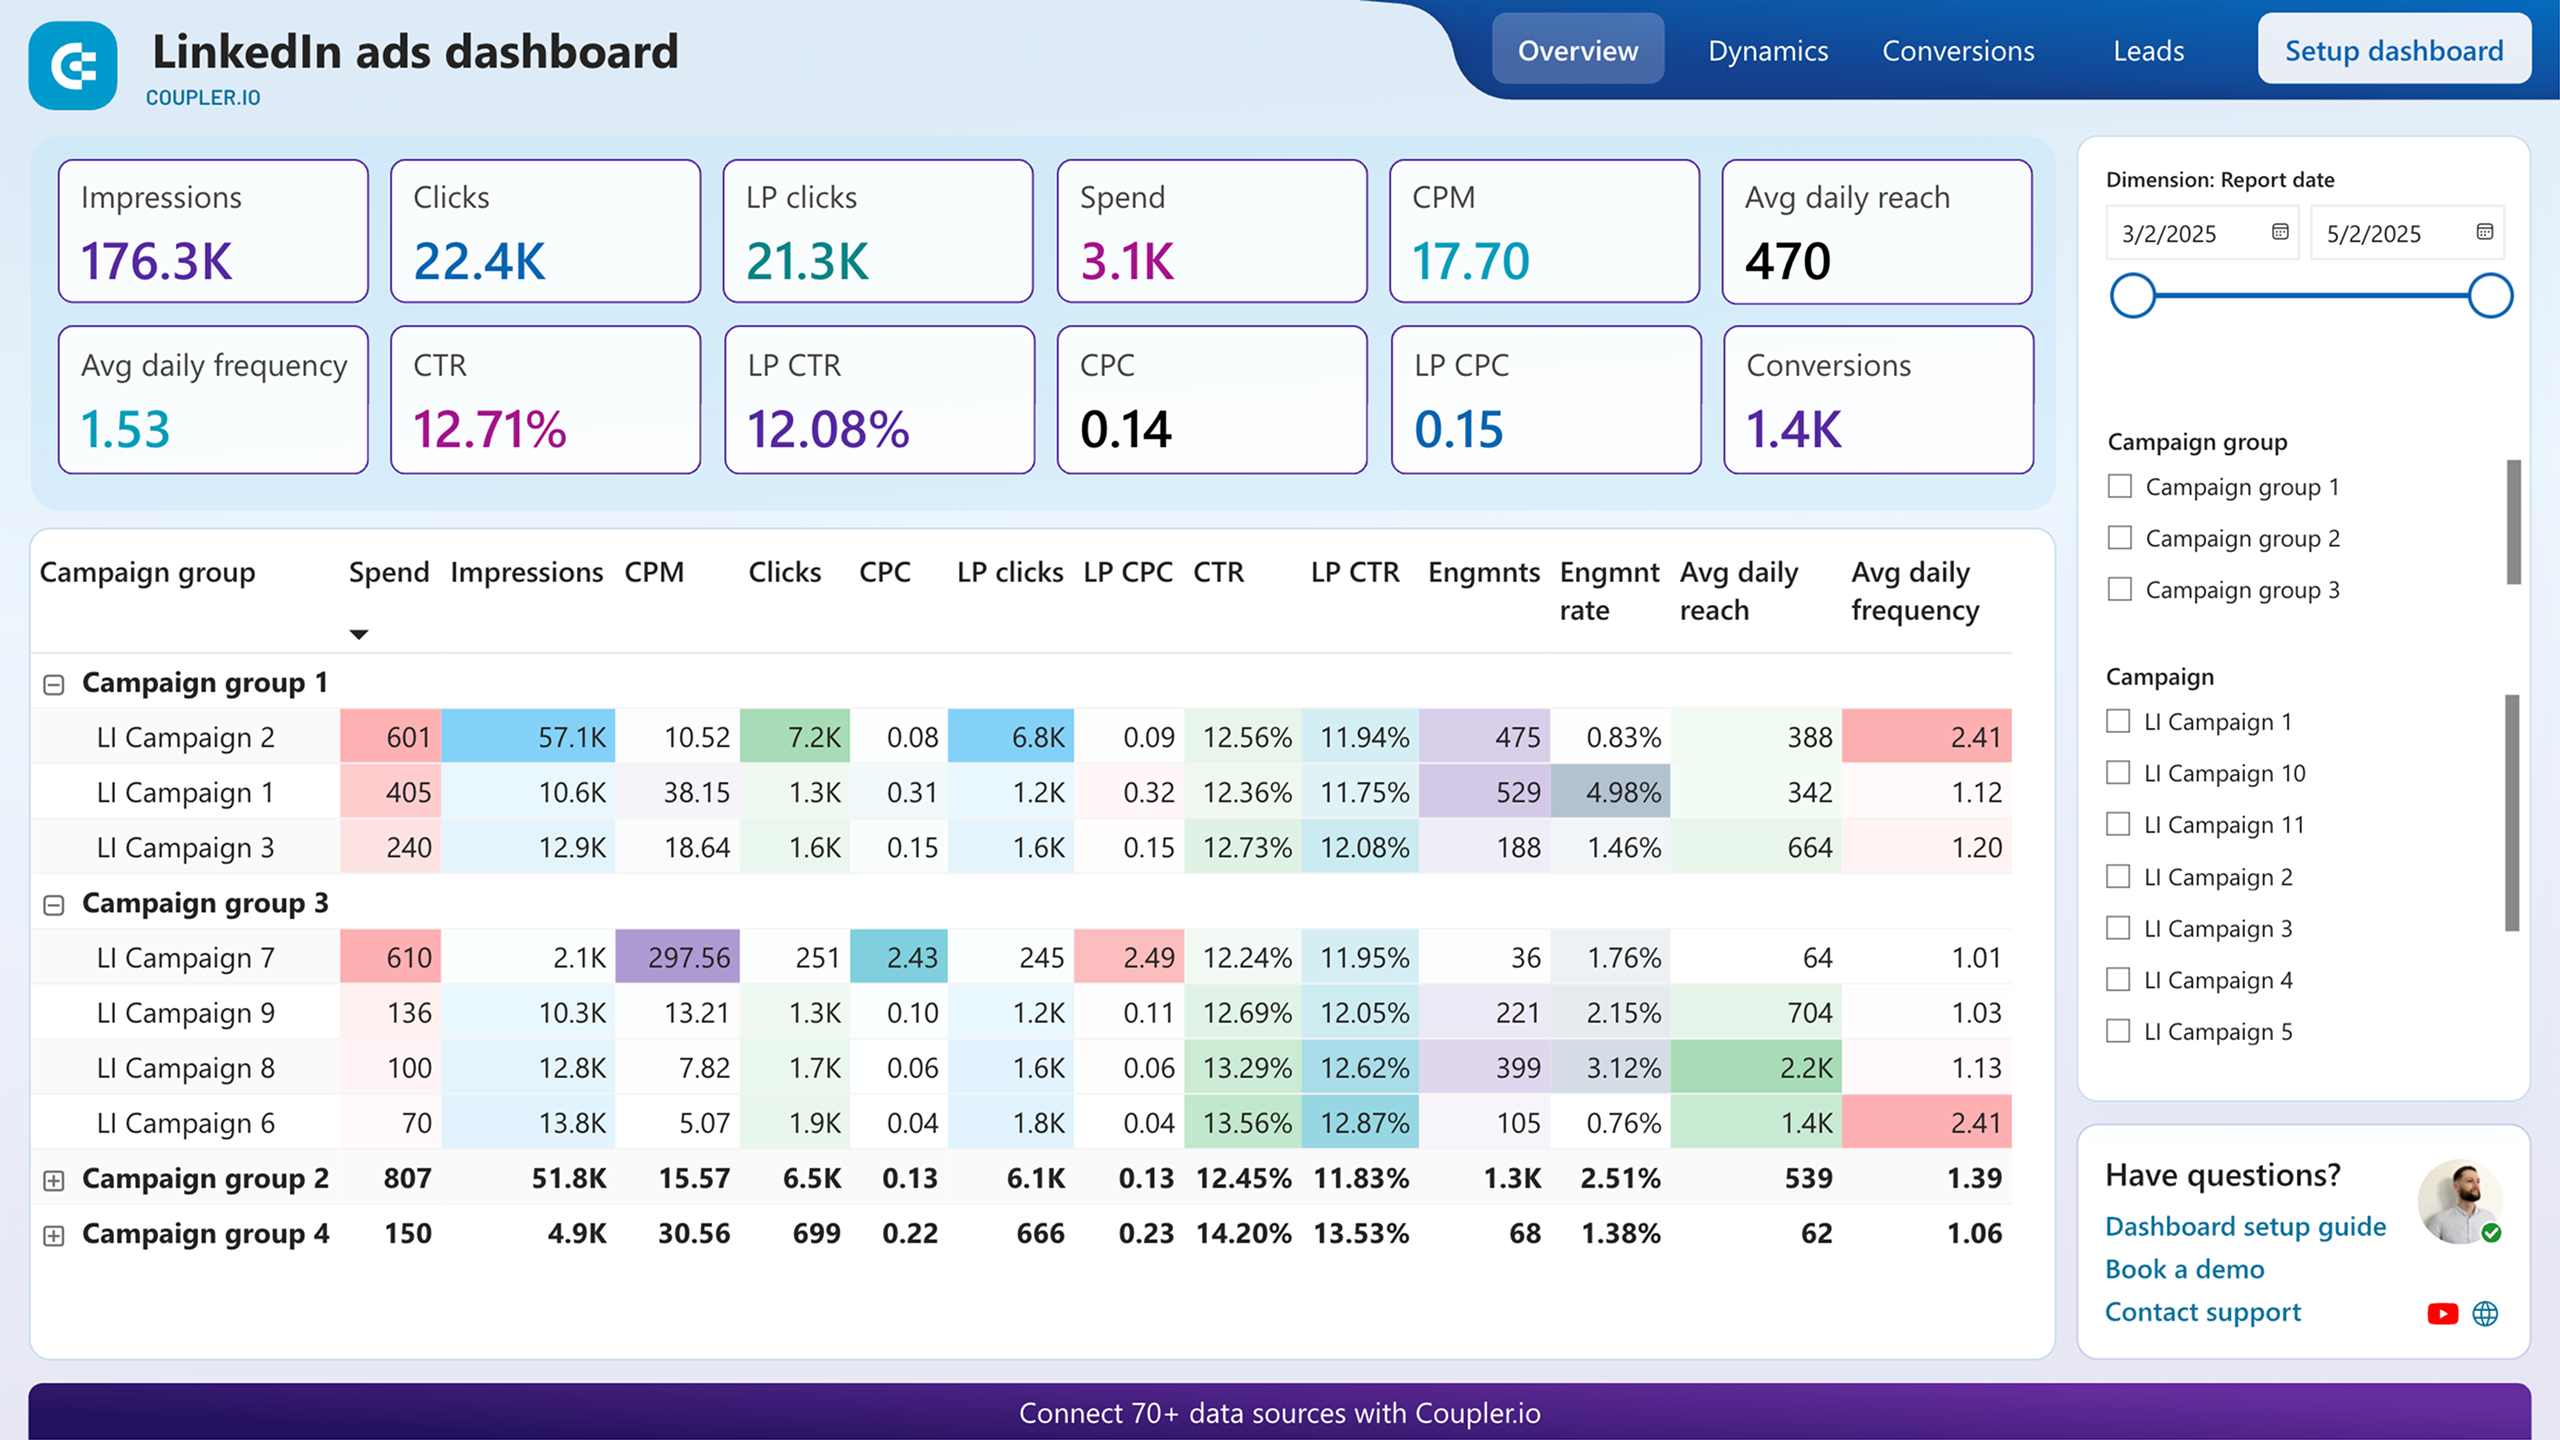
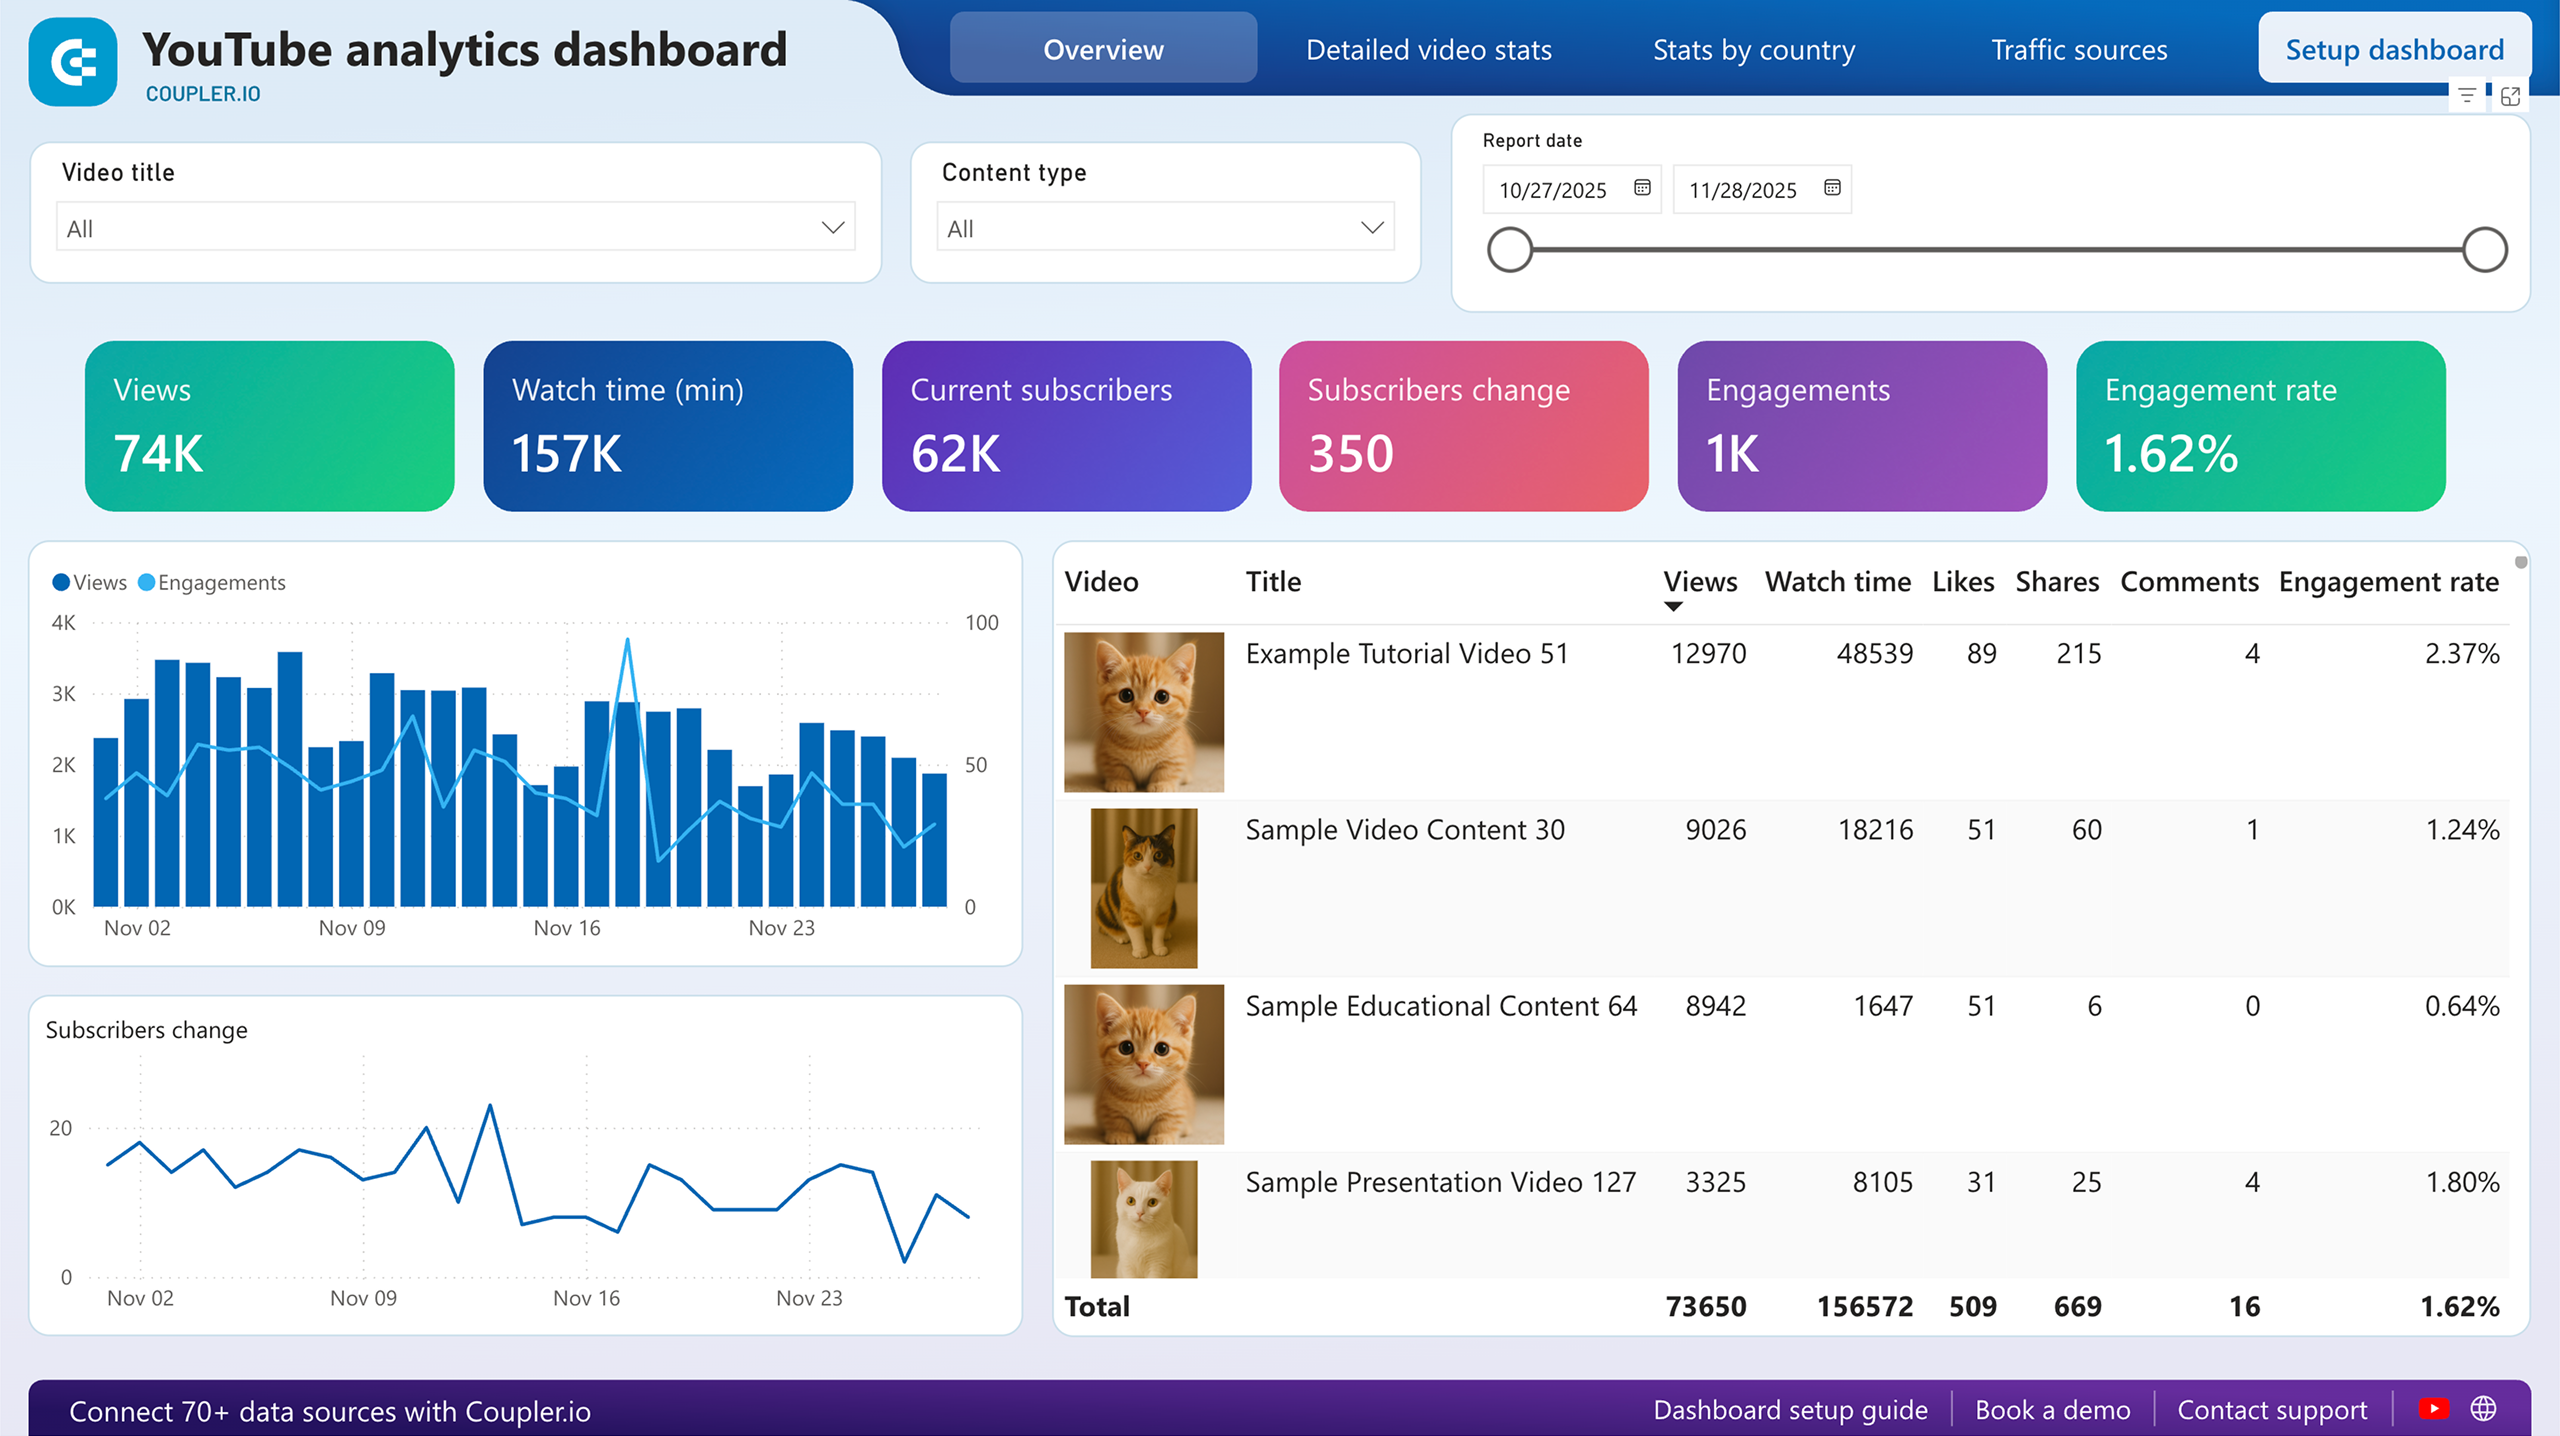
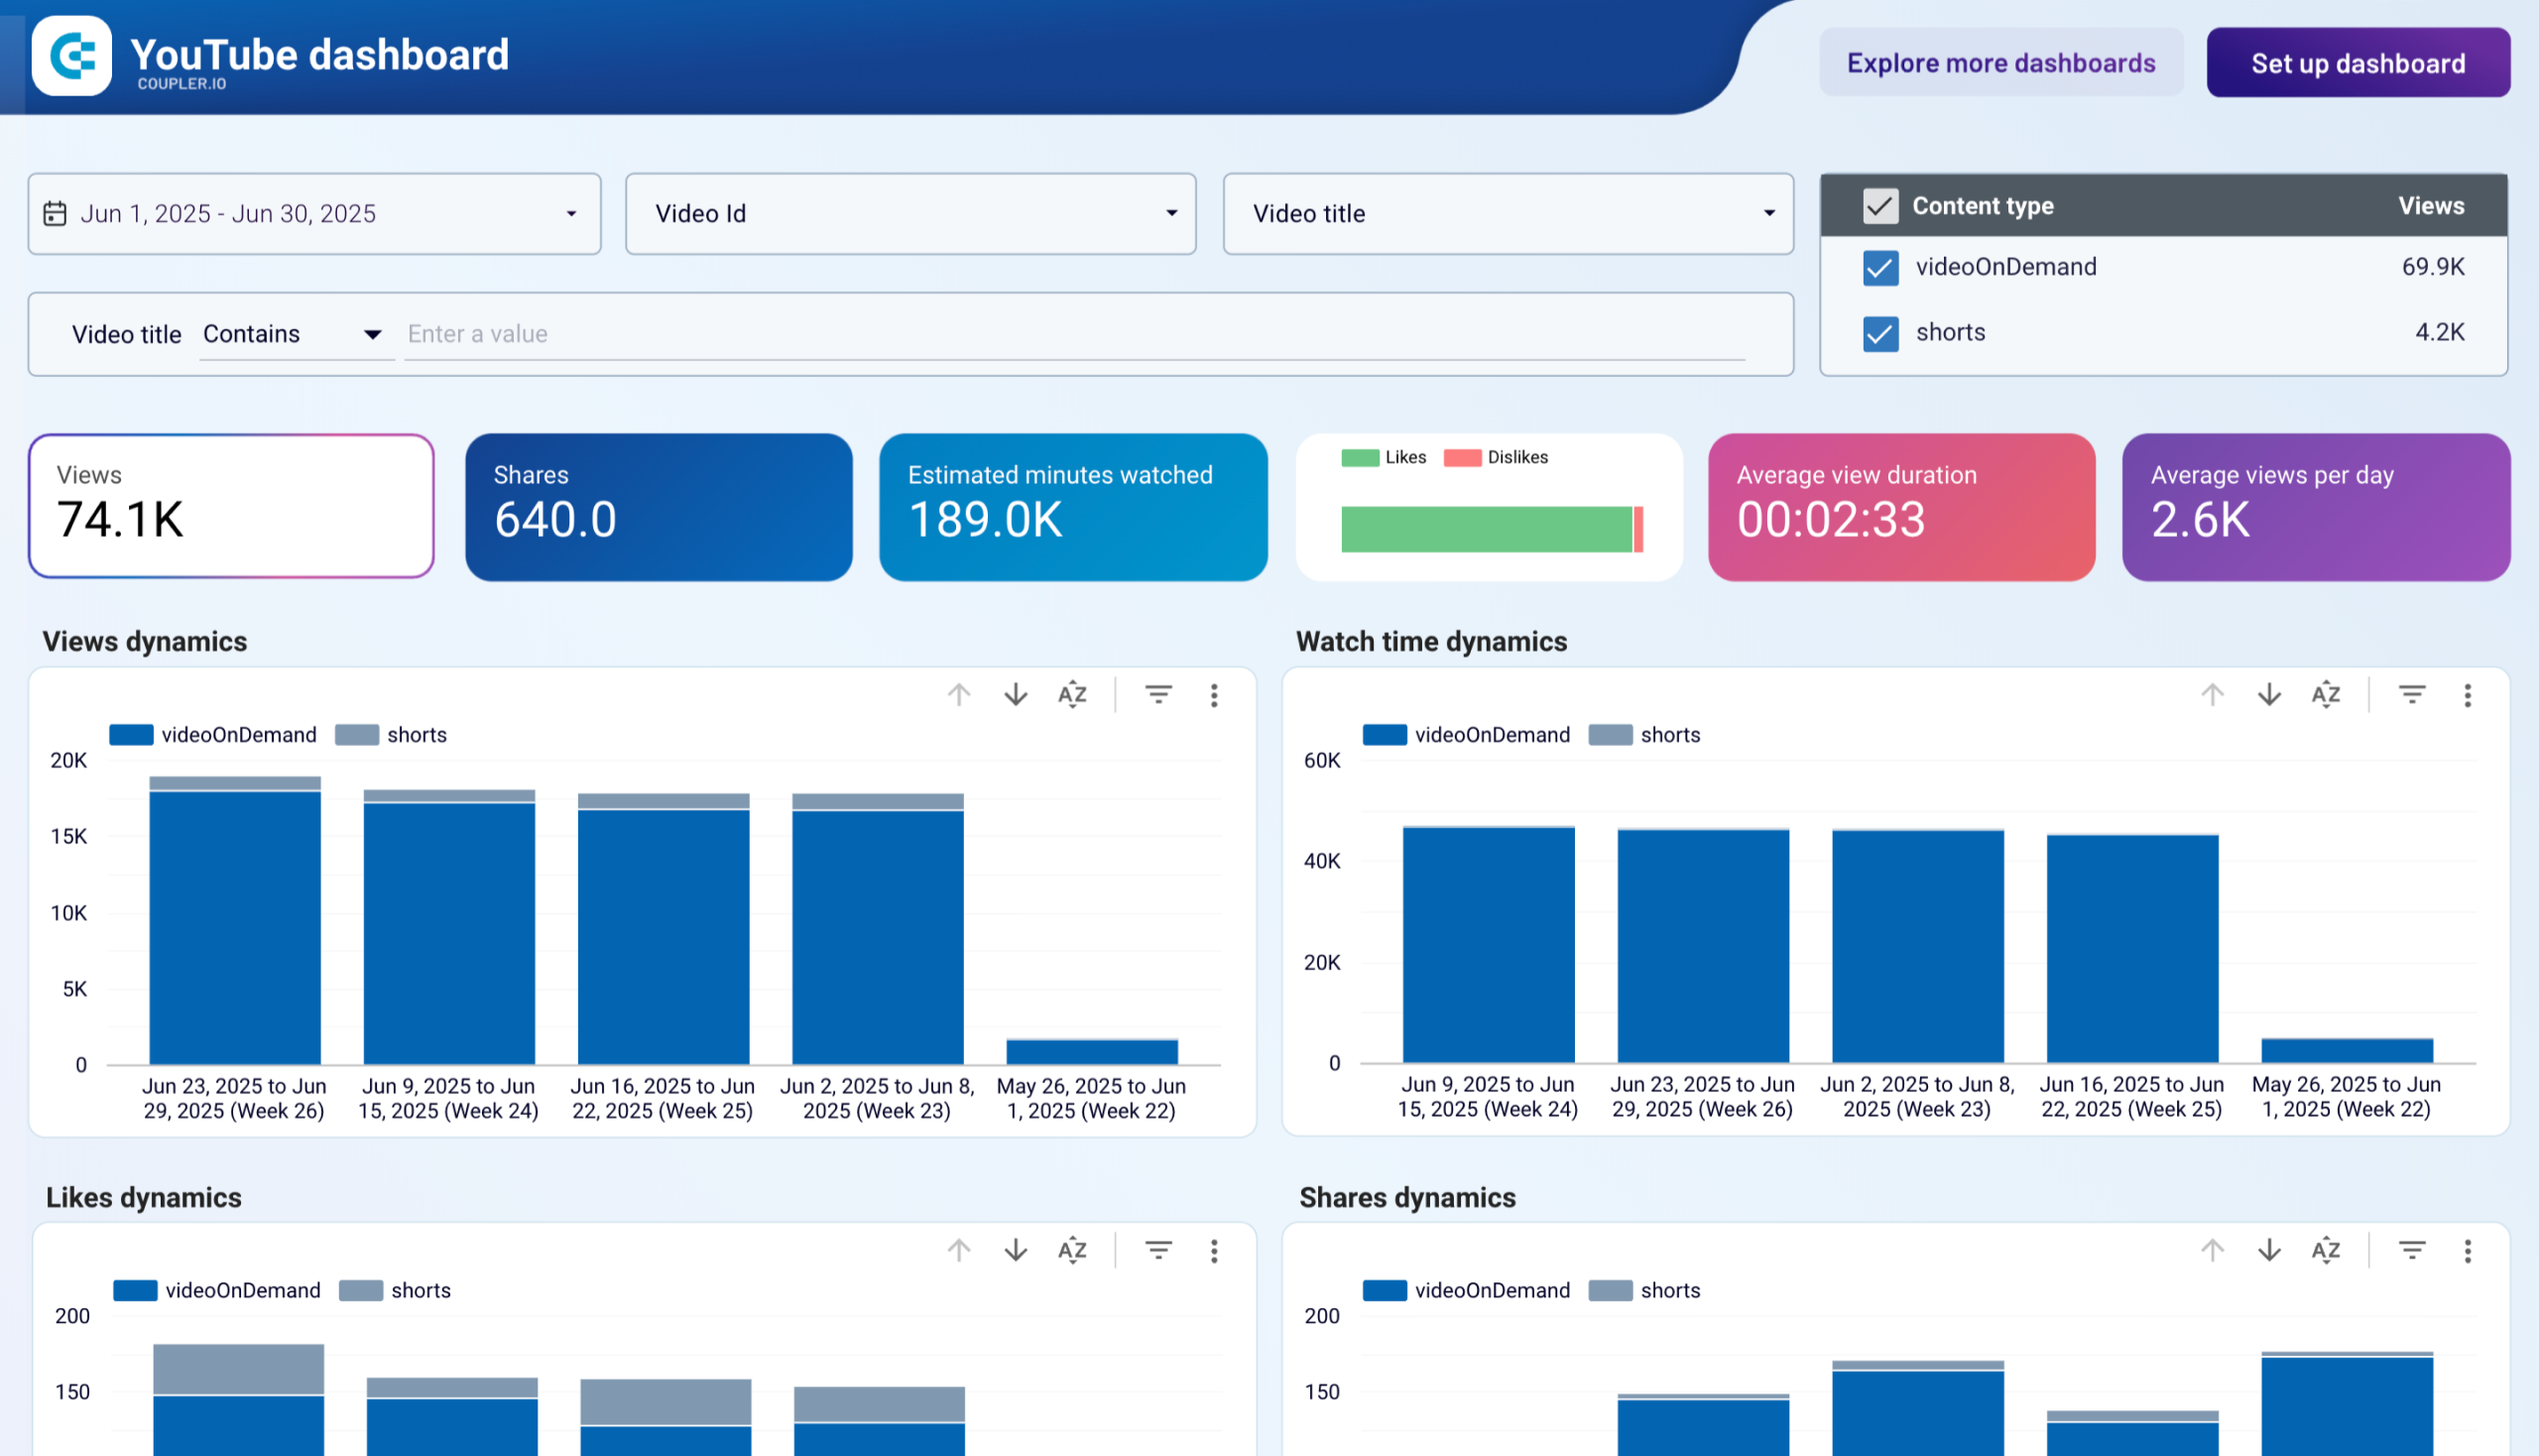
Use Coupler.io dashboards templates
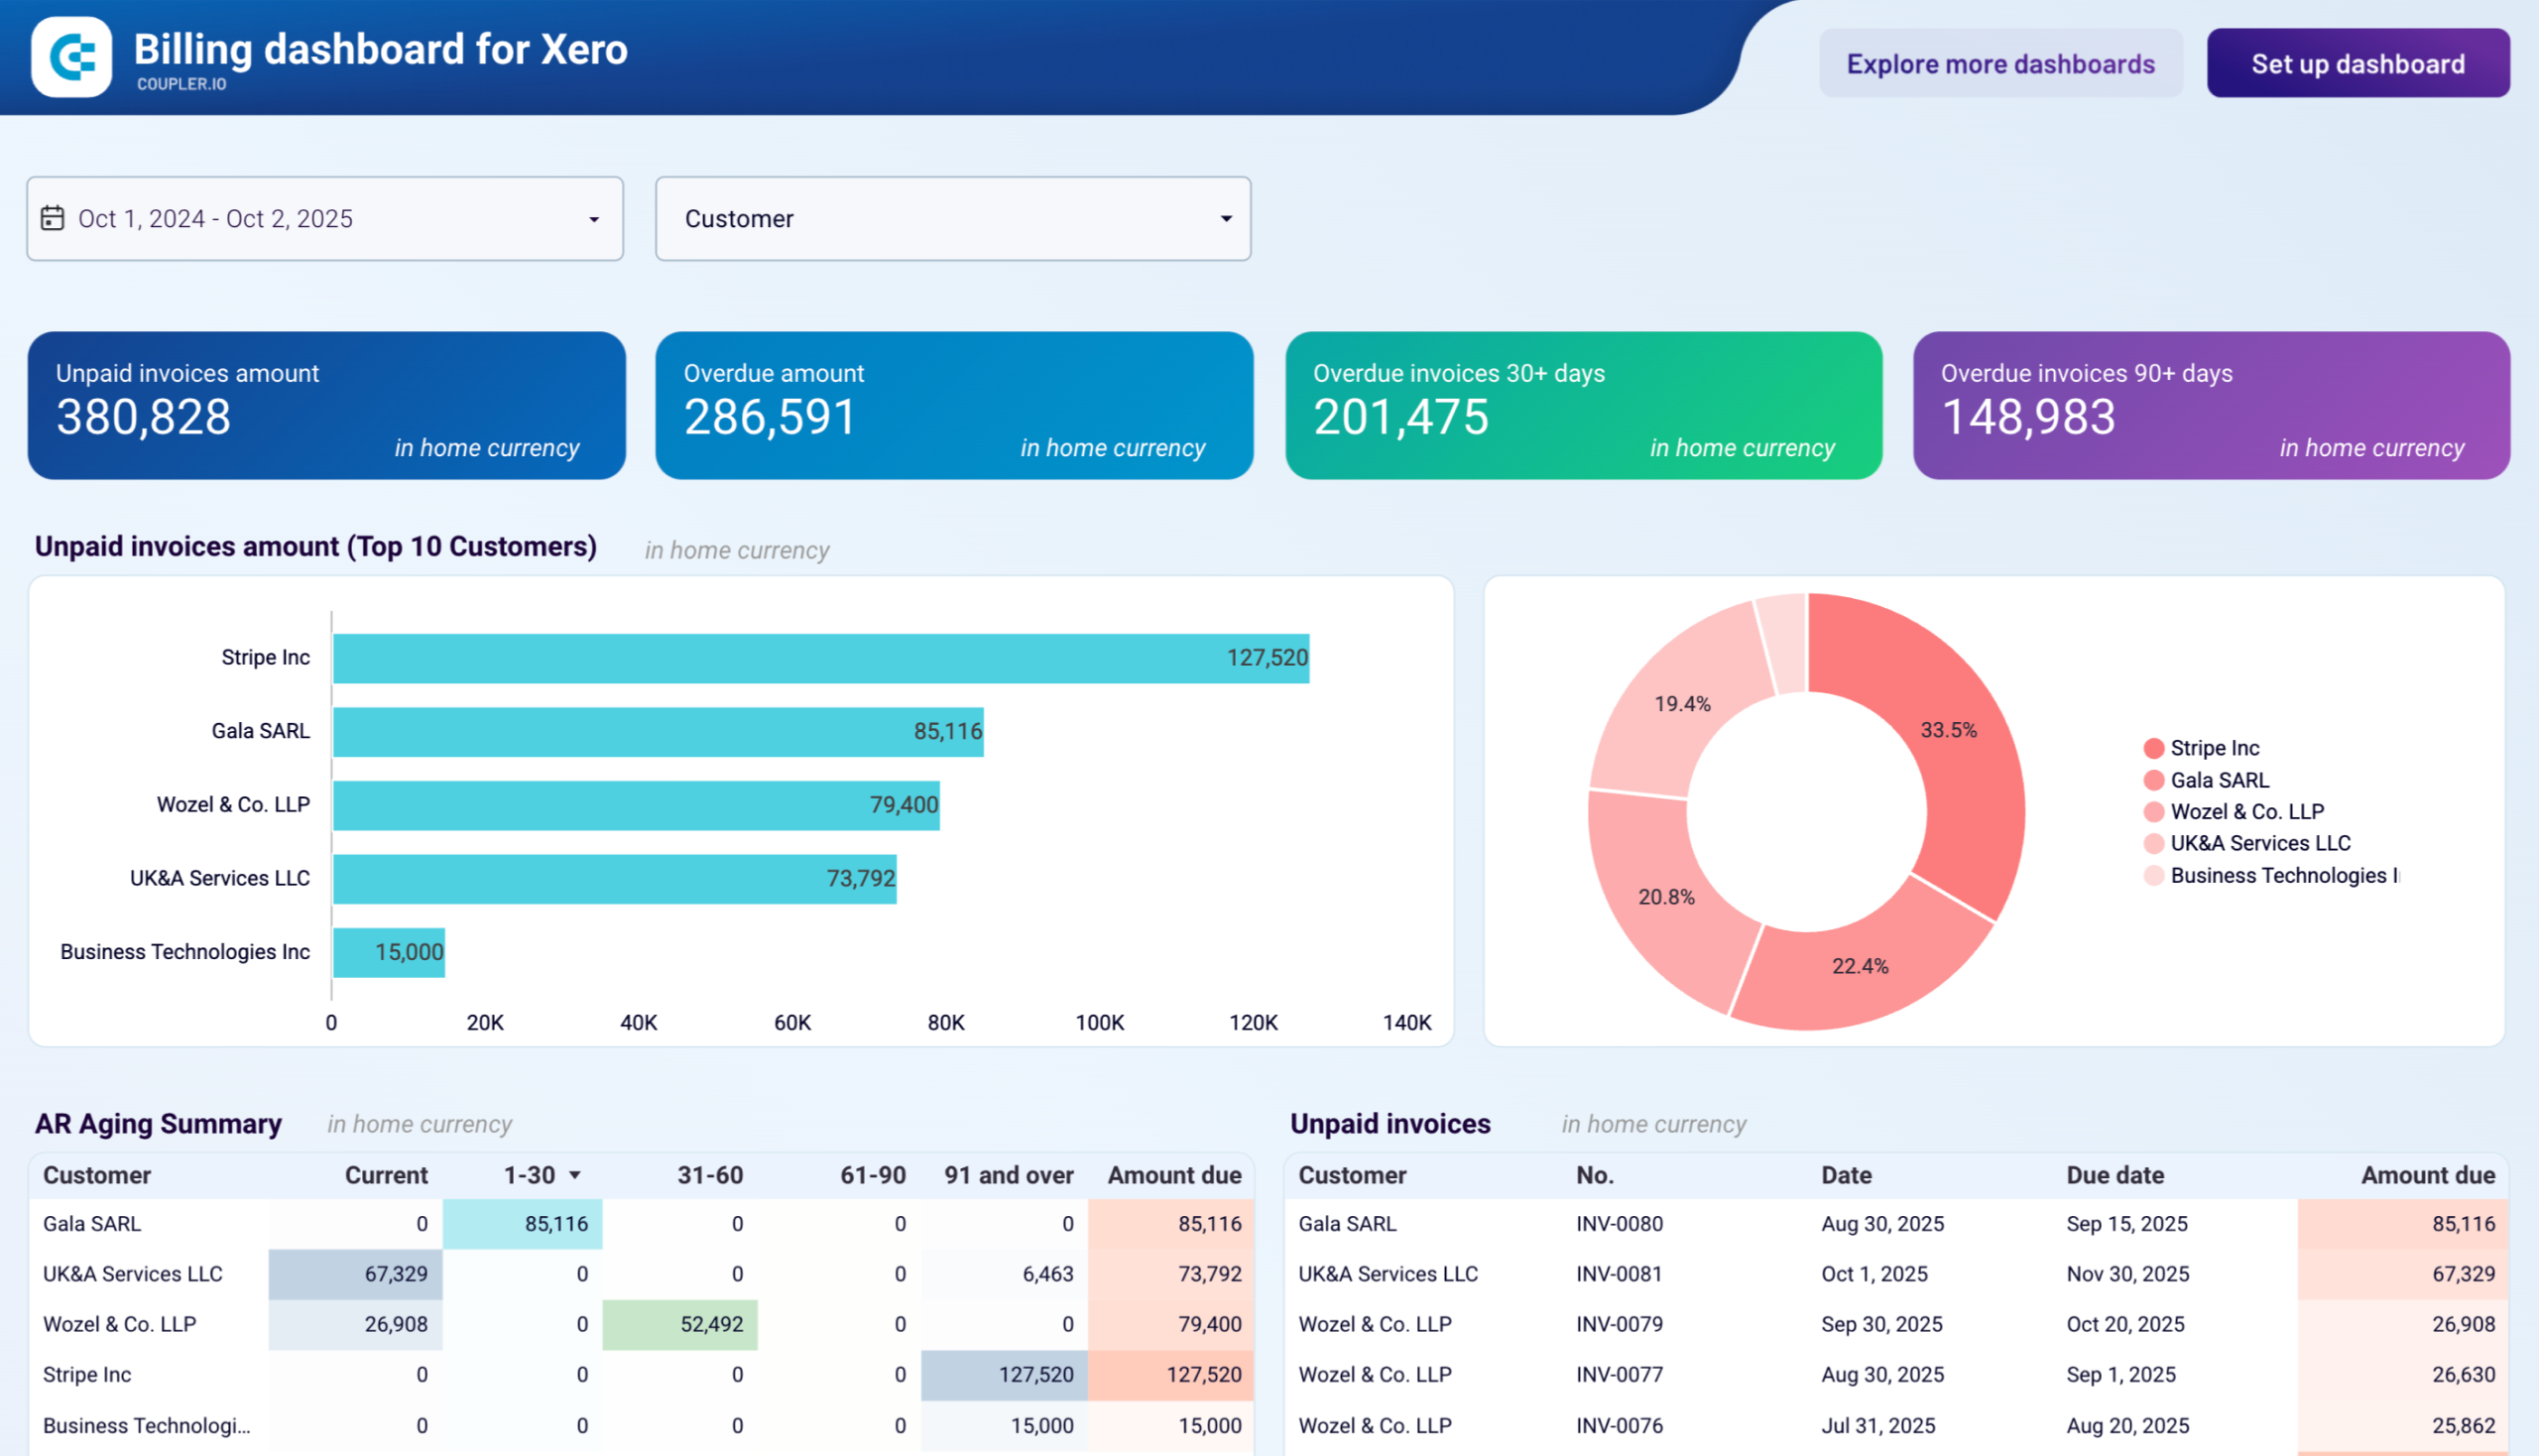
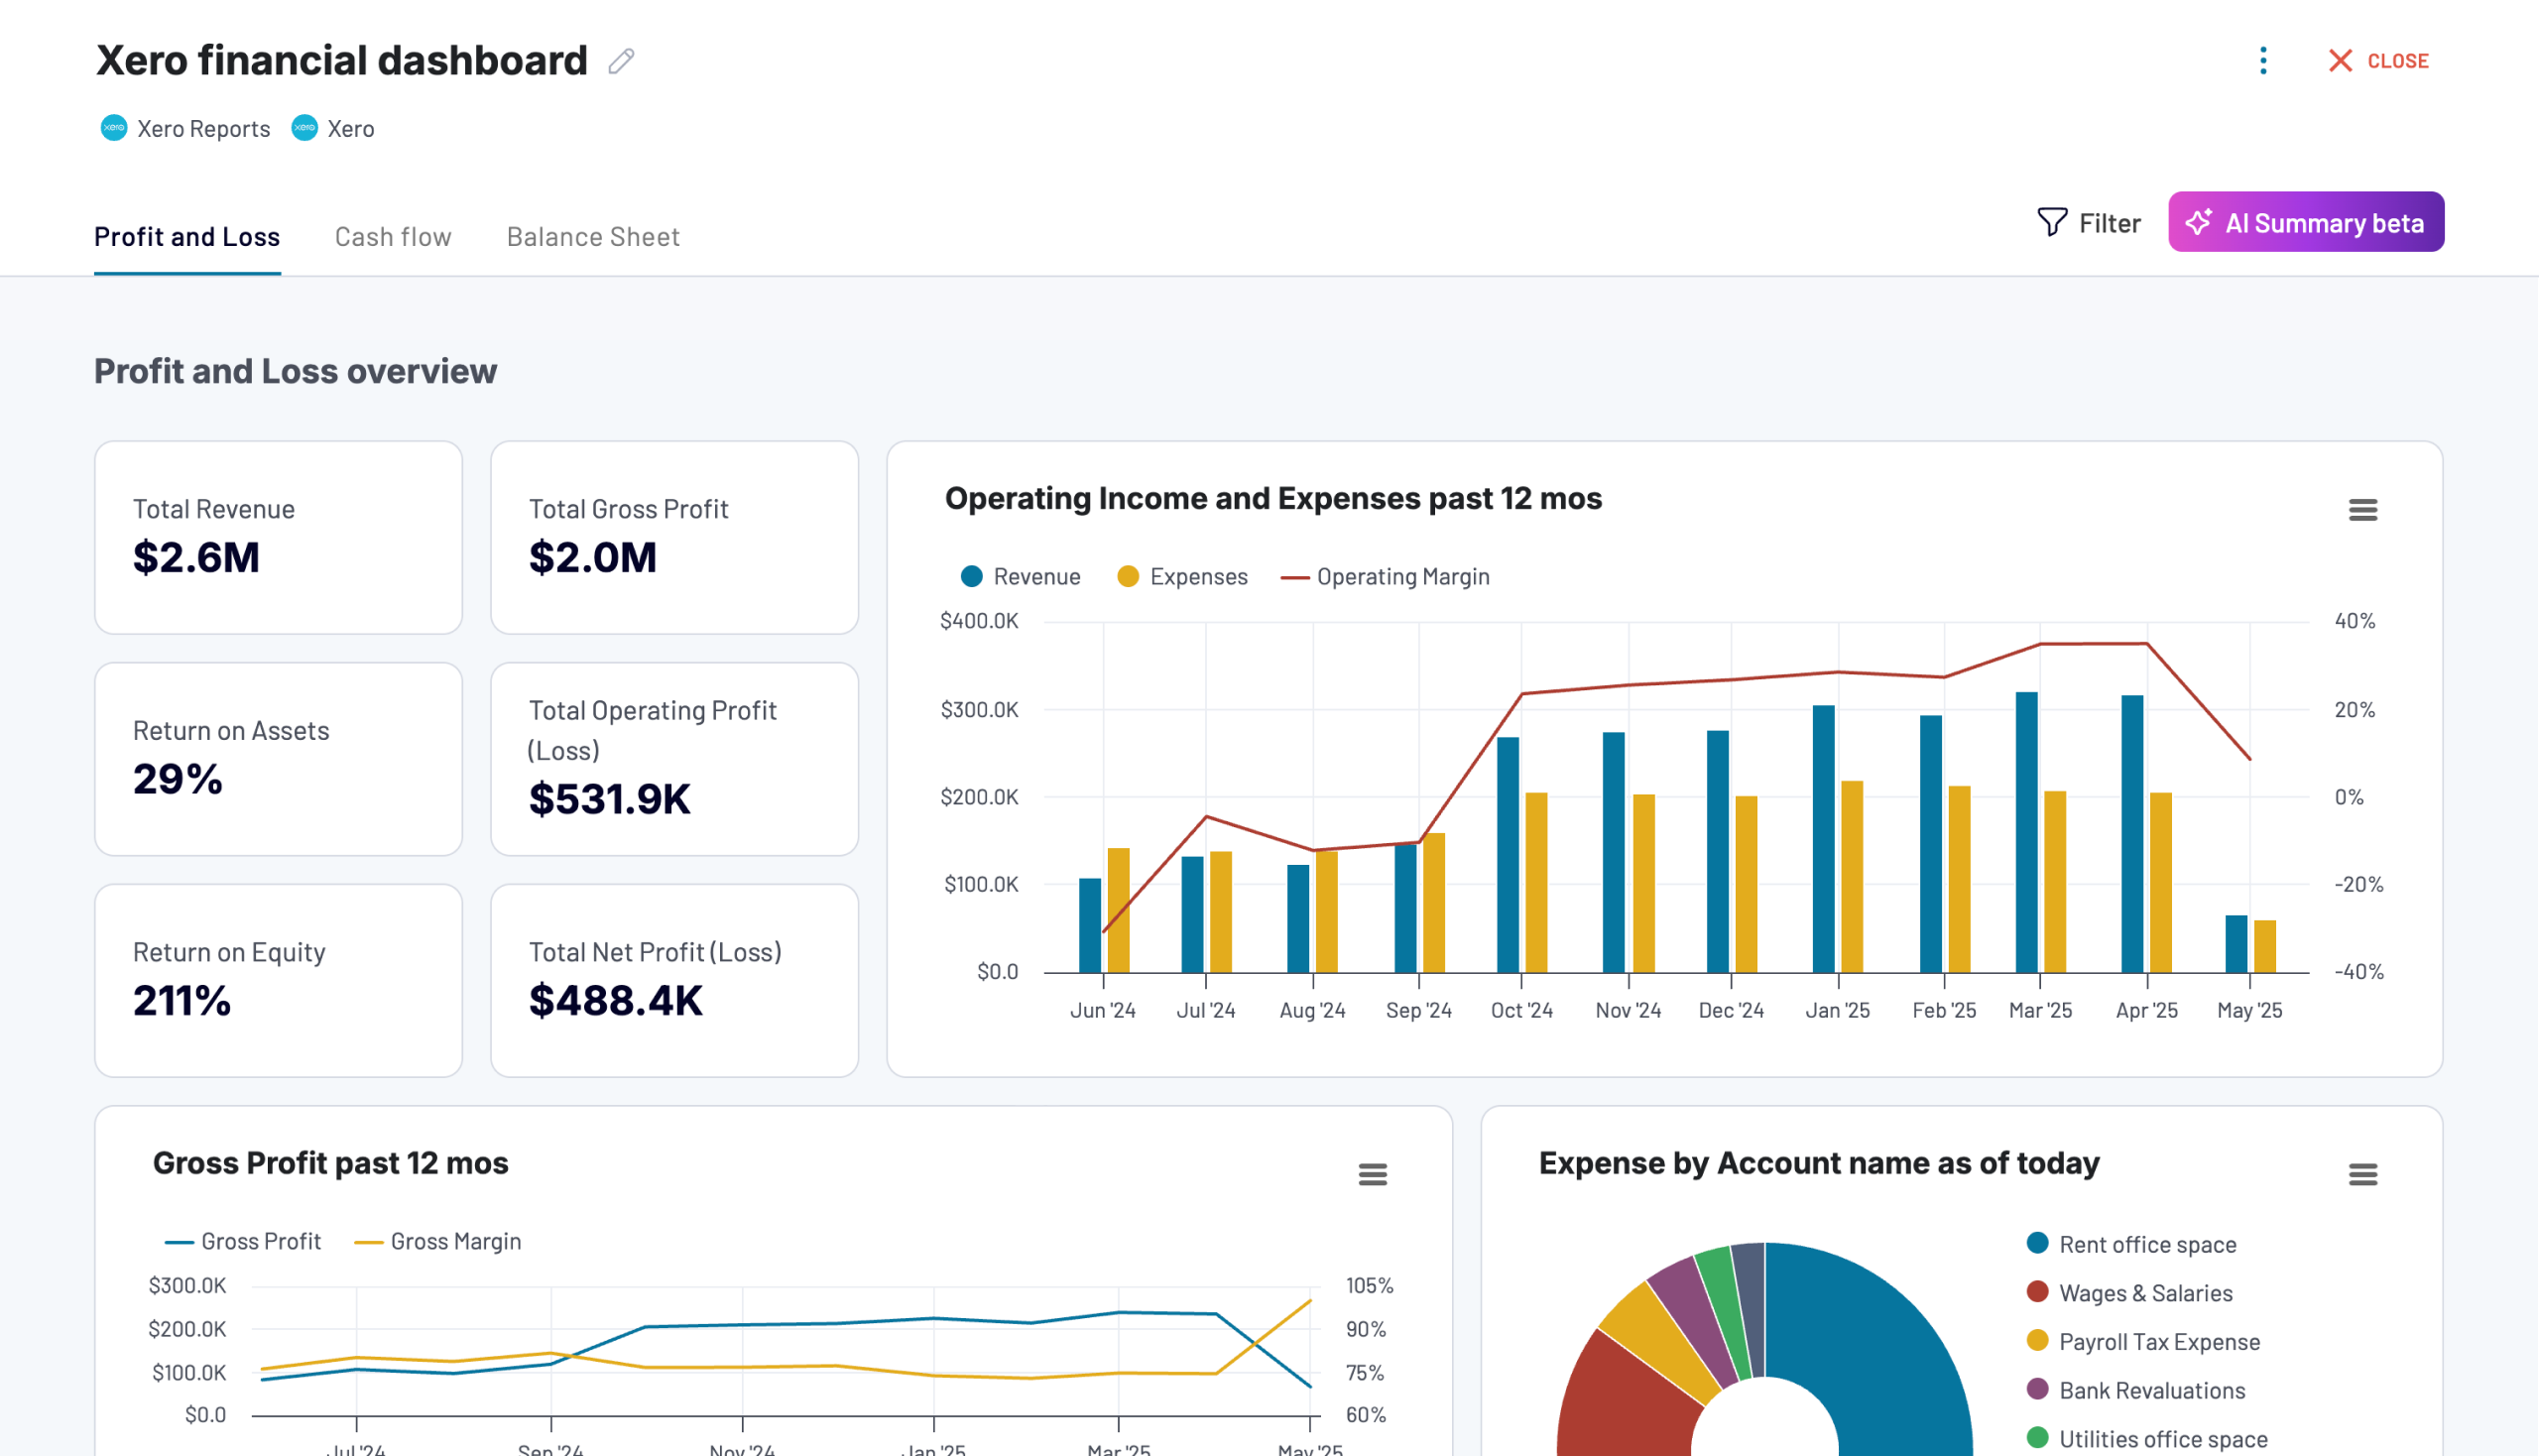
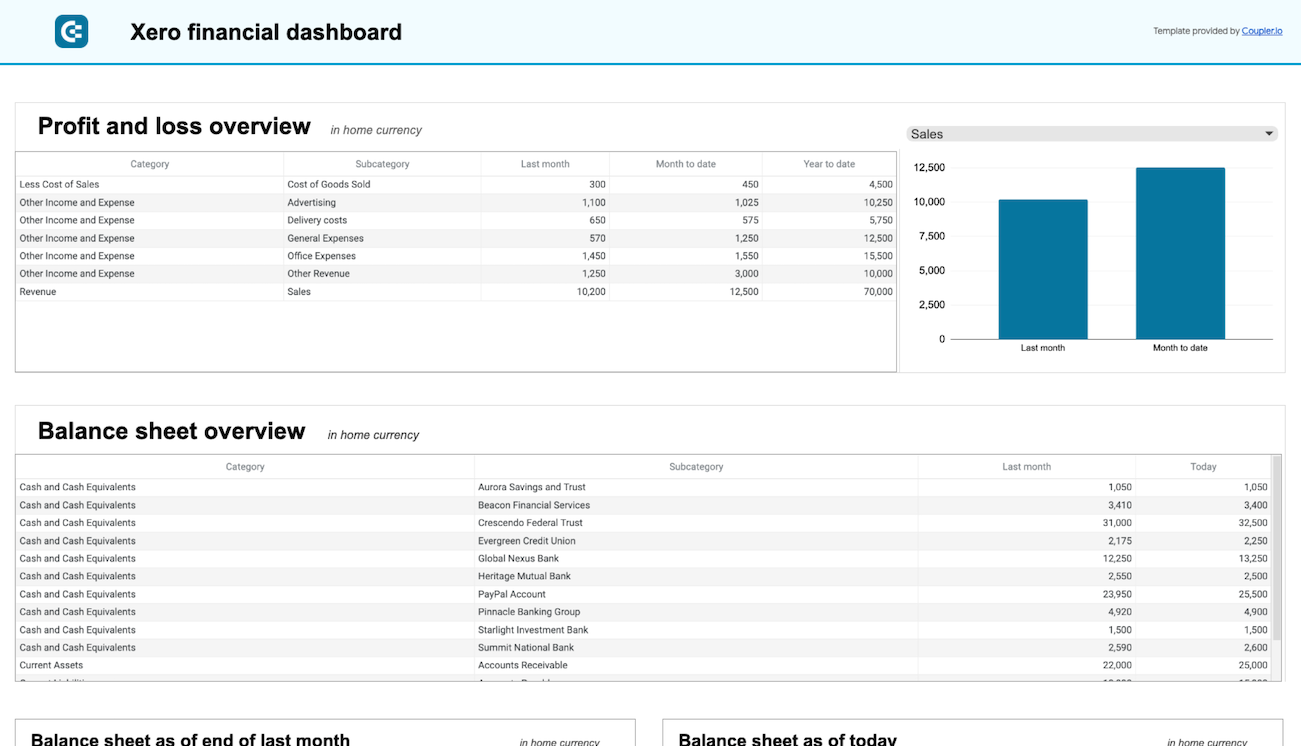
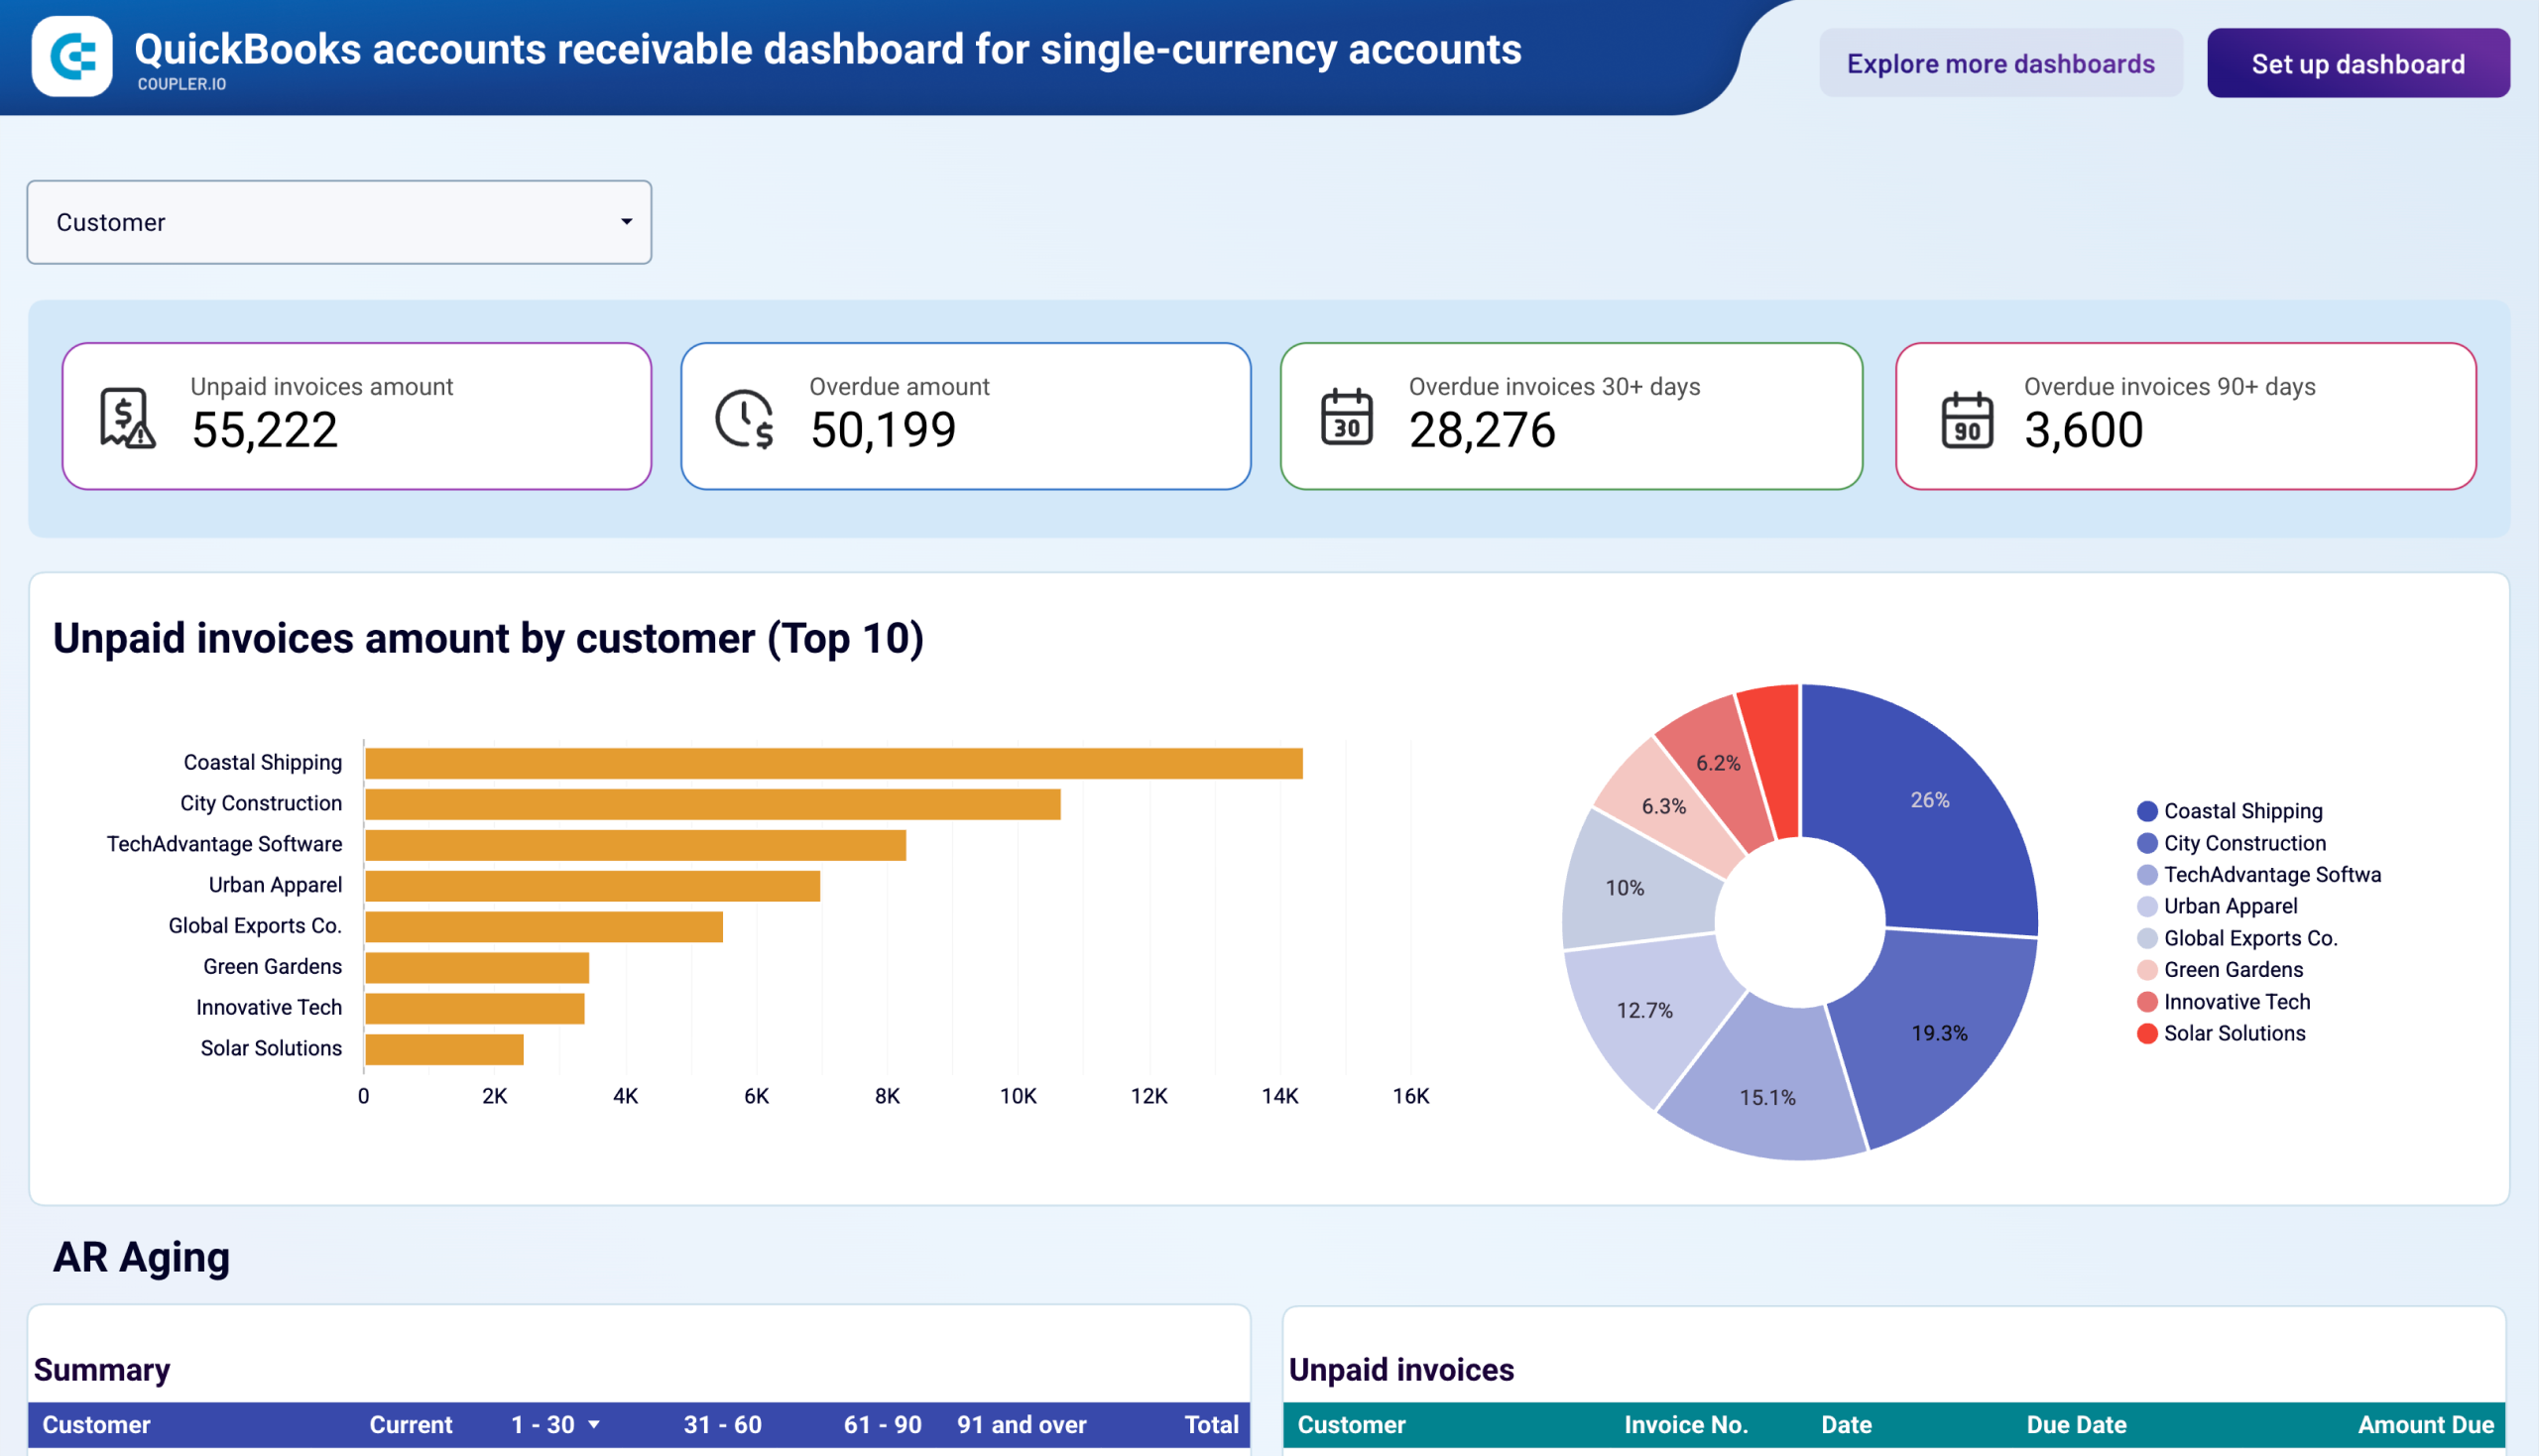
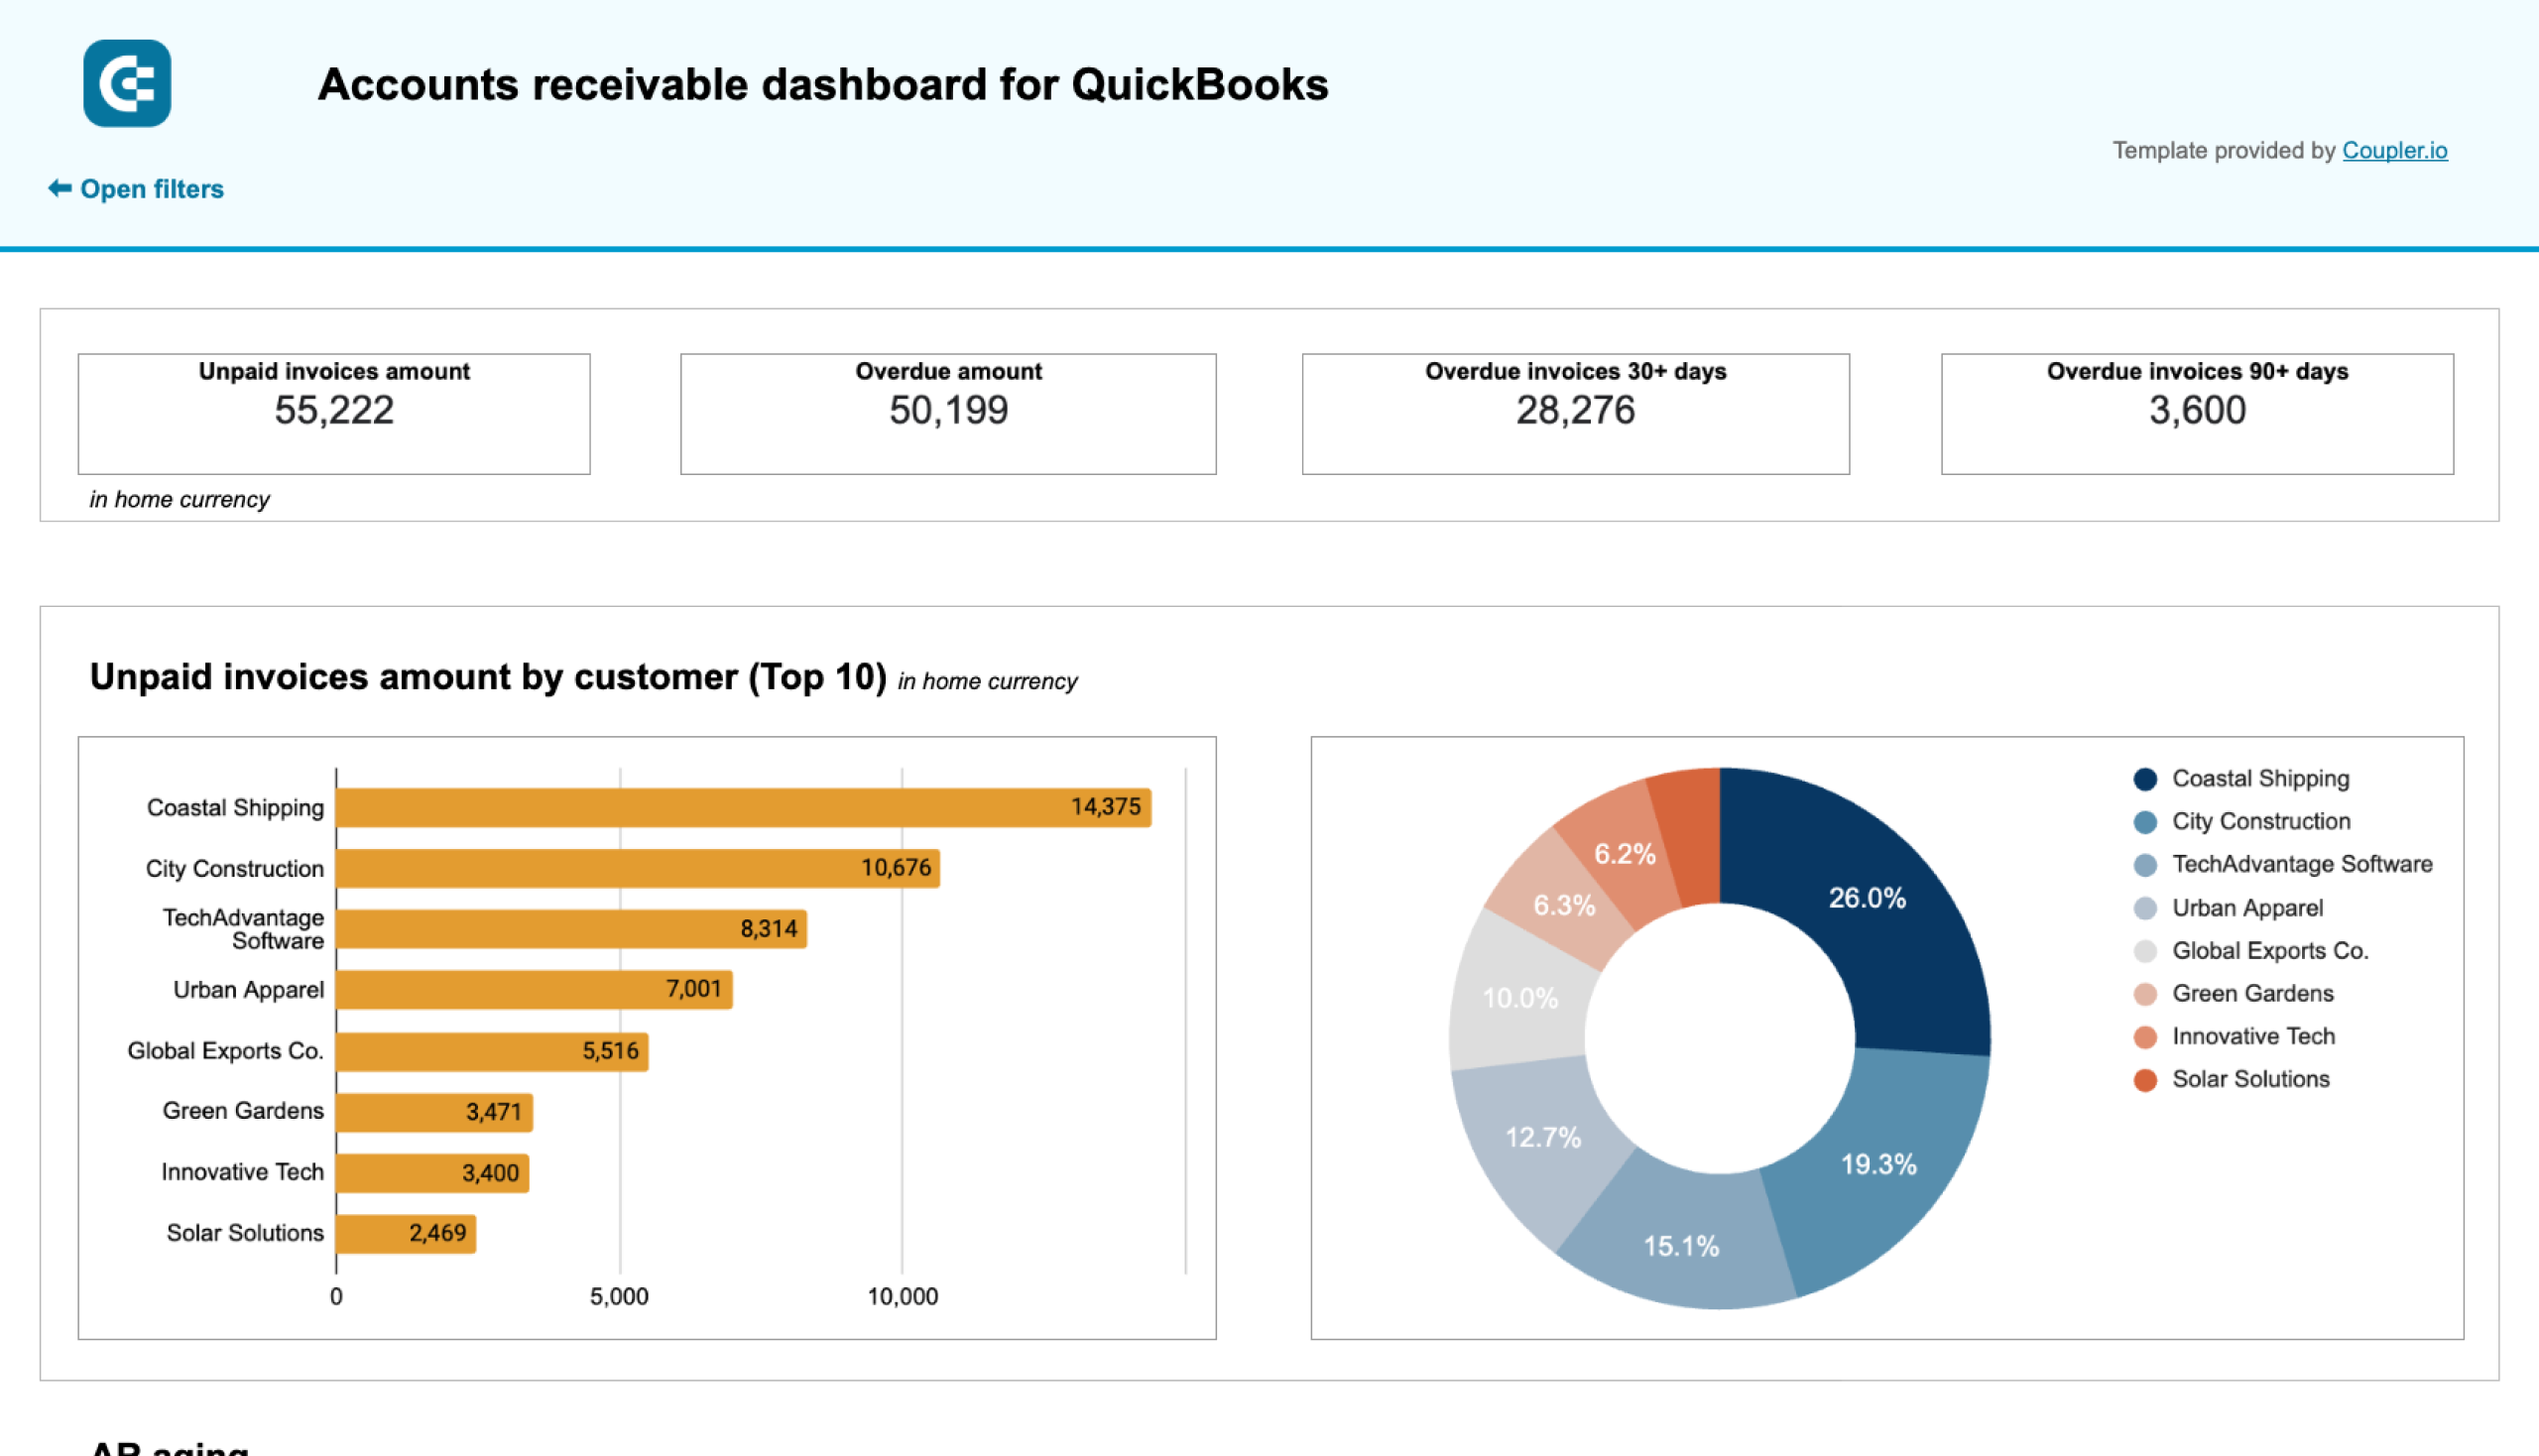
Coupler.io offers a range of ready-to-use interactive dashboard templates designed to streamline your reporting and analytics. Explore our template gallery and connect your TikTok Ads to start using the plug-and-play dashboard right away.


 +3
+3


 +6
+6


 +5
+5
 +6
+6

 +3
+3


 +1
+1


 +4
+4
 +4
+4
 +2
+2
 +2
+2


 +5
+5
 +4
+4
 +5
+5
 +5
+5


 +3
+3

 +1
+1
 +3
+3


 +1
+1
 +3
+3
 +3
+3


 +2
+2


 +1
+1


 +1
+1


 +2
+2

 +3
+3
 +4
+4


about your case. It doesn't cost you a penny 😉
Data set templates gallery
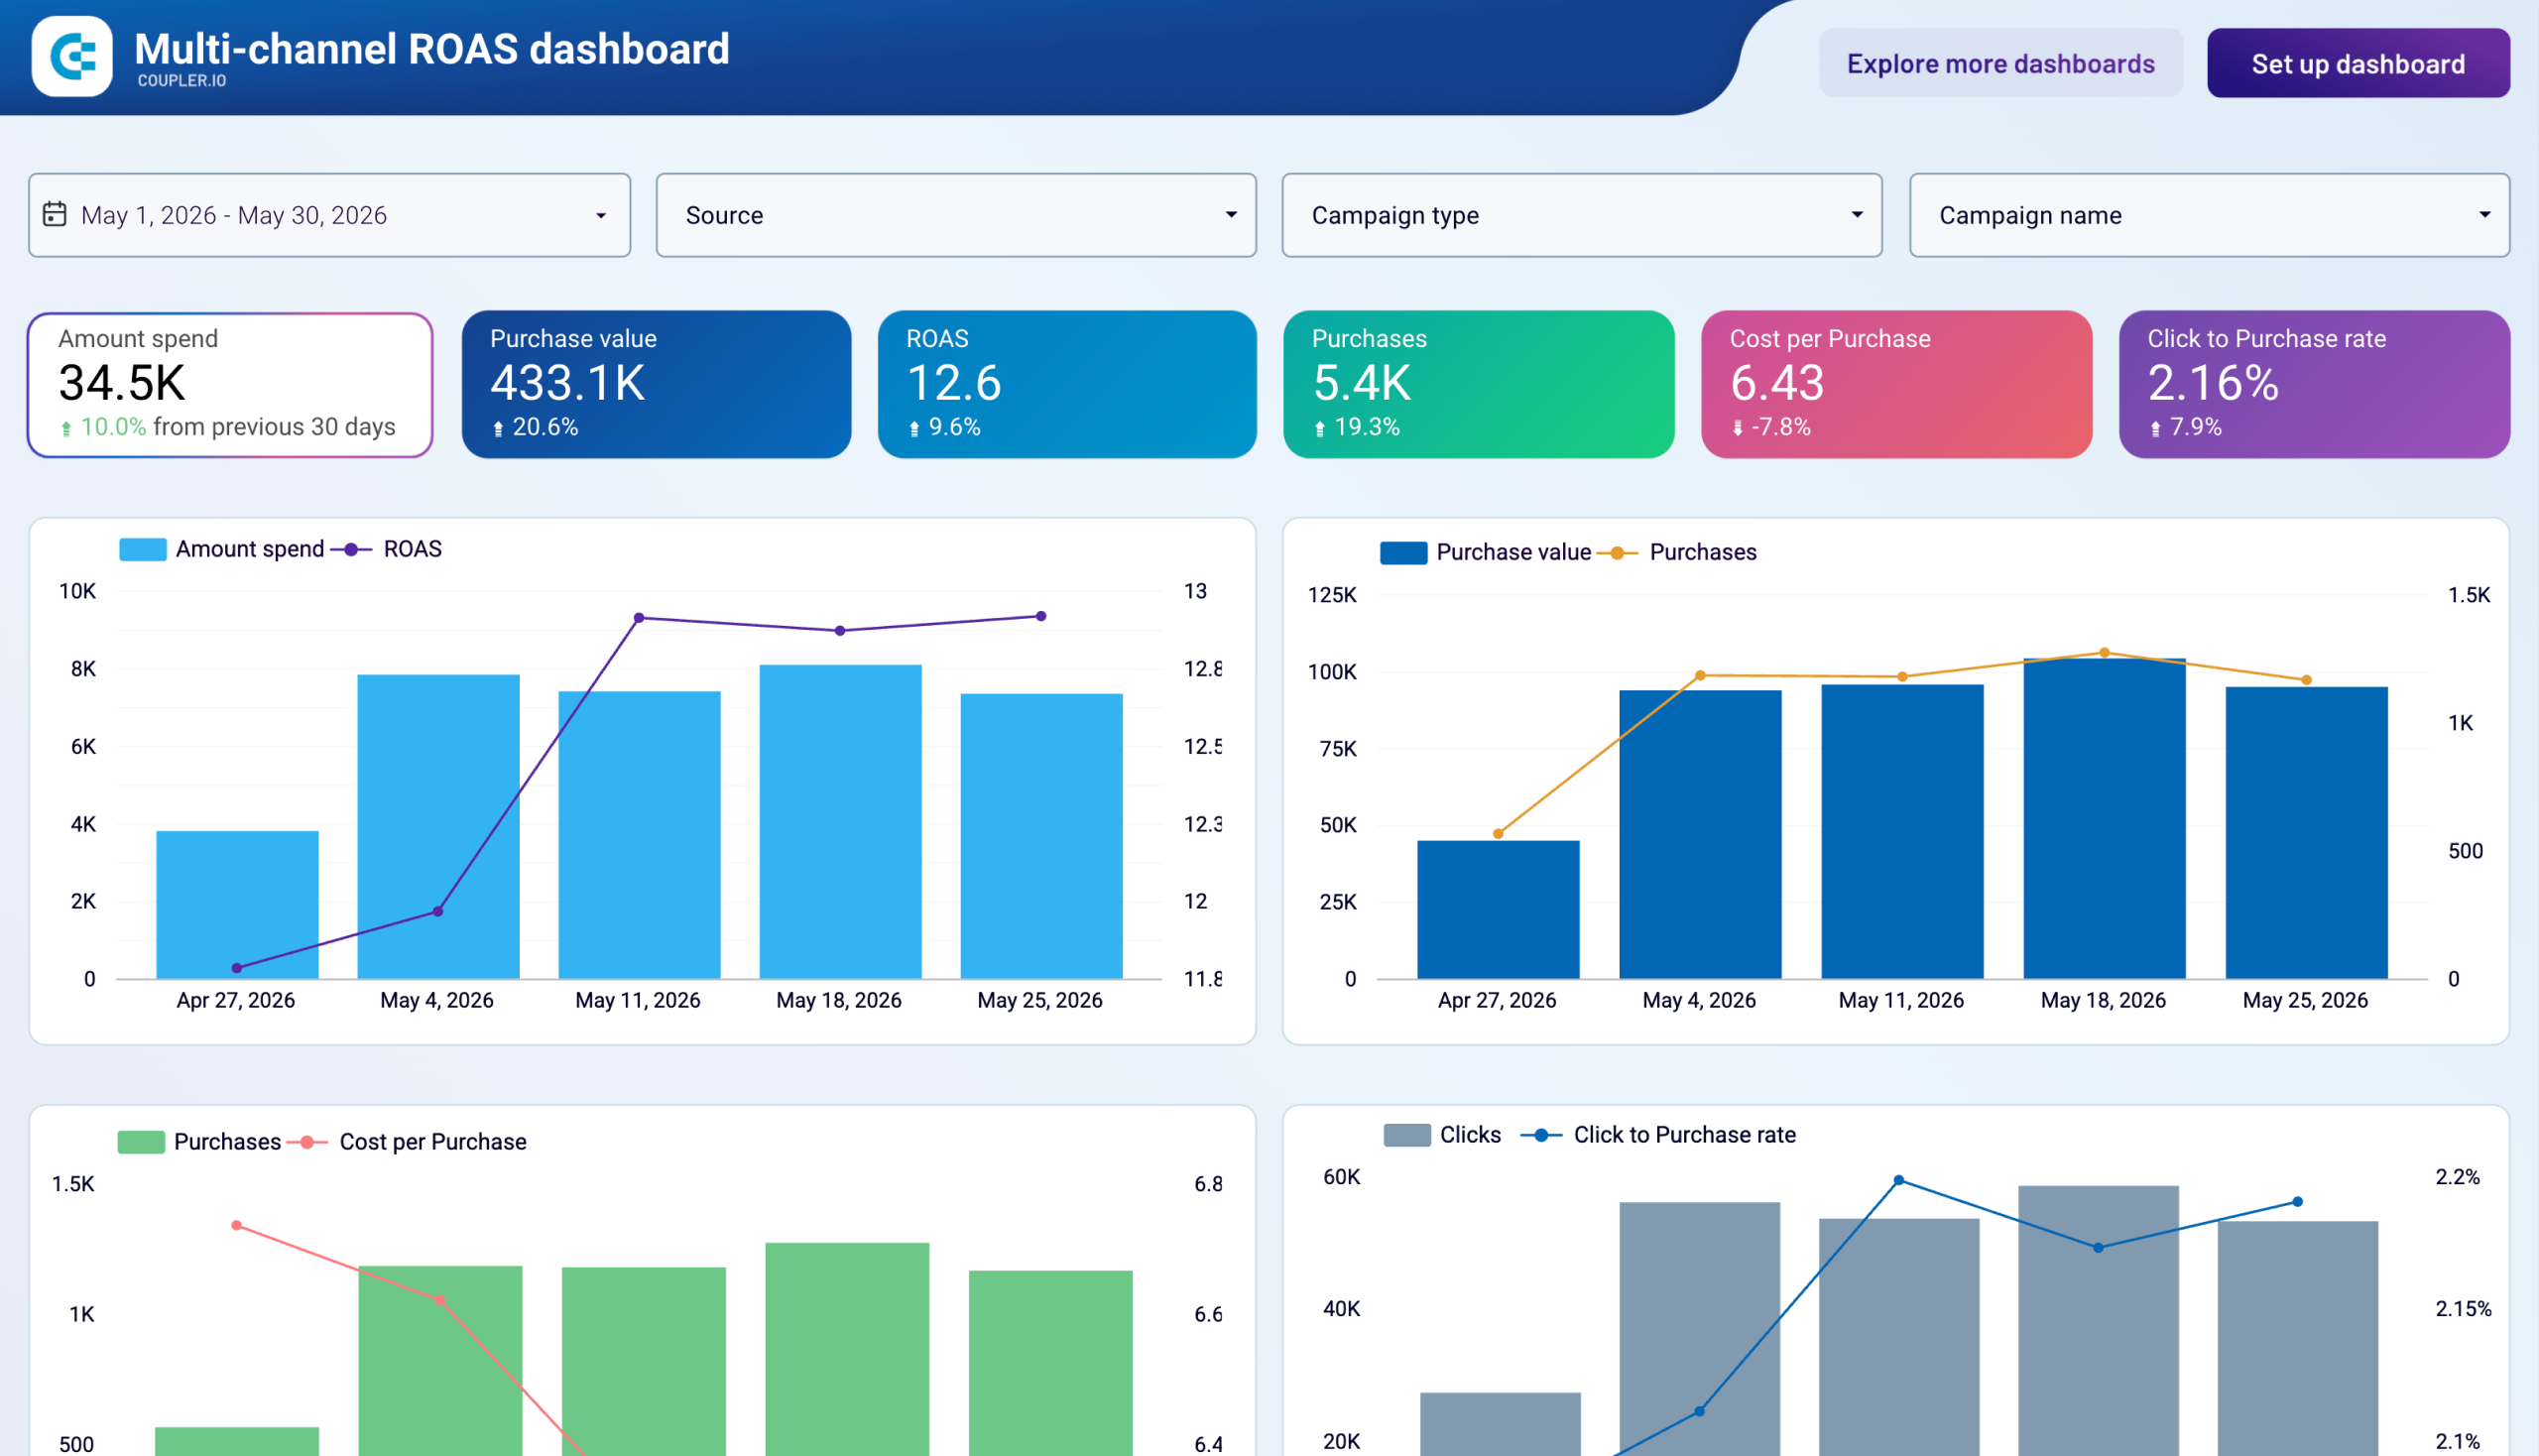
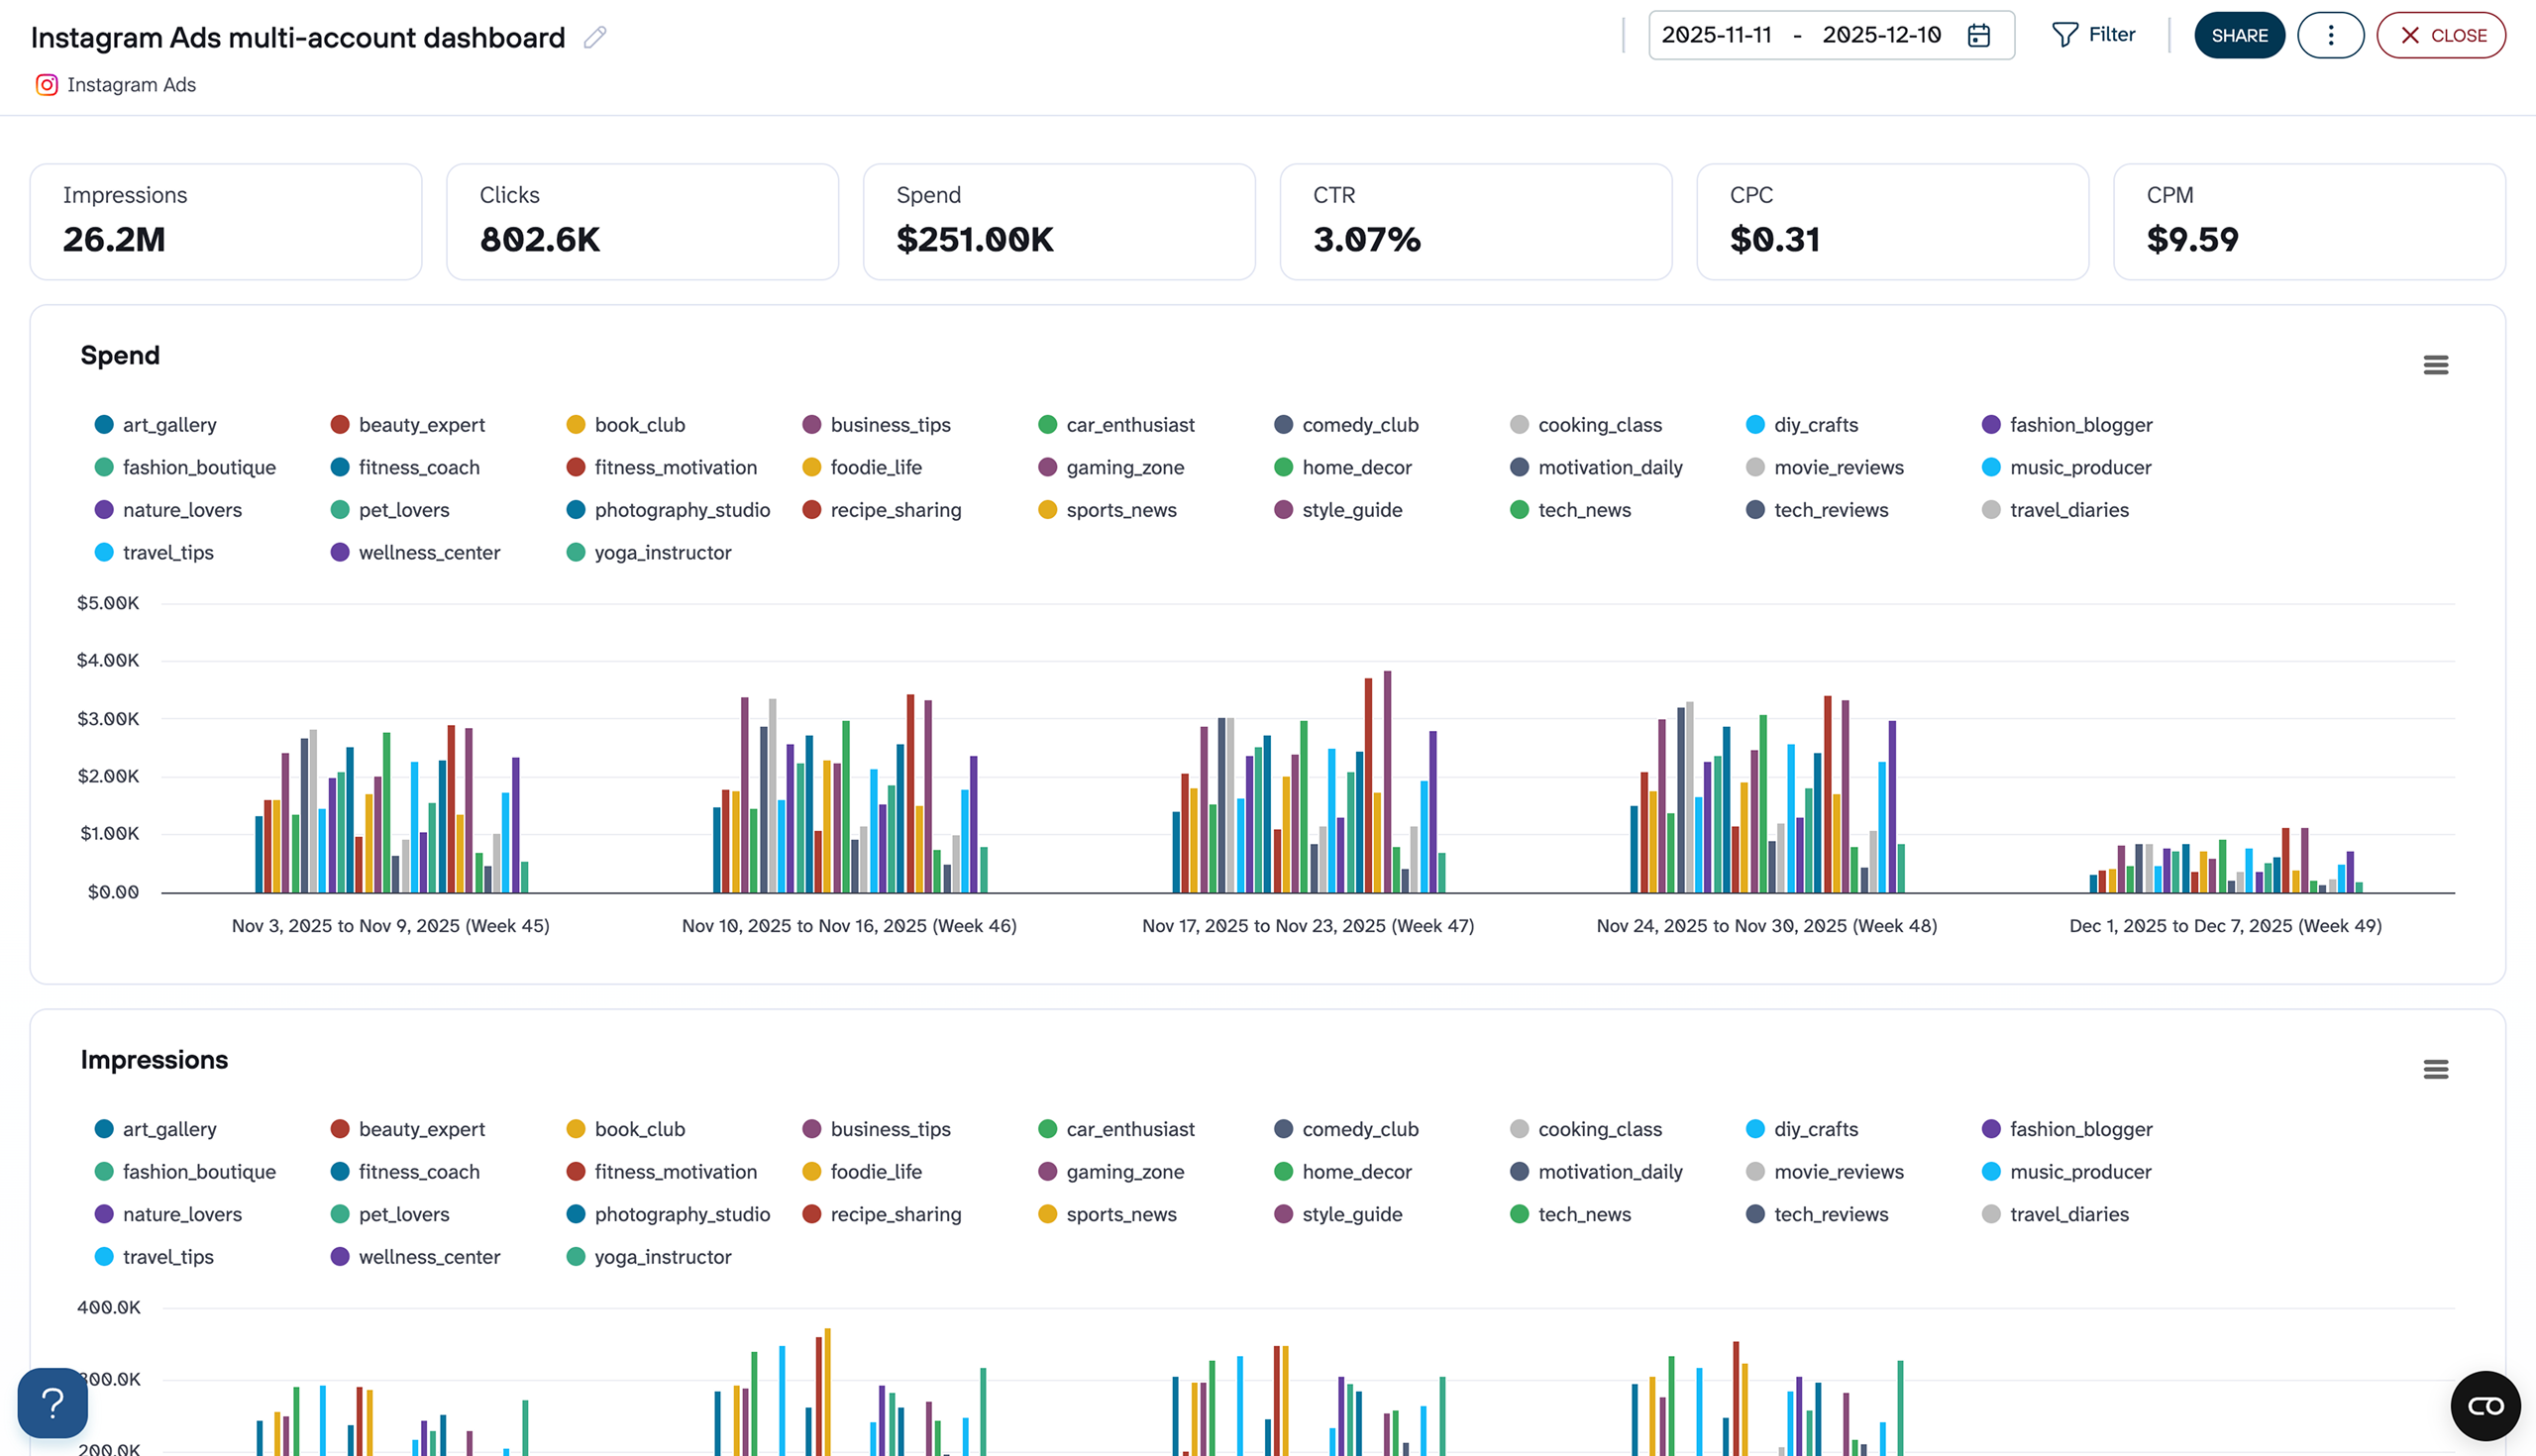
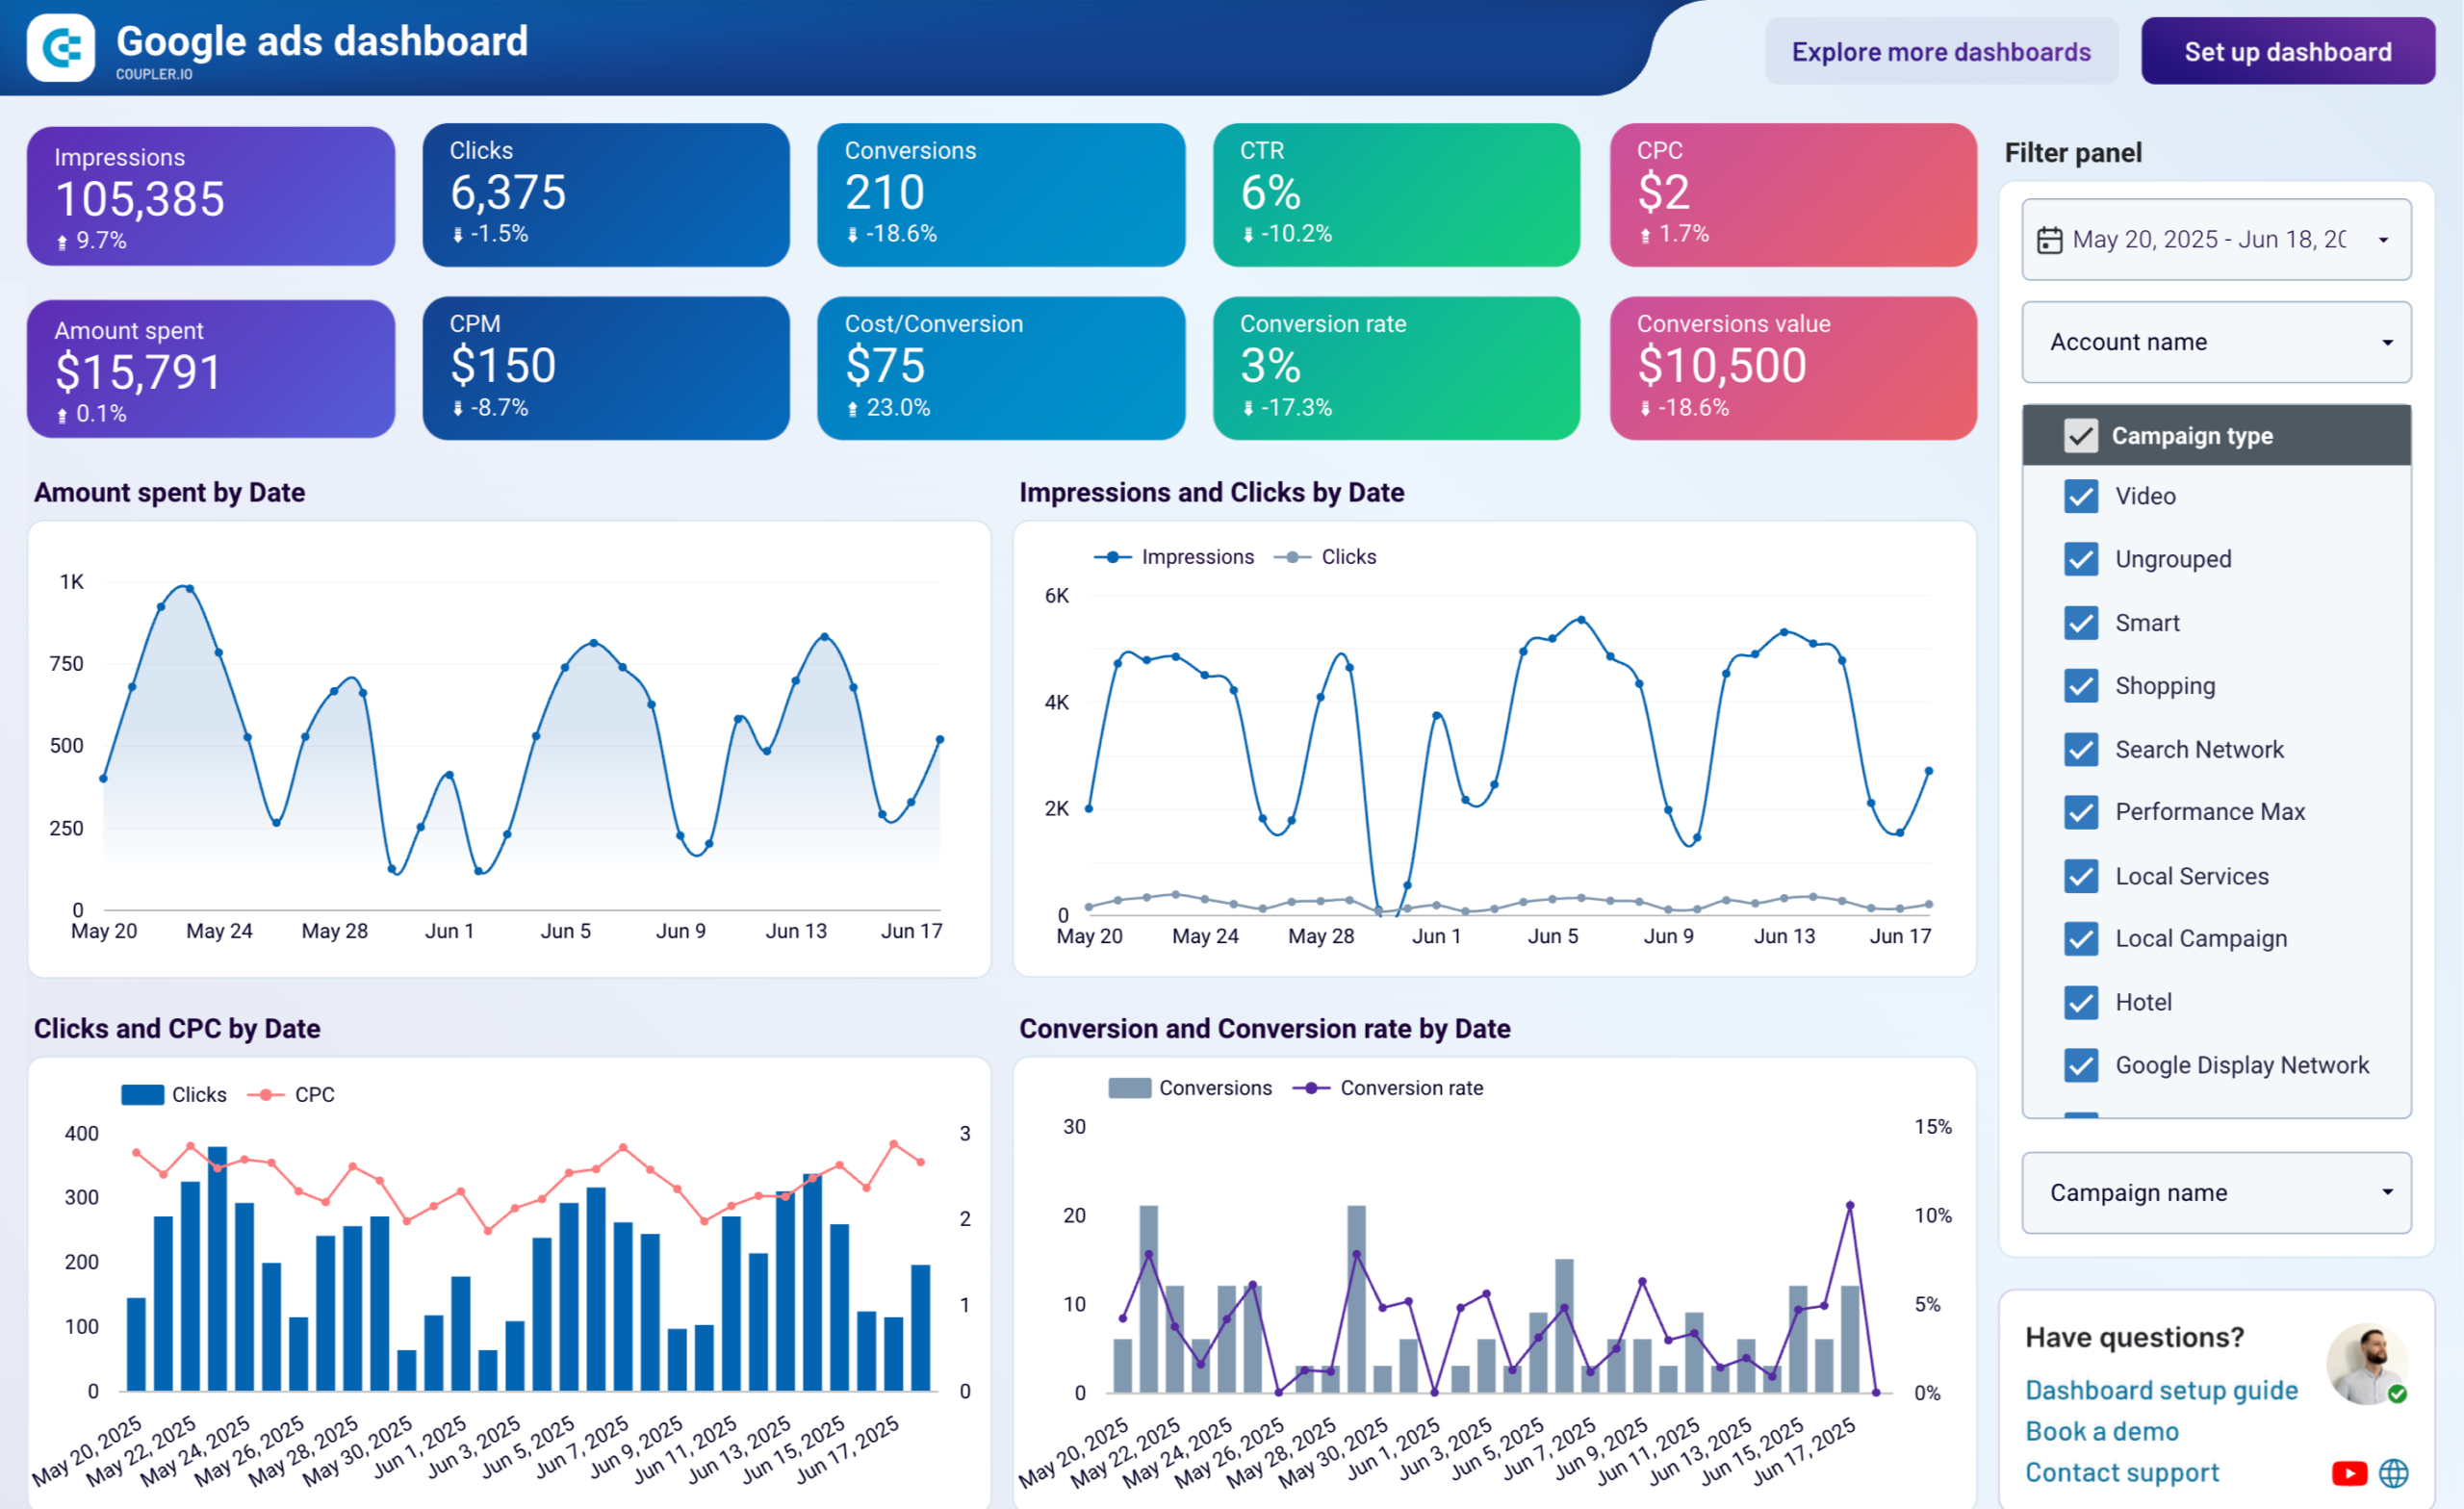
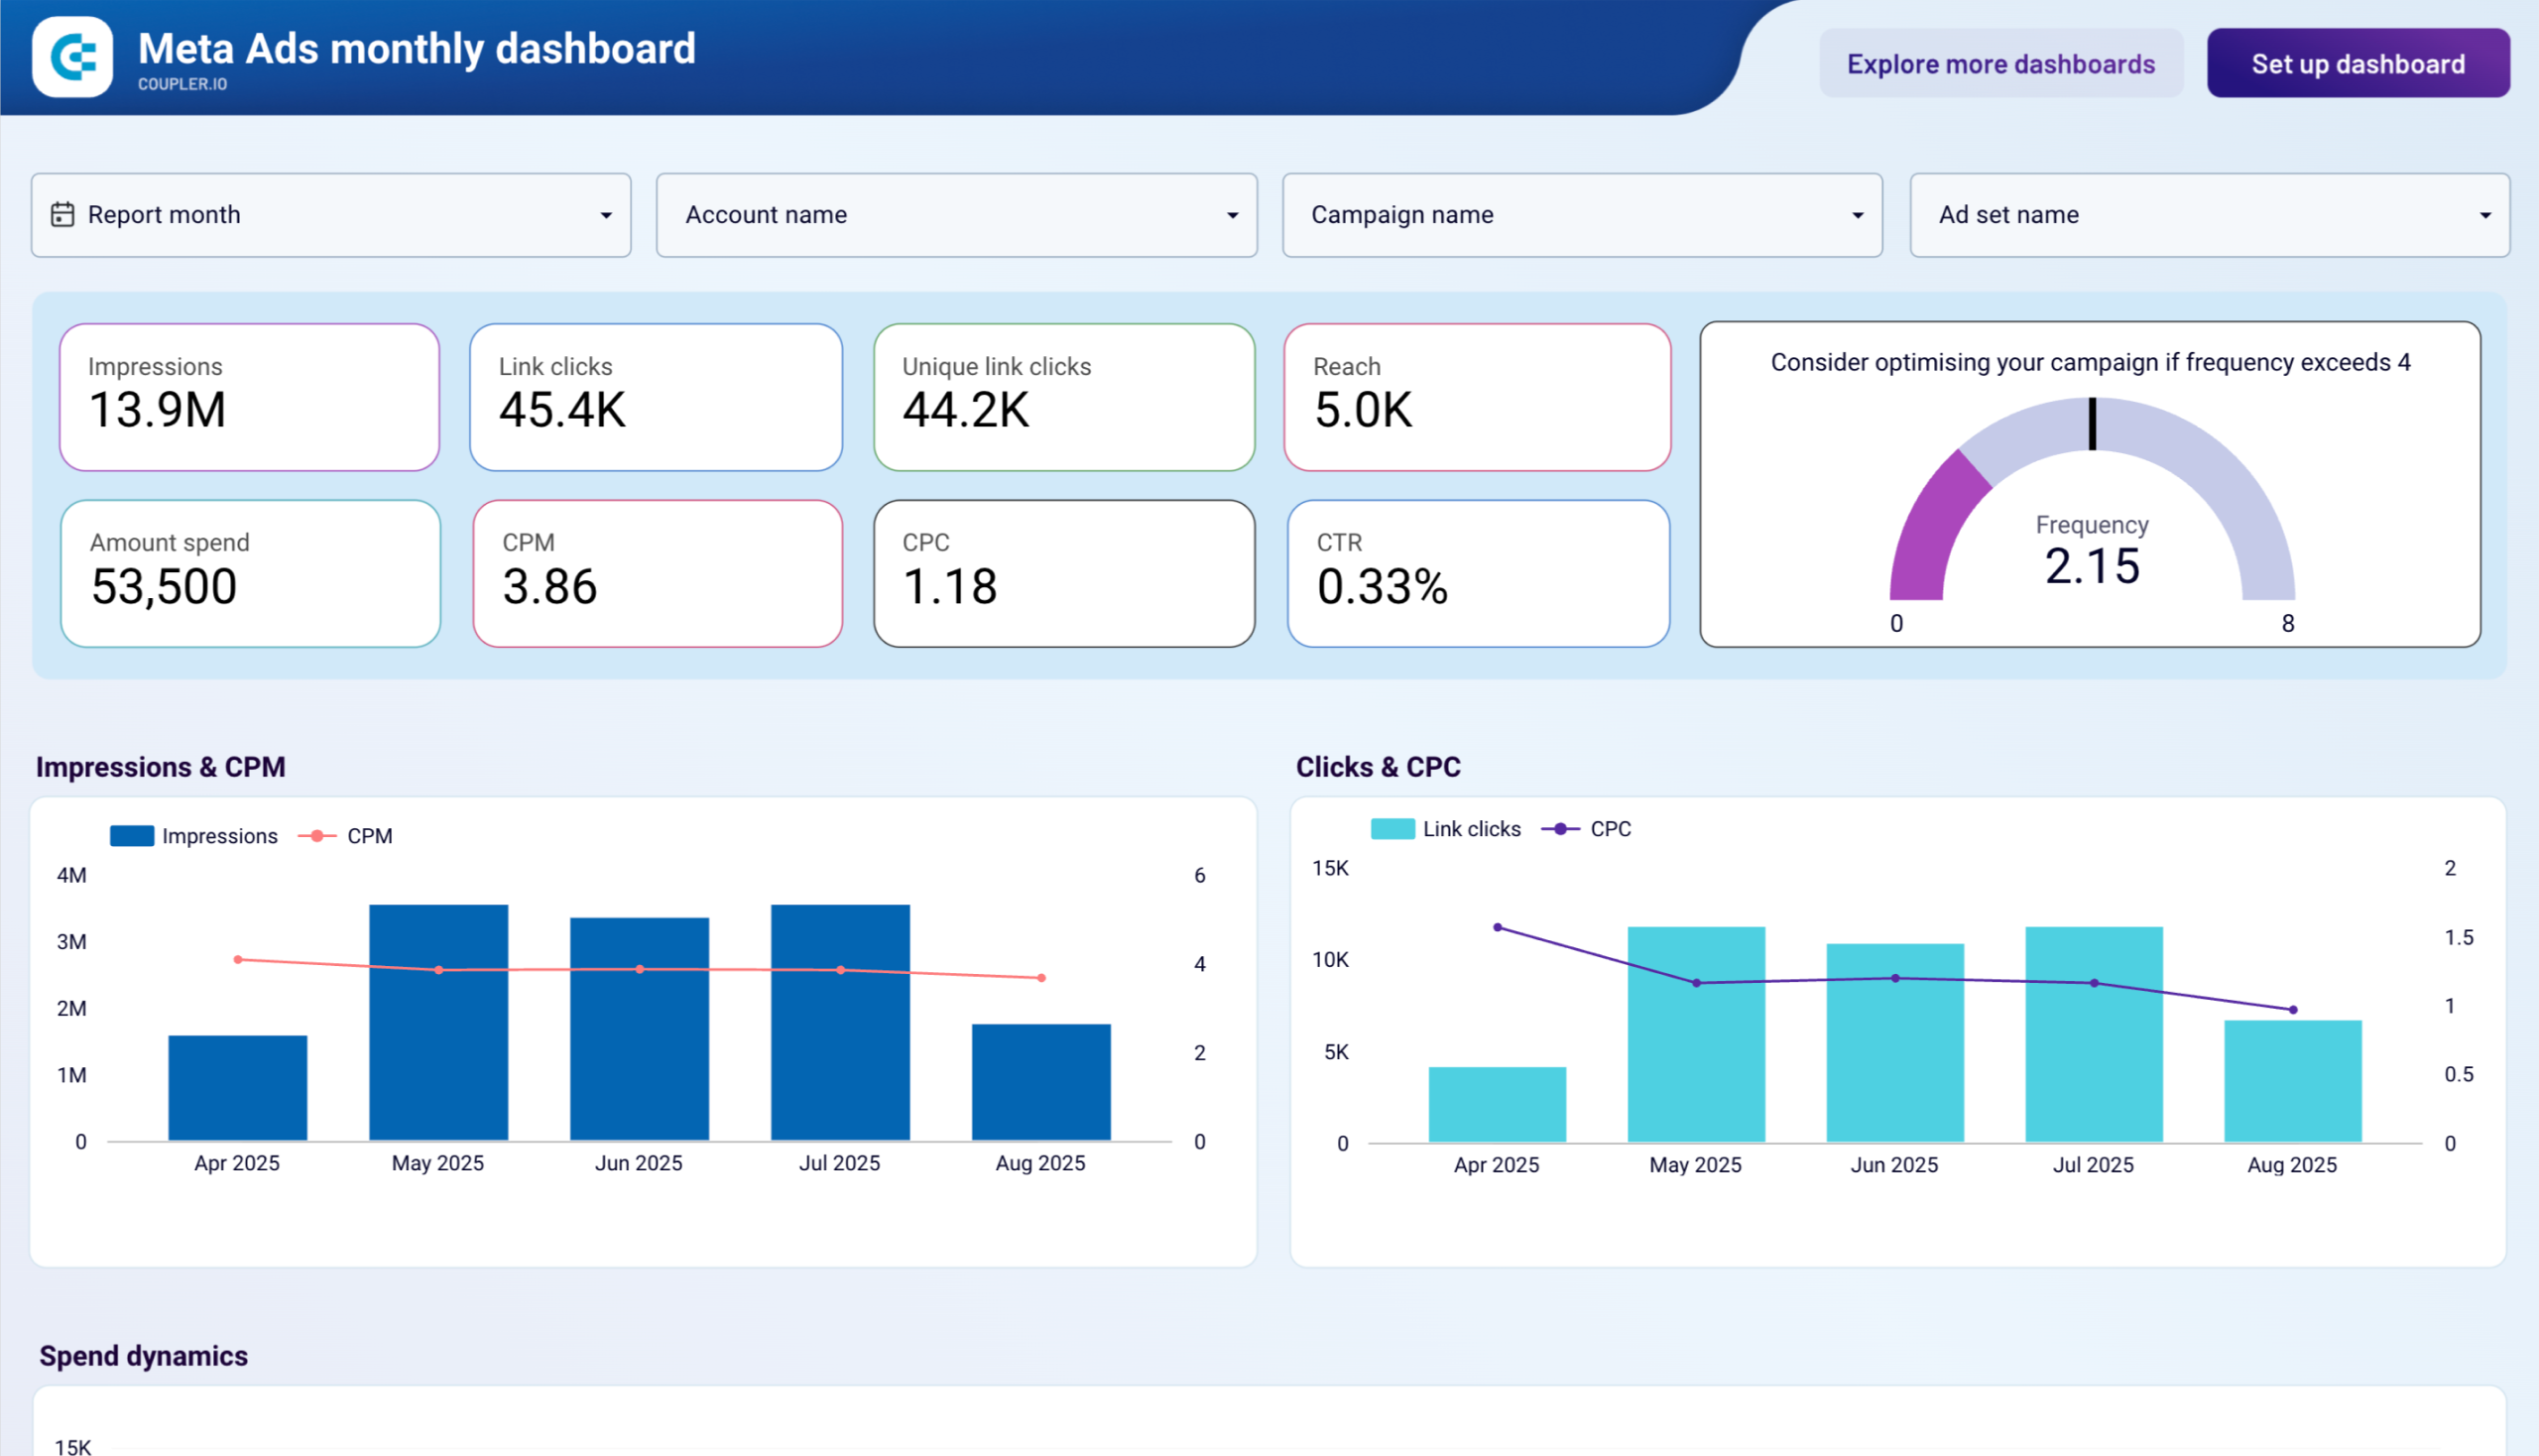
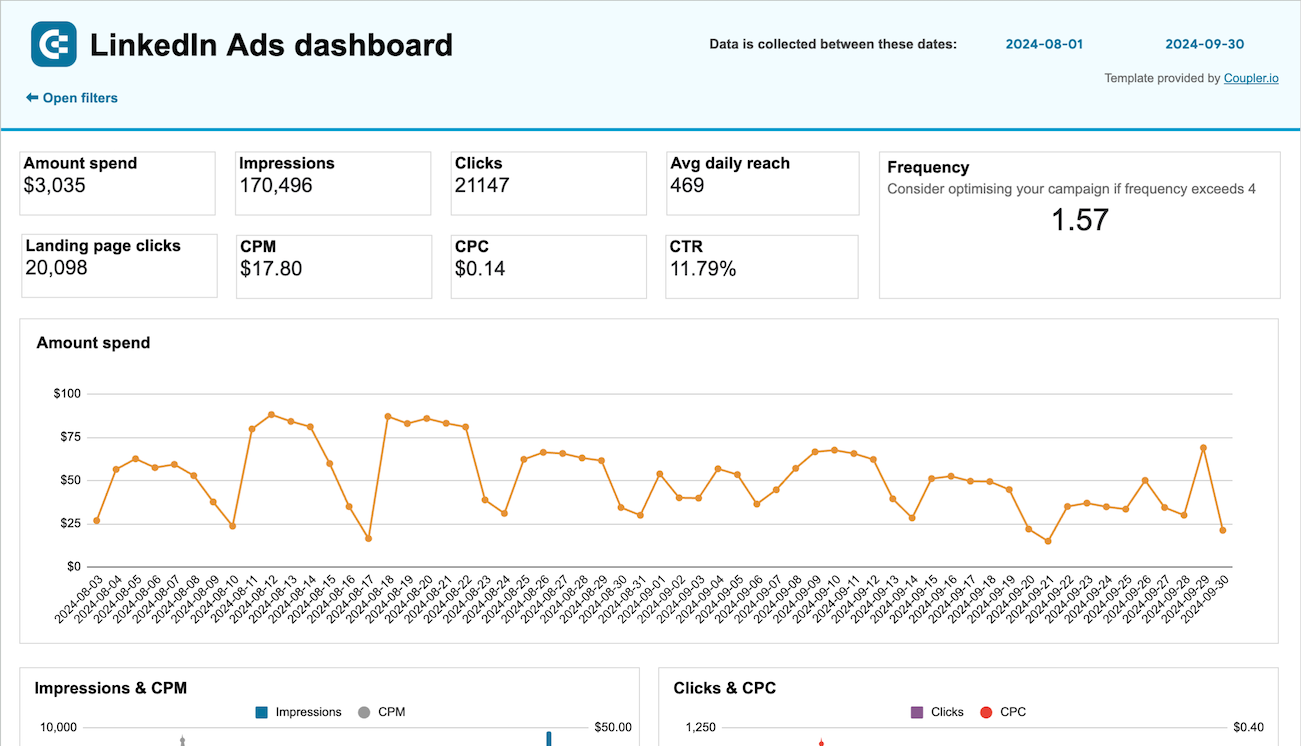
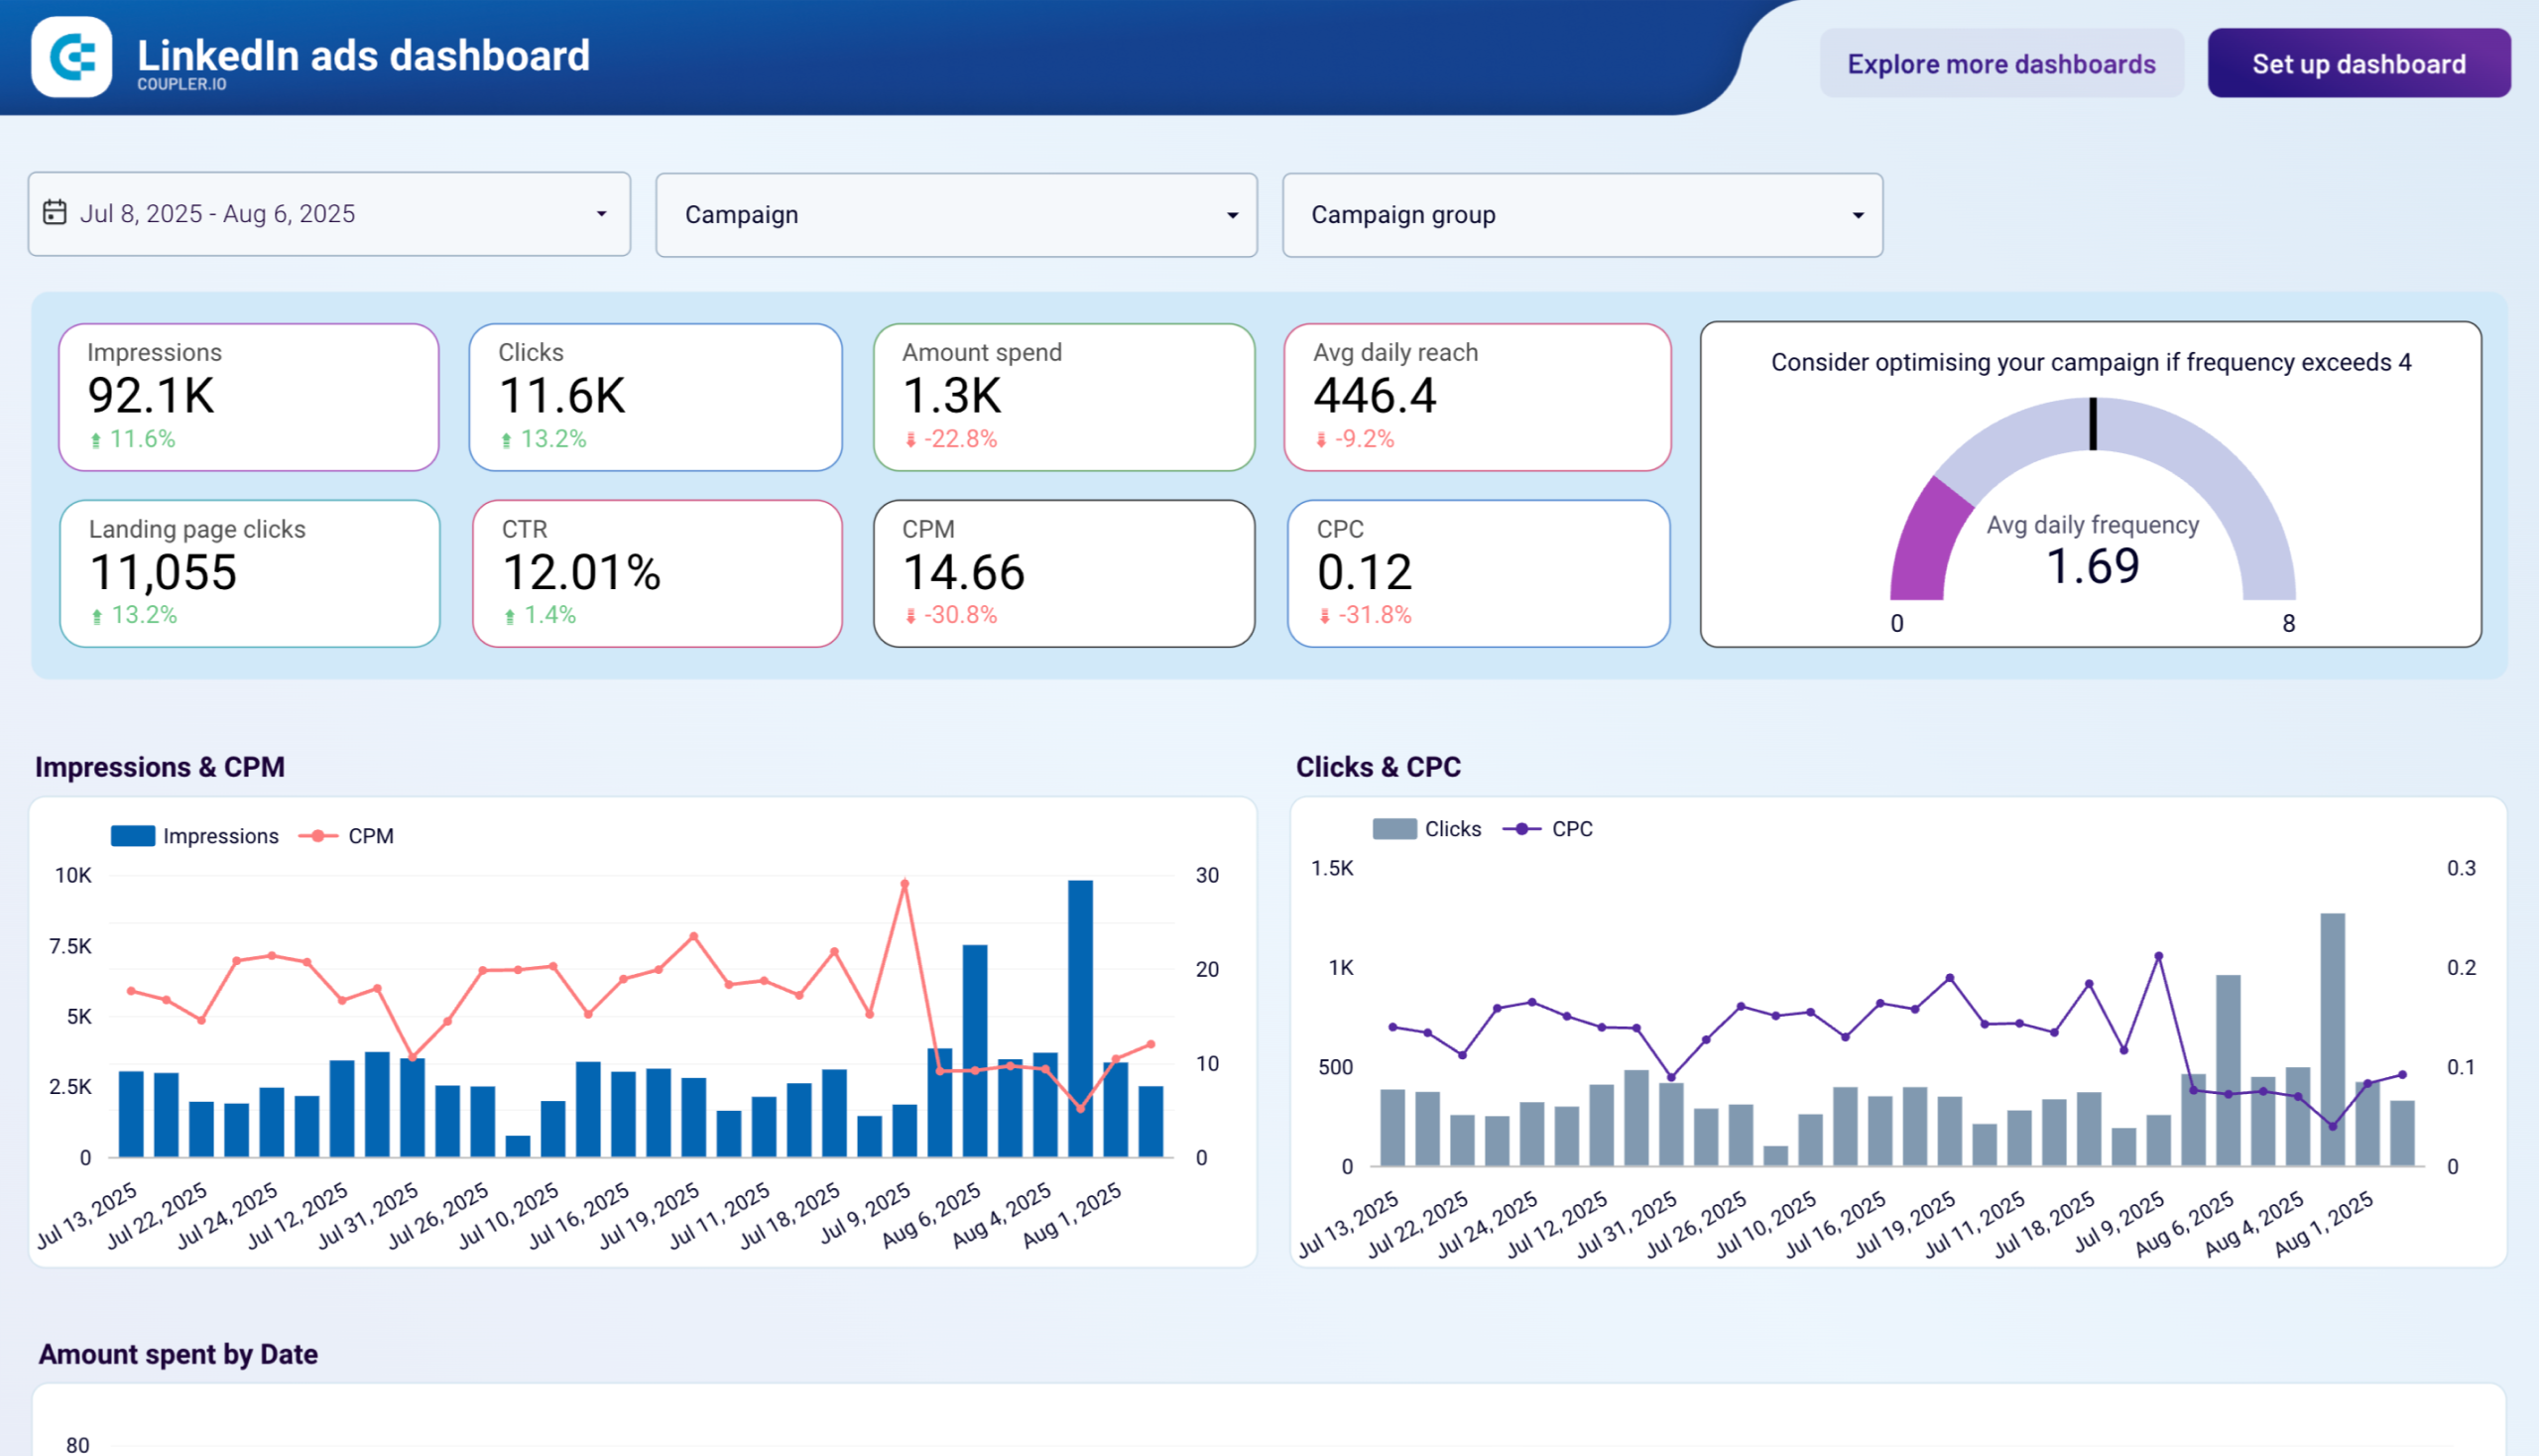
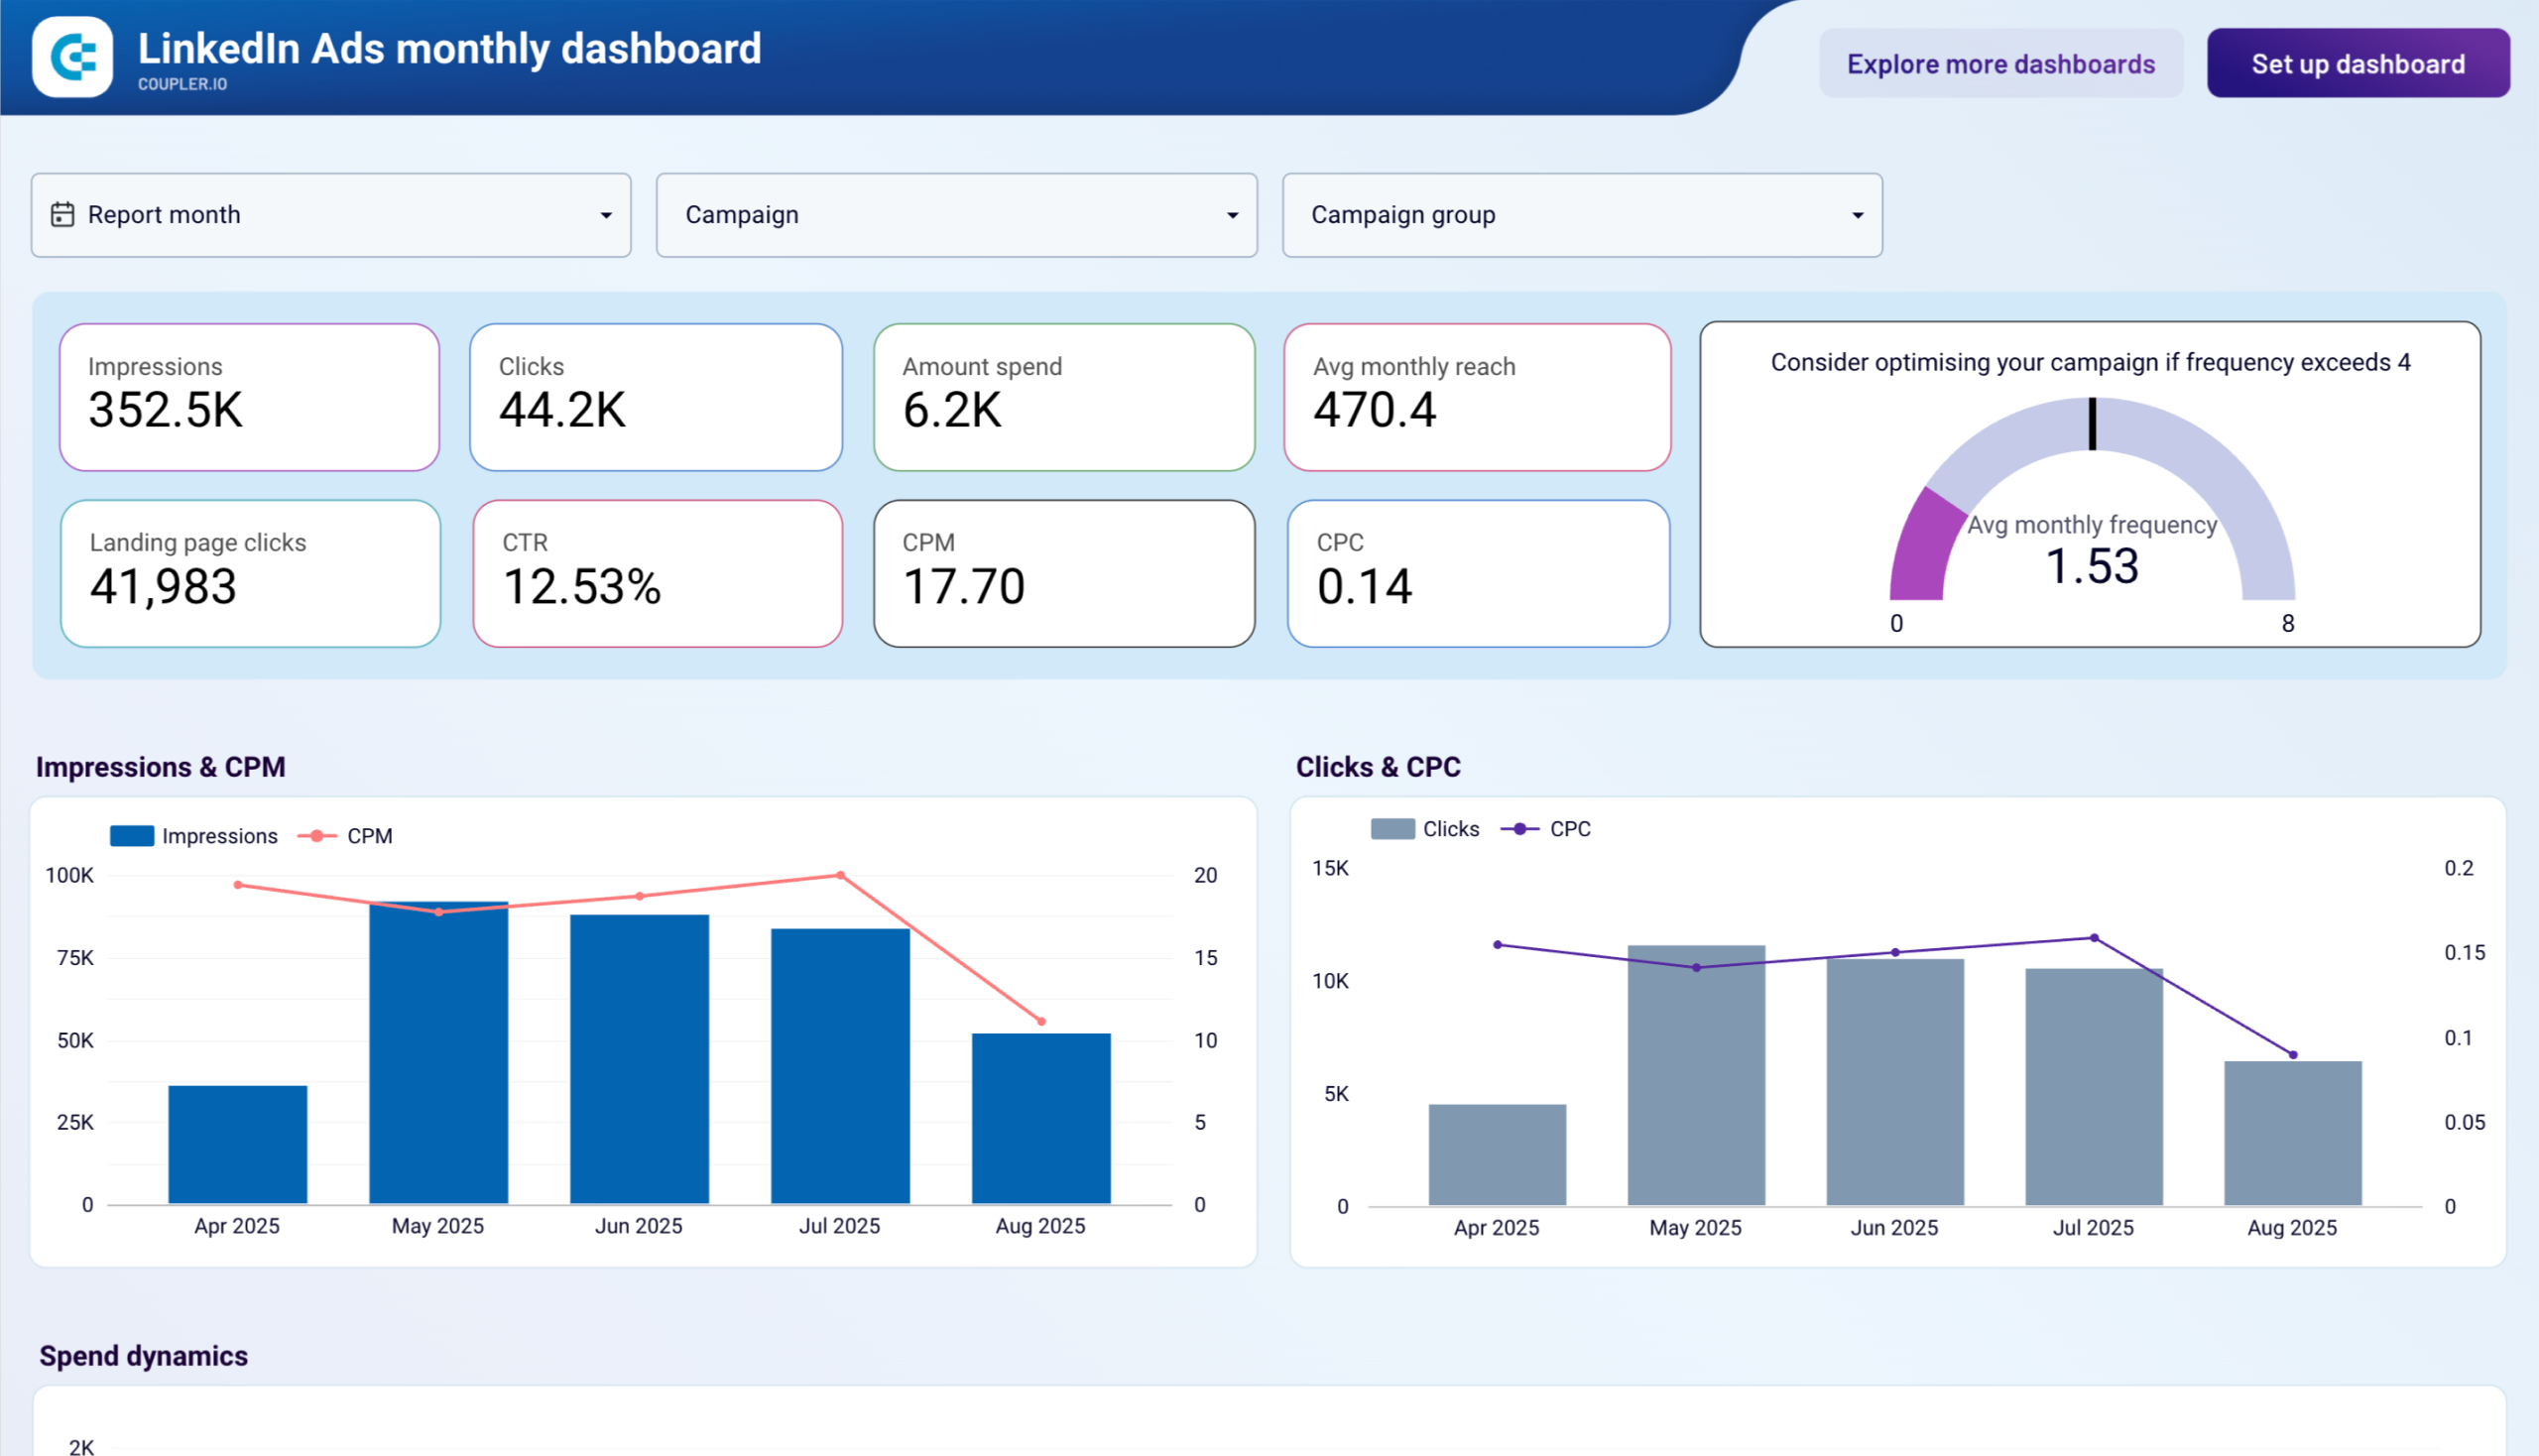
Analyze multi-channel campaign performance by measuring impressions, clicks, and ad spend to assess visibility, interaction, and investment impact.
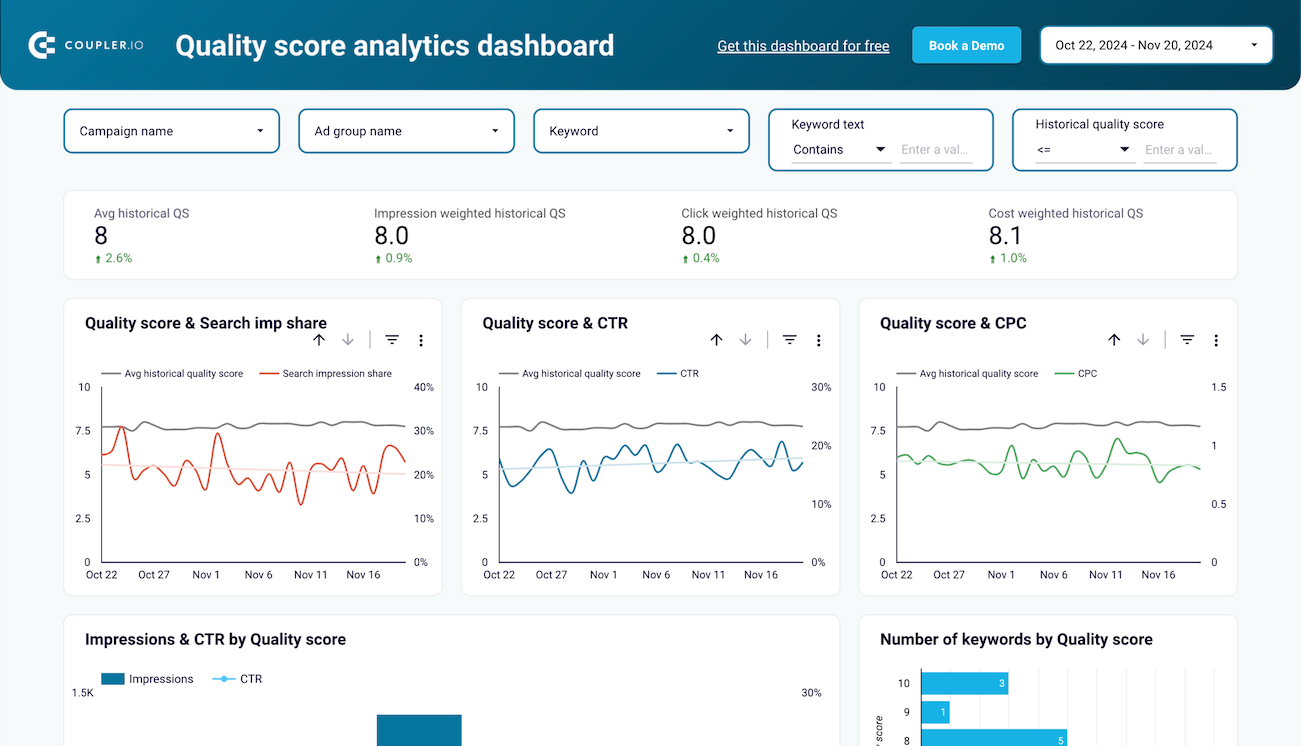
Check the performance of advertising campaigns you run on different platforms and compare their outcomes to improve your creatives
Track and compare ad group performance across channels using metrics like impressions, clicks, and spend. Understand which groups drive engagement and optimize spend allocation across platforms.
Compare advertising performance across platforms by audience demographics to identify which age and gender segments drive the most engagement
Evaluate geographic performance across platforms to identify which countries generate the best results for your advertising campaigns
Analyze how your ads perform across devices—desktop, mobile, tablet—on multiple platforms to refine targeting and user experience strategies
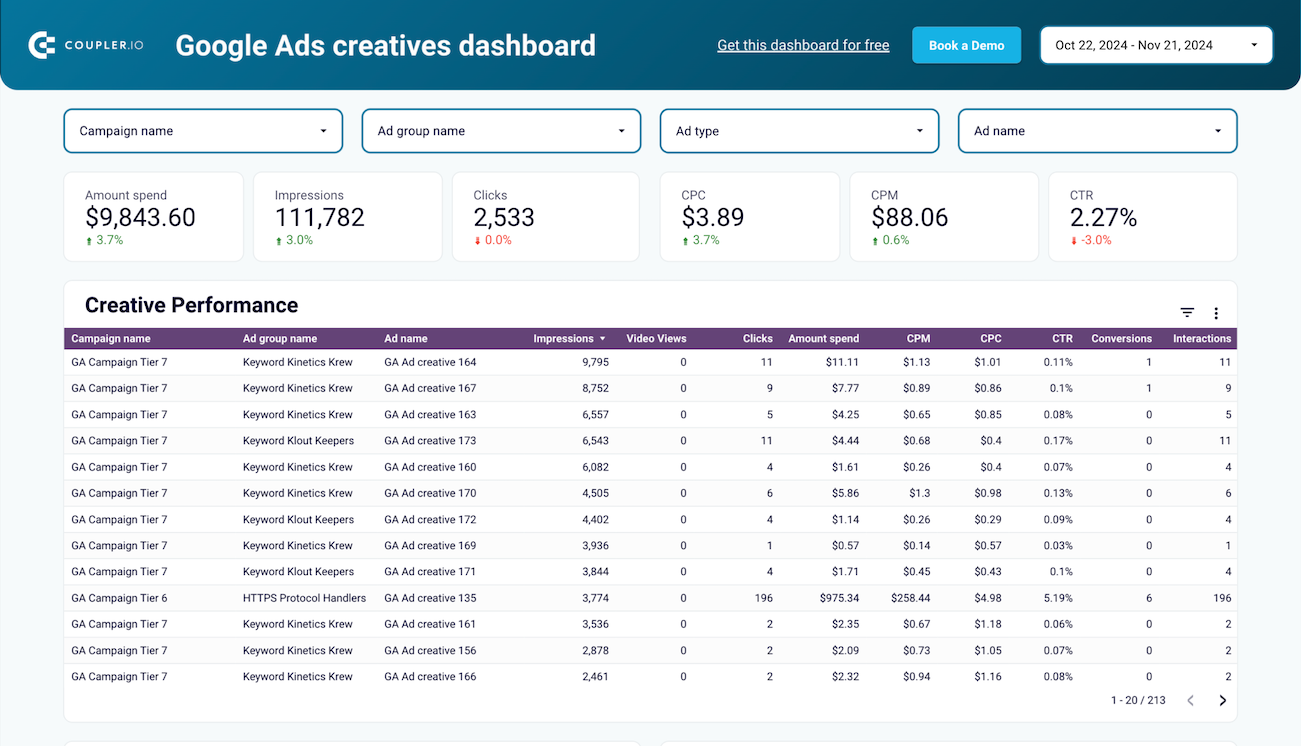
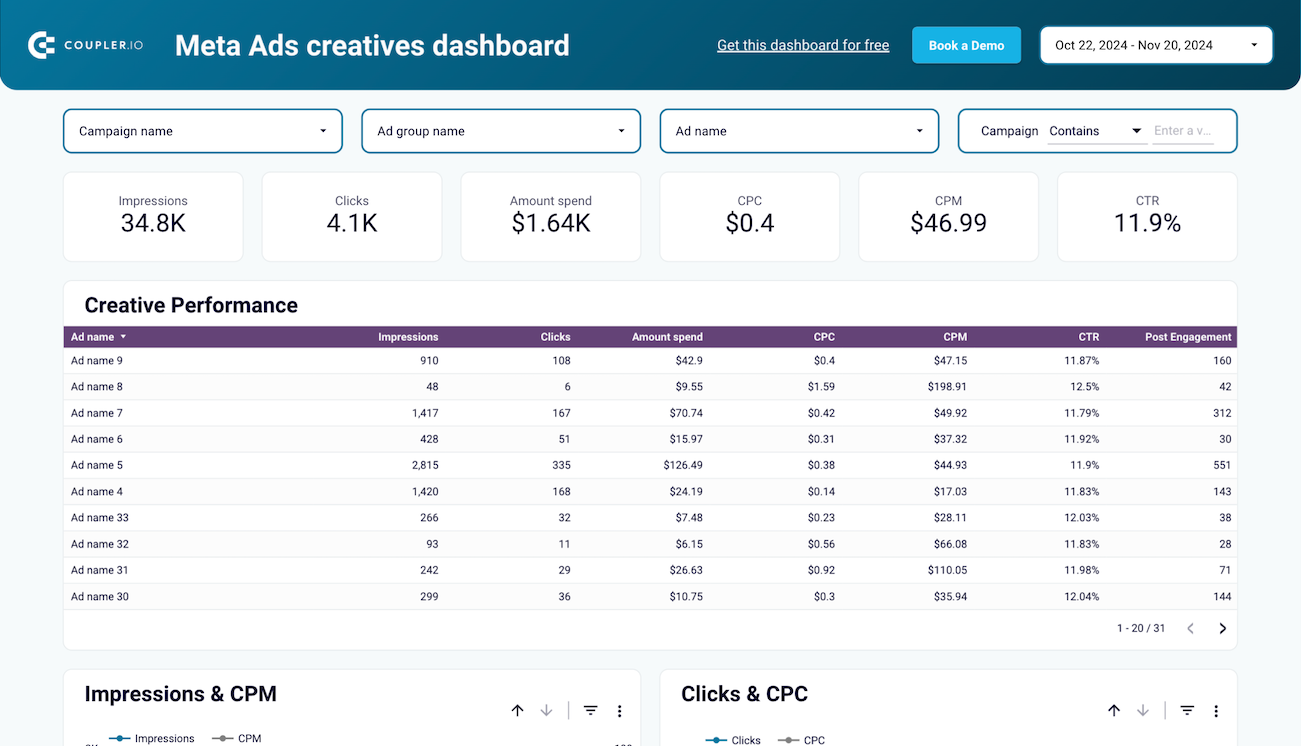
Evaluate the effectiveness of TikTok ad creatives by analyzing performance across formats and time periods to optimize content strategy
Track your Pipedrive acquisition performance at the weekly level by merging advertising data with lead generation metrics. Spot emerging patterns early and refine your marketing tactics based on real-time weekly insights.
+1
Unify your advertising performance data with Pipedrive lead metrics to measure acquisition effectiveness.
+1
Monitor customer acquisition dynamics in Salesforce with week-by-week precision. Connect advertising campaign data with lead generation to identify trends quickly and make timely adjustments to your marketing strategy.
+1
Track your complete customer acquisition journey in Salesforce by connecting advertising data with CRM leads.
+1
Gain granular visibility into your HubSpot acquisition funnel with weekly performance breakdowns. Track advertising effectiveness and lead flow on a weekly cadence to respond faster to market changes and optimize campaigns.
+1
Connect your advertising investments to HubSpot lead outcomes with a comprehensive monthly funnel view.
+1
about your case. It doesn't cost you a penny.
Connect your favorite apps and get data in minutes


