Connect TikTok Ads to BigQuery with Coupler.io to simplify marketing reporting
Get and prepare data effortlessly
Connect TikTok Ads to BigQuery to effortlessly gather and refine your advertising data to make it analysis-ready. Enjoy Coupler.io's unified interface to manage data collection, transformation, and scheduling. Experience unmatched reliability, exceptional support, and the convenience of using a one-stop shop.
Automate reporting tasks
Automate data reporting with Coupler.io, which allows you to schedule data exports from TikTok Ads to BigQuery. Eliminate manual jobs like copy-pasting or exporting-importing CSV files. Create cross-application reports or benefit from our ready-to-use dashboard templates to accelerate your reporting tasks.
Stand out as a data-driven expert
Make your marketing decisions driven by insights extracted from advertising performance data. Automate your reporting with Coupler.io and spend more time focusing on high-value activities. Deliver dynamic reports and share them with clients and stakeholders. Be an expert who always makes informed decisions.
Export data from TikTok Ads to alternative destinations
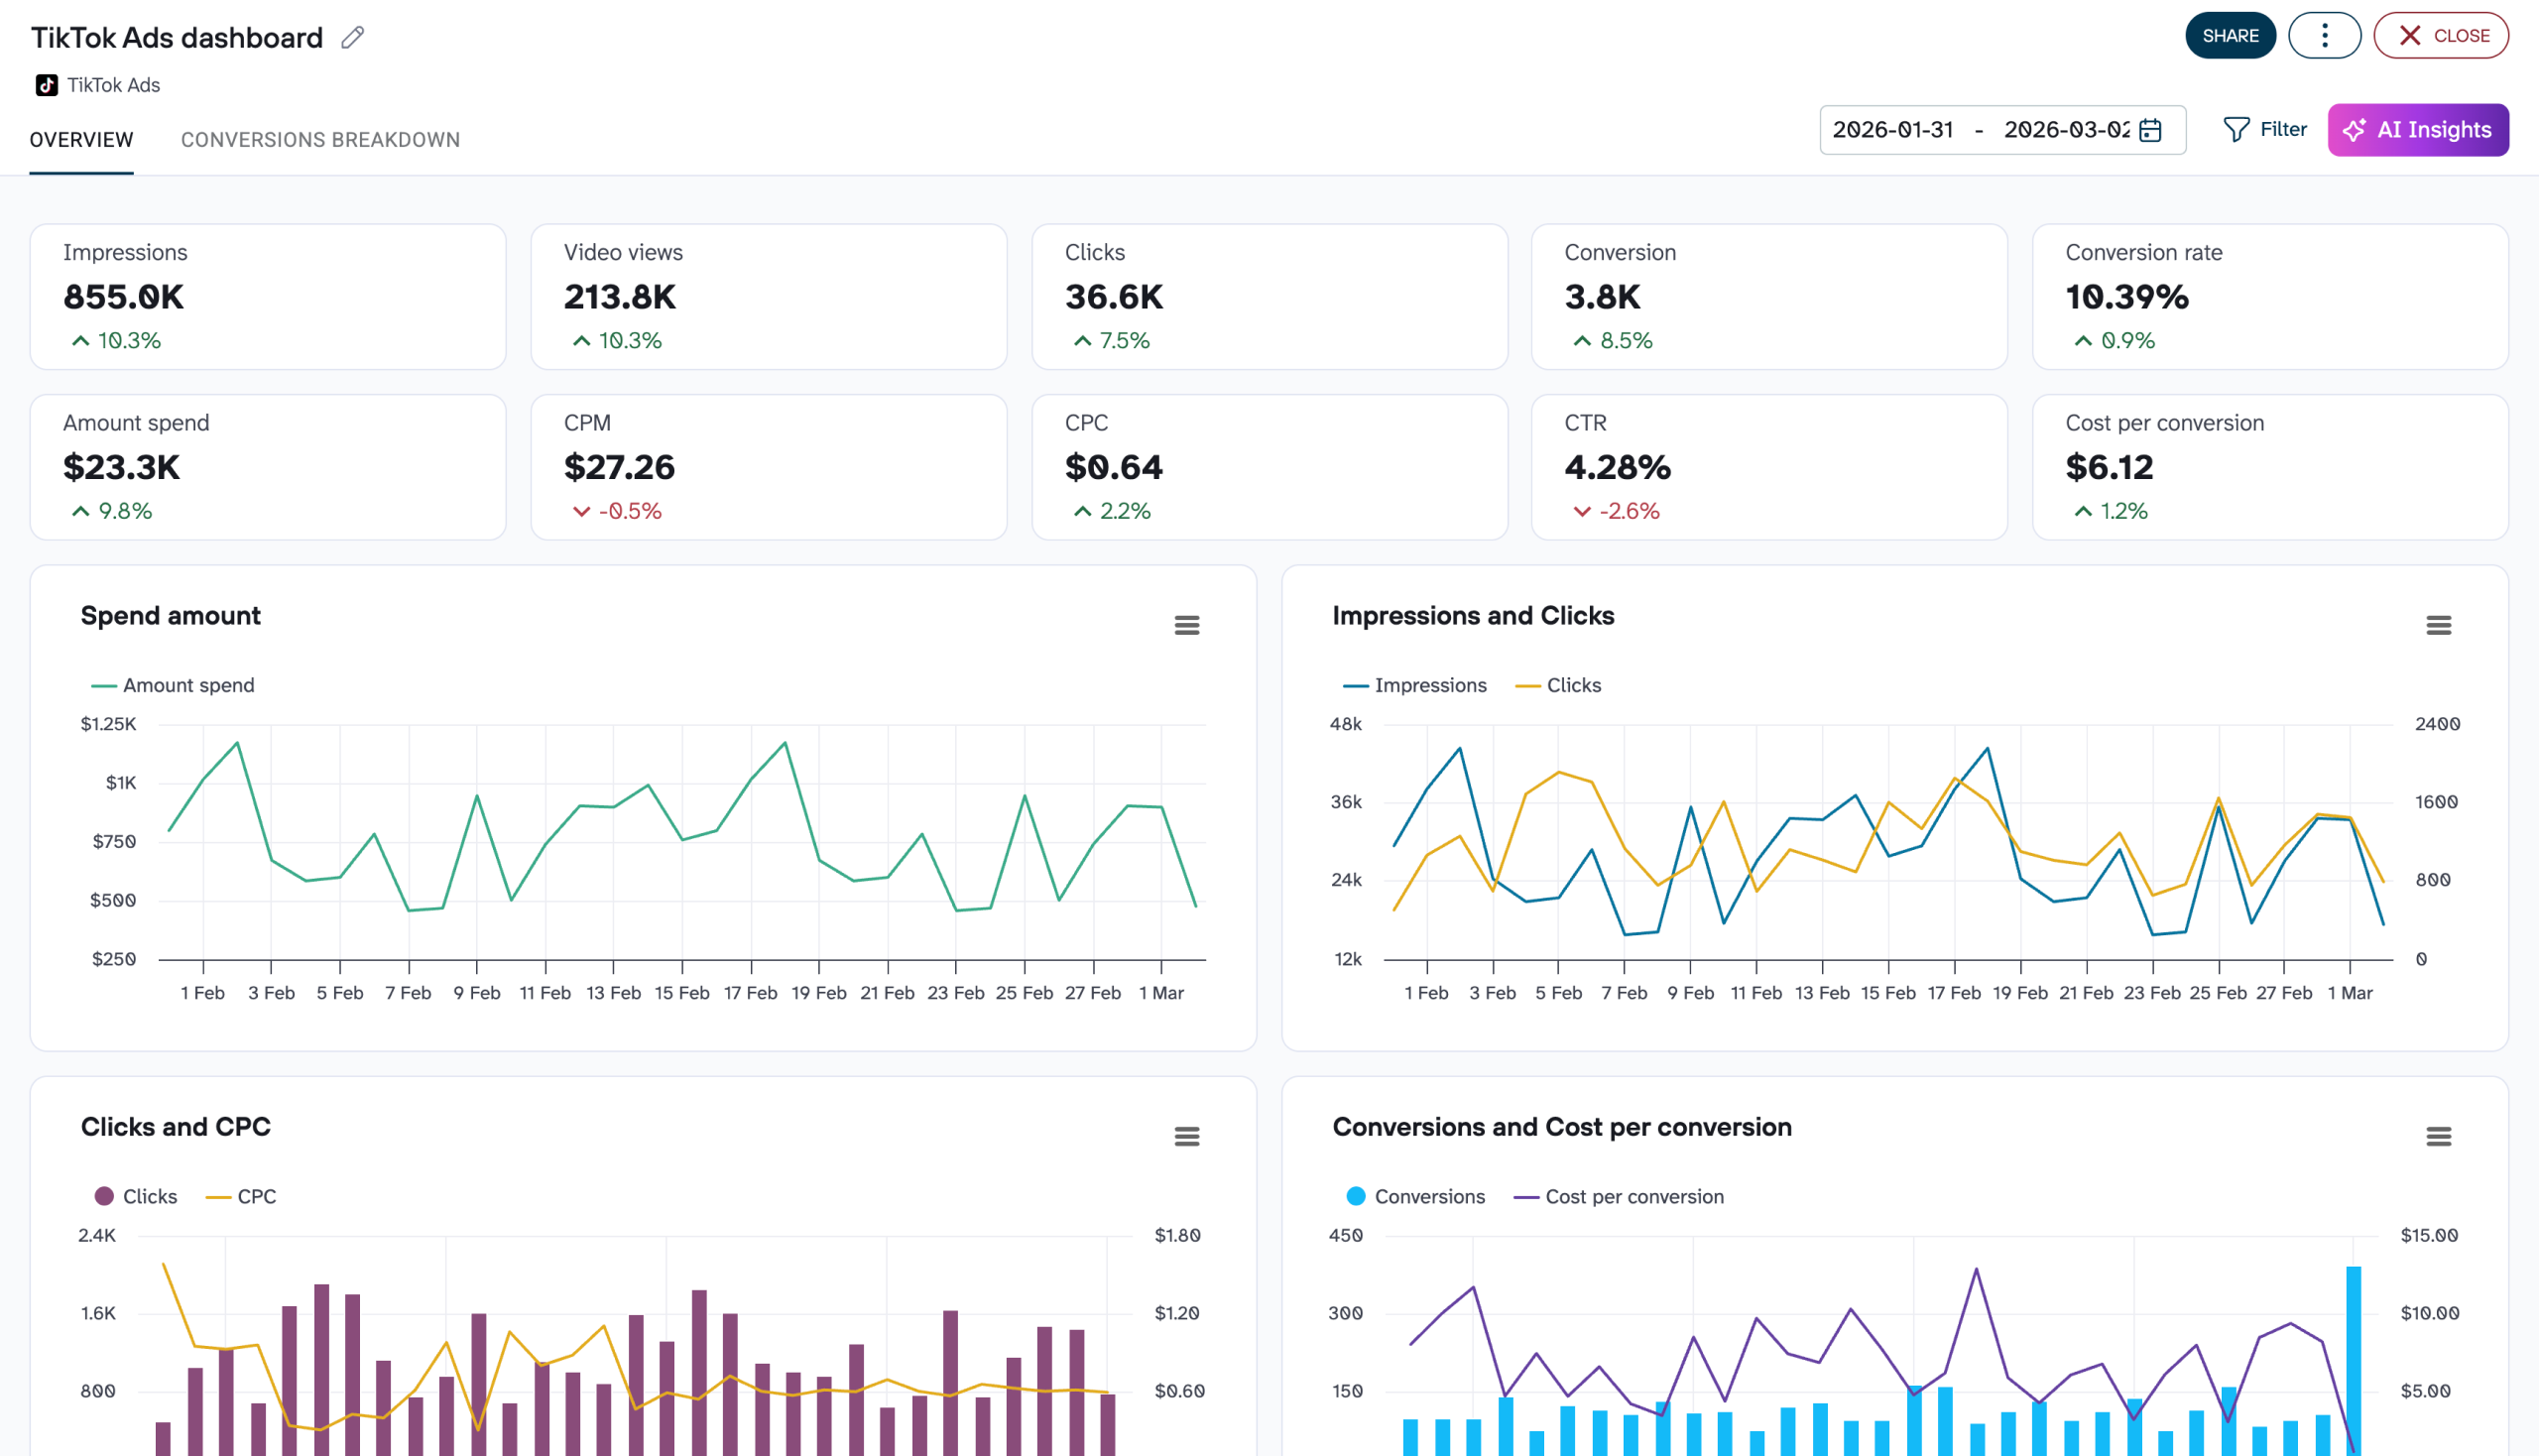
Quick start with PPC dashboard templates
No such template is available yet.
No worries. Our team will create a template that fits your needs, just tell us more
about your case. It doesn't cost you a penny 😉
Request a custom report
about your case. It doesn't cost you a penny 😉
Set up a TikTok Ads to BigQuery integration with just a few clicks.
Connect similar PPC apps and get data in minutes
Load data from TikTok Ads to BigQuery: what to export
Basic Reports (by campaign, ad, advertiser, ad group)
Basic reports offer a starting point to understand how your advertising is performing on TikTok. It contains such metrics as impressions, clicks, conversions, and spending across different dimensions. Export this data from TikTok Ads to BigQuery to evaluate overall campaign effectiveness. As a result, you can make necessary optimizations for better ROI.
Audience Reports (by campaign, ad, advertiser, ad group)
Ad audience reports investigate users' demographics and behavior when interacting with your ads. Use this data to discover valuable insights into your users, such as age, gender, location, and device type. Make your ads reach the desirable audiences more efficiently.
Playable Ad Report
Playable ad reports provide in-depth performance measures for interactive ads. This type of report lets the users play mini-games and other interactive elements before they go through the main content. Set up a way to analyze the engagement data, completion rates, and interactions with the ads. Export this report to understand how playable ads help reach your marketing goals.
Playable Ad Report by Country
This report reveals the performance of your playable ads by country. It breaks down the engagement geographically to show preferences and patterns. With this data, you can localize your advertising strategies for effective results.
Dynamic Showcase Ads (DSA) Reports (by campaign, ad, advertiser, ad group)
Dynamic Showcase Ads (DSA) reports focus on the performance of personalized automated ads. These ads display products or services based on user behavior. Connect TikTok Ads to BigQuery and automate exports of DSA reports categorized by campaign, ad, advertiser, and ad group. Analyze DSA effectiveness, including views, clicks, and conversion rates, to optimize ad delivery and content relevancy.
How to connect TikTok Ads to BigQuery
Step 1. Connect your TikTok Ads account and choose a data entity to export
Step 2. Organize and transform data before loading it to BigQuery
Step 3. Connect your BigQuery account and specify where to load your data
Step 4. Schedule data refresh to automate data flow from TikTok Ads to BigQuery
Pricing plans
- Monthly
- Annual (save 25%)
Keep your data safe
Coupler.io safeguards your shared information and data transfers from breaches, leaks, and unauthorized disclosures.

How to connect TikTok Ads to BigQuery (detailed guide)
Follow these essential steps to export, organize, and automate your TikTok Ads data.
Step 1: Collect Data
Begin by establishing a connection between Coupler.io and your TikTok Ads account. You'll then need to choose the specific report you wish to export:
Step 2: Organize & Transform Data
Once your data selection is complete, Coupler.io offers powerful tools to organize and refine your data before loading it to BigQuery. This step is where you can tailor the dataset to meet your needs. Users have the option to:
Step 3: Load data
The final step involves connecting to your BigQuery account. Follow the intuitive in-app instructions to complete this.
Once connected, enter the names of the existing dataset and table. Or you can create new ones by typing in new names.
By default, Coupler.io will autodetect the table schema, but you can manually toggle this off and enter the schema for the table.
Once you've set up the destination parameters, click Run Importer to launch the data flow. Connecting TikTok Ads to BigQuery with Coupler.io allows you to enhance your reporting capabilities.
Enable automatic data refresh to maximize efficiency and ensure your data remains up-to-date.
Step 1: Collect Data
Begin by establishing a connection between Coupler.io and your TikTok Ads account. You'll then need to choose the specific report you wish to export:
- Basic reports (by campaign, ad, advertiser, ad group)
- Audience reports (by campaign, ad, advertiser, ad group)
- Playable ad report
- Playable ad report by country
- Dynamic Showcase Ads (DSA) reports (by campaign, ad, advertiser, ad group)

Step 2: Organize & Transform Data
Once your data selection is complete, Coupler.io offers powerful tools to organize and refine your data before loading it to BigQuery. This step is where you can tailor the dataset to meet your needs. Users have the option to:
- Preview data
- Apply filters
- Sort information
- Rename columns or change their order
- Add custom columns for more tailored customization
Step 3: Load data
The final step involves connecting to your BigQuery account. Follow the intuitive in-app instructions to complete this.
Once connected, enter the names of the existing dataset and table. Or you can create new ones by typing in new names.
By default, Coupler.io will autodetect the table schema, but you can manually toggle this off and enter the schema for the table.

Once you've set up the destination parameters, click Run Importer to launch the data flow. Connecting TikTok Ads to BigQuery with Coupler.io allows you to enhance your reporting capabilities.
Enable automatic data refresh to maximize efficiency and ensure your data remains up-to-date.
Automate dataflow from TikTok Ads to BigQuery on a schedule
Automate the data export from TikTok Ads to BigQuery to ensure the most up-to-date information powers your reporting. This automation is crucial for advertisers aiming to make decisions based on real-time insights.
For this, Coupler.io provides an automatic data refresh feature. Users can set the refresh interval according to their specific reporting needs:
Such customization ensures updates occur precisely when needed. Use Coupler.io's scheduling feature to optimize your reporting processes. Ultimately, you will drive more effective marketing strategies with confidence.
For this, Coupler.io provides an automatic data refresh feature. Users can set the refresh interval according to their specific reporting needs:
- Every month
- Every day
- Every hour
- Every 30 minutes
- Every 15 minutes
- Exact days of the week
- Time of the day
- Preferred timezone

Such customization ensures updates occur precisely when needed. Use Coupler.io's scheduling feature to optimize your reporting processes. Ultimately, you will drive more effective marketing strategies with confidence.
Connect TikTok Ads to BigQuery or another destination
Coupler.io stands out by offering unparalleled flexibility in data export destinations. You can connect TikTok Ads to BigQuery or other data warehouses, spreadsheet apps, and BI tools. This way, users can adapt their data flow to the most used tools.
You can duplicate your importers and select a new destination from an extensive list with just a few clicks. Options include:
Coupler.io allows you to switch to different destinations easily. This allows users to collect their TikTok Ads data in a centralized BigQuery database and send the insights to other platforms. Whether you need to generate detailed reports in spreadsheet applications. Or conduct an in-depth analysis in data warehouses. Or visualize trends in BI tools.
You can duplicate your importers and select a new destination from an extensive list with just a few clicks. Options include:
- popular spreadsheet applications like Google Sheets and Microsoft Excel
- other data warehouses such as PostgreSQL and Redshift
- sophisticated BI tools, including Looker Studio, Power BI, Tableau, and Qlik.
Coupler.io allows you to switch to different destinations easily. This allows users to collect their TikTok Ads data in a centralized BigQuery database and send the insights to other platforms. Whether you need to generate detailed reports in spreadsheet applications. Or conduct an in-depth analysis in data warehouses. Or visualize trends in BI tools.
Combine data from TikTok Ads with data from other sources in BigQuery
You need to integrate insights from various platforms to make a comprehensive analysis. Coupler.io lets you combine your TikTok Ads data with information from other ad sources and apps into BigQuery. You can collect data and meaningfully blend it into a marketing performance report.
Coupler.io offers two powerful options for blending your data: union and join.
Union means that data elements will be appended from one source to another. For a successful union, the columns across the sources must have matching names. On the other hand, the join option allows you to place two datasets side by side. You can align them on a common column present in each dataset. This data blending method perfectly compares and contrasts data points from different sources.
To use these blending options:
This way, you can craft a customized report for insightful, data-driven decision-making.
Coupler.io offers two powerful options for blending your data: union and join.
Union means that data elements will be appended from one source to another. For a successful union, the columns across the sources must have matching names. On the other hand, the join option allows you to place two datasets side by side. You can align them on a common column present in each dataset. This data blending method perfectly compares and contrasts data points from different sources.
To use these blending options:
- Start by adding your primary data source, such as TikTok Ads.
- Click on Add one more source and configure additional datasets. You can add other advertising platforms, CRM apps, analytics tools, etc.
- Once your sources are connected, click Transform data and choose between a union or join to combine your data.
This way, you can craft a customized report for insightful, data-driven decision-making.