Facebook Ads Connector
Automate exports of Facebook Ads analytics data to spreadsheets, dashboards, or data warehouses with Coupler.io. Use its out-of-the-box Facebook Ads connector to turn raw data into insights that will drive your decision-making.


How to set up your Facebook Ads integration
Export data from Facebook Ads to alternative destinations


Quick start with PPC dashboards

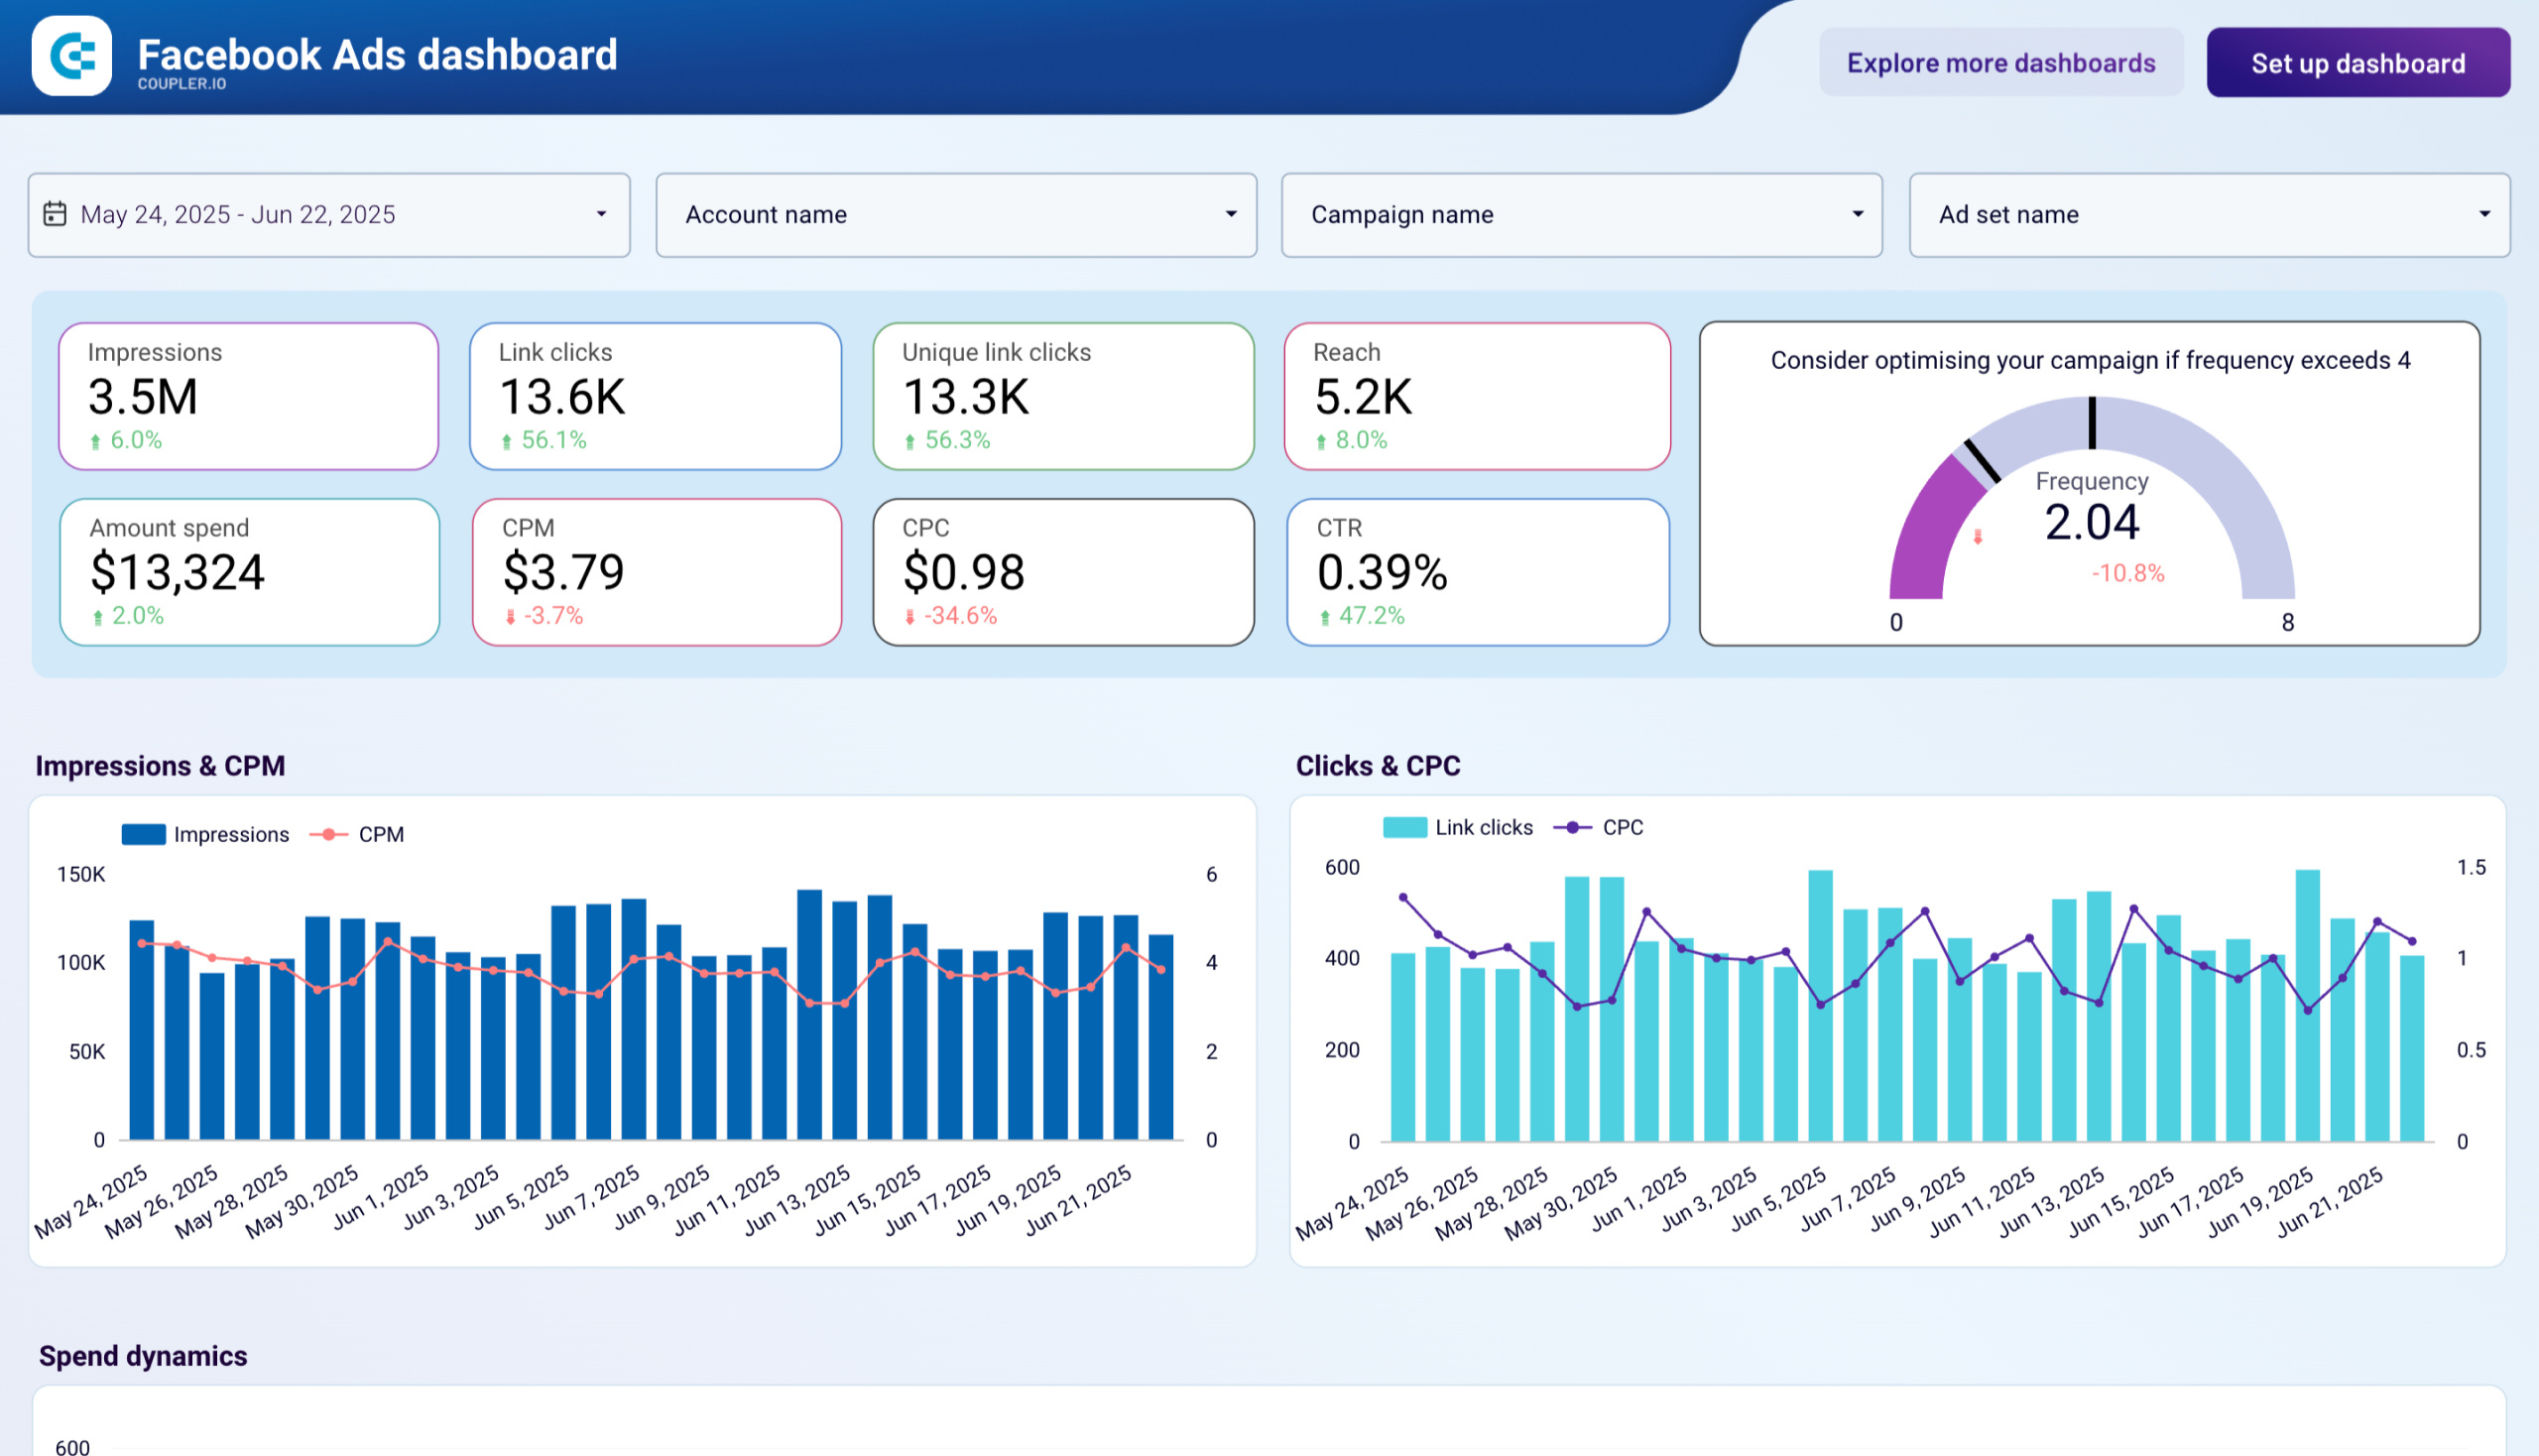
Evaluate ad performance on Facebook with insights into clicks, costs, ad frequency, demographic and geography breakdowns to enable data-driven decisions to improve engagement, and maximize ROI.

Effectively manage and optimize your Facebook advertising campaigns, reaching your target audience in a data-driven way.


Monitor the performance of your advertising campaigns in Facebook and identify top assets to spend your budget wisely.

about your case. It doesn't cost you a penny 😉
Data set templates gallery
Analyze multi-channel campaign performance by measuring impressions, clicks, and ad spend to assess visibility, interaction, and investment impact.


Check the performance of advertising campaigns you run on different platforms and compare their outcomes to improve your creatives
Track and compare ad group performance across channels using metrics like impressions, clicks, and spend. Understand which groups drive engagement and optimize spend allocation across platforms.

Compare advertising performance across platforms by audience demographics to identify which age and gender segments drive the most engagement
Evaluate geographic performance across platforms to identify which countries generate the best results for your advertising campaigns
Analyze how your ads perform across devices—desktop, mobile, tablet—on multiple platforms to refine targeting and user experience strategies
Track and compare performance across multiple Facebook ad accounts with detailed and aggregated views by week, month, and year
Compare how individual ads perform across Facebook and Instagram to identify top creatives and optimize your cross-platform strategy
Evaluate how ad creatives perform across Facebook and Instagram, with insights segmented by platform, ad name, and time period.
Compare advertising results across countries for this and last year, using detailed and aggregated performance views
Analyze Facebook Ads performance segmented by age and gender, with monthly and yearly comparisons to identify top-performing audience groups
Track and compare performance across multiple Facebook ad accounts with detailed and aggregated views by week, month, and year.
Evaluate Meta campaign success through reach, engagement, and lead generation metrics to understand overall effectiveness and return on investment
Track your Pipedrive acquisition performance at the weekly level by merging advertising data with lead generation metrics. Spot emerging patterns early and refine your marketing tactics based on real-time weekly insights.


 +1
+1
Unify your advertising performance data with Pipedrive lead metrics to measure acquisition effectiveness.
 +1
+1
Monitor customer acquisition dynamics in Salesforce with week-by-week precision. Connect advertising campaign data with lead generation to identify trends quickly and make timely adjustments to your marketing strategy.
 +1
+1
Track your complete customer acquisition journey in Salesforce by connecting advertising data with CRM leads.
+1
Gain granular visibility into your HubSpot acquisition funnel with weekly performance breakdowns. Track advertising effectiveness and lead flow on a weekly cadence to respond faster to market changes and optimize campaigns.
 +1
+1
Connect your advertising investments to HubSpot lead outcomes with a comprehensive monthly funnel view.
+1
about your case. It doesn't cost you a penny.
What data you can export from Facebook Ads?
-
Reports and InsightsThis data category allows you to export insights into your Facebook Ads performance. You'll need to select metrics to include in your report. These include impressions, clicks, click-through rate, cost per click, and more.
-
List of Sponsored LeadsThis data category provides access to leads generated through your Facebook Ads lead forms. It contains details about user submissions, such as contact information (depending on form fields), submission time, and ad or campaign sources. You can use this data to track lead generation performance and integrate it with your CRM or sales workflows.
-
List of Ad creativesWith this data, you can export all ad creatives available in your Facebook Ads account. It includes information such as creative type (image, video, carousel), text, links, and media details. This dataset helps you review and manage the assets you’ve uploaded or created, regardless of whether they are currently being used in ads.
-
List of Ad setsGet an overview of ad sets to track and analyze their efficiency from launch. This data category provides information about ad set statuses, optimization goals, remaining budget, and more.
-
List of CampaignsYou can access information about each of your Facebook Ads campaigns. This view contains data about the status, stop time, objective, budget, and other details of your advertising campaigns.
-
List of AdsWith this data, you can create a detailed overview of all your ads running on the Facebook Ads platform. It contains information about ad status, bid amount, issues, and so on.
-
List of Ads with ad creativesThis data category provides details about ad creatives specifically linked to active or past ads. Unlike the general list of creatives, it only includes the assets actually used in advertisements. You can analyze creative performance together with ad metrics, allowing you to see which images, videos, or texts are driving results.
Use the Facebook Ads connector to turn your data into meaningful reports
What is a Facebook Ads data connector all about?
When the data preparation is done, you can automate data refresh at the desired frequency. The data connector for Facebook Ads lets you do this with a few clicks. You don’t need any coding skills to operate the connector and its features. At the same time, if you have technical expertise, you can use more advanced features offered by Coupler.io, such as webhooks. They will let you trigger events after the data refresh or trigger your importers through external events.


