Connect CSV to Power BI
Сonnect CSV to Power BI with the help of Coupler.io and automate data imports without coding. Quickly collect your data, organize it as you prefer, and transform it in various ways. Enjoy clear, analysis-ready reports filled with actionable insights.


Connect CSV to Power BI with Coupler.io to simplify reporting
Get and prepare data effortlessly
Export CSV to Power BI without difficulty, even if you don't have coding in your skillset. Apply multiple transformations to data, set a custom schedule for automated refreshes, and merge records from different sources within a single Coupler.io web app interface.
Automate reporting tasks
Load data from CSV to Power BI automatically and reduce manual work to a minimum. Spend no more than a few minutes creating your report. Additionally, you can make dynamic dashboards out of your data thanks to our free, ready-to-use templates.
Stand out as a data-driven expert
Build up authority with clients and stakeholders by providing data-powered reports that enable informed decision-making. Entrust Coupler.io to automate data imports and reporting so you can shift your focus toward strategic tasks that truly make a difference.
Export data from CSV to alternative destinations


Quick start with dashboard templates

Multi-channel ad creatives performance dashboard


PPC multi-channel dashboard


 +3
+3

All-in-one marketing dashboard


 +6
+6
No such template is available yet.
No worries. Our team will create a template that fits your needs, just tell us more
about your case. It doesn't cost you a penny 😉
Request a custom report
about your case. It doesn't cost you a penny 😉
Export CSV to Power BI automatically with just a few clicks.
Connect similar Files & Tables apps and get data in minutes


What to export from CSV to Power BI

Marketing data
Connect CSV to Power BI to examine your marketing metrics, such as impressions, clicks, conversions, and engagement rates. This data unveils the performance of your marketing campaigns, revealing how well they resonate with the target audience and impact ROI. Use it to refine strategies and allocate resources better.
Advertising data
Another reason to export CSV to Power BI is advertising data, which you can leverage to analyze the effectiveness of your ad groups and individual ads as well as optimize targeting and bidding strategies. Identify which ads perform exceptionally well and which ones are underperforming to improve your creatives and messaging.
Social media data
Import social media data from CSV to Power BI to explore demographic and geographic insights such as age, gender, and location for your campaigns. Based on information about your audience's preferences and behaviors, you can customize content and messaging to specific segments and, therefore, maximize engagement and impact.
E-commerce data
Evaluate the performance of your e-commerce activities, including sales, revenue, customer acquisition costs, and product performance. This analysis enables you to optimize your product offerings, pricing strategies, and marketing campaigns to drive revenue growth and enhance the overall shopping experience for customers.
SEO data
Monitor keyword performance and search term effectiveness to optimize your SEO strategies and increase website visibility. By adjusting your keyword targeting and content, you can drive organic traffic and improve search engine rankings. This data-driven approach ensures that your website remains competitive in search.
Finance data
Access metrics such as revenue, expenses, profit margins, and cash flow to track the financial health of your business. Identify trends and patterns in this data to support strategic decision-making, whether you aim to manage expenses better, improve profitability, allocate resources more effectively, or achieve other financial goals.
Sales data
Track sales performance: revenue, conversion rates, customer acquisition costs, and sales pipeline dynamics. By doing so, you can spot opportunities and challenges in your sales process. This kind of data is helpful in your business efforts, such as identifying high-value leads, optimizing the sales funnel, or improving conversion rates.
CRM data
Dive deep into customer interactions, preferences, and behaviors to make the most of customer relationship management. This way, you can gain a firm understanding of customer acquisition, retention, and satisfaction metrics. It empowers you to channel marketing and sales efforts in the right direction to meet customer expectations better.
How do you connect CSV to Power BI?
Step 1. Specify CSV as the data source and paste the link to your CSV file
Step 2. Organize and transform data before loading it into Power BI
Step 3. Connect your Power BI account and copy the integration URL to the desktop app
Step 4. Schedule automated refreshes to export CSV to Power BI at desired intervals
Pricing plans
- Monthly
- Annual (save 25%)
Your data is secured by industry standards
 Google Cloud
Certified
 SOC 2 Type II
Certified
 GDPR
GDPRCompliant
 HIPAA
HIPAACompliant
Don’t just take our word for it


How to connect CSV to Power BI (detailed guide)
To connect CSV to Power BI and further import data, take the steps outlined below:
Step 1: Collect data
First, provide the link to the CSV file from where you'd like to export data. Then, you can adjust the optional settings. For example, you'll be offered the option to choose particular columns to load, skip a specific number of rows from the top of the document, etc.
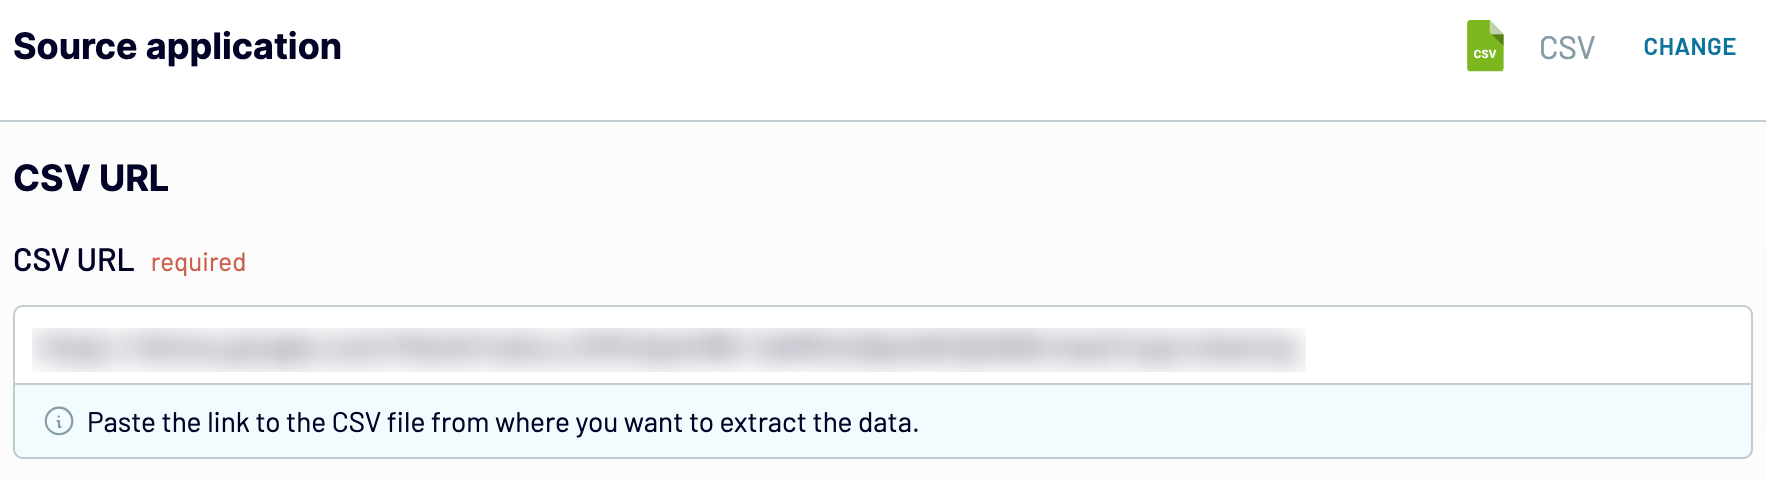
Once you've set up the source, proceed to the next step.
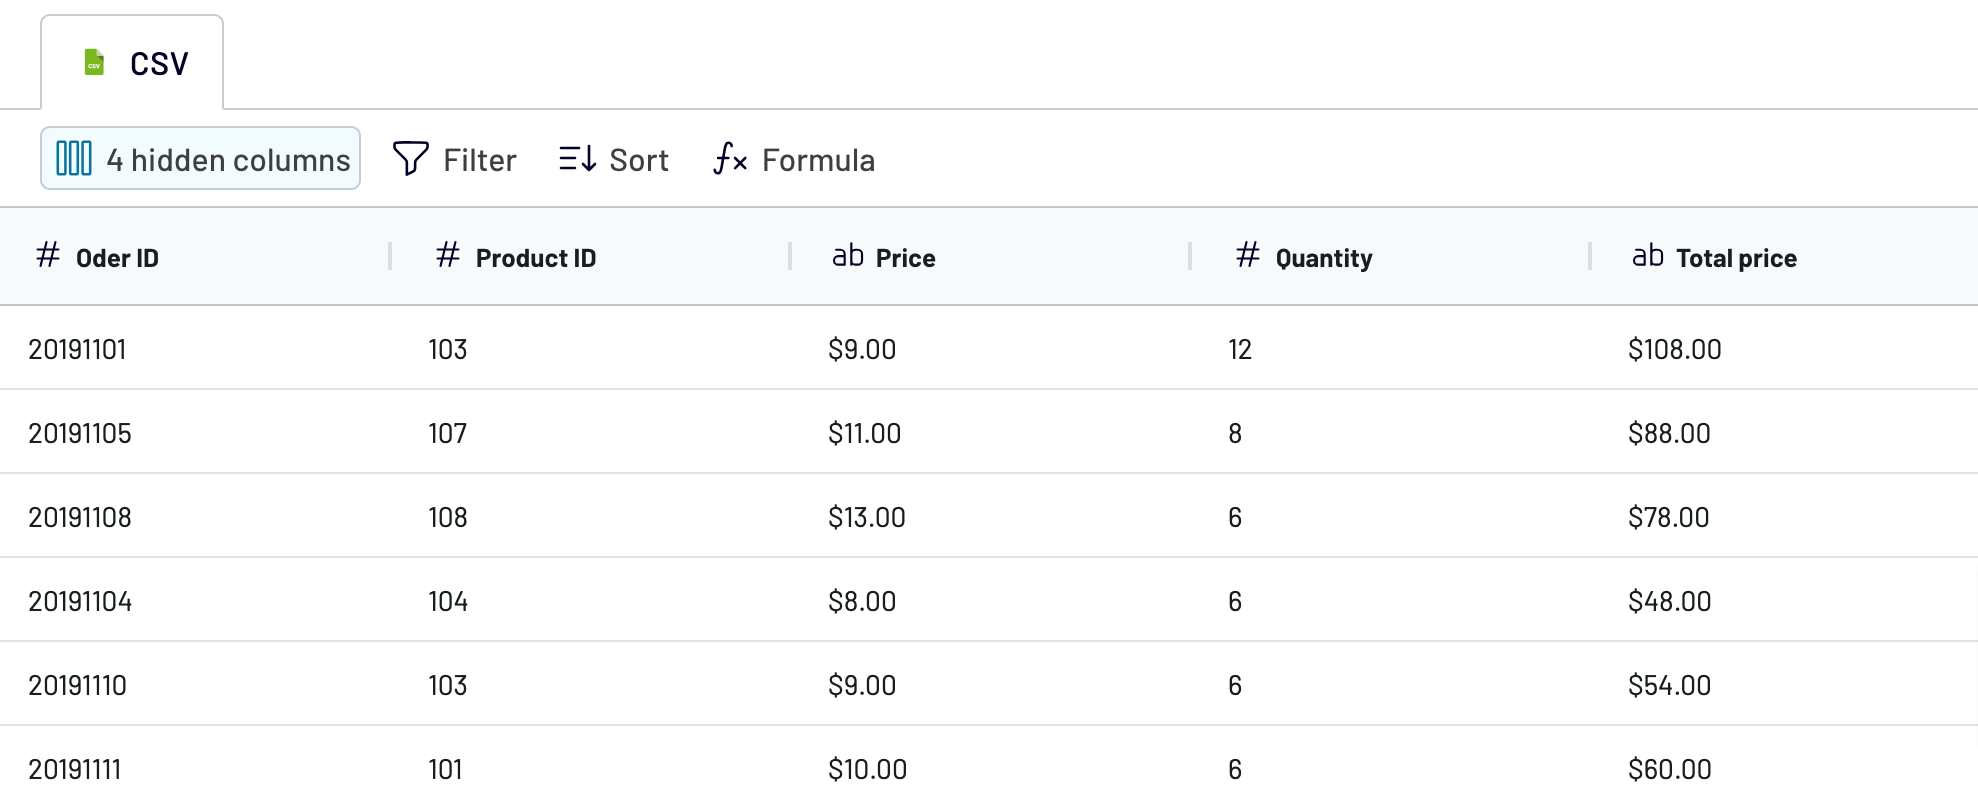
Step 2: Organize and transform
Before importing CSV to Power BI, you can preview data to ensure its accuracy and compliance with your analytics needs. There are a number of transformations you can apply to your data if needed:
This lets you organize your data to avoid any similar actions in the destination and start analyzing data right after importing.
As soon as your data looks like you'd prefer, go to the destination settings.
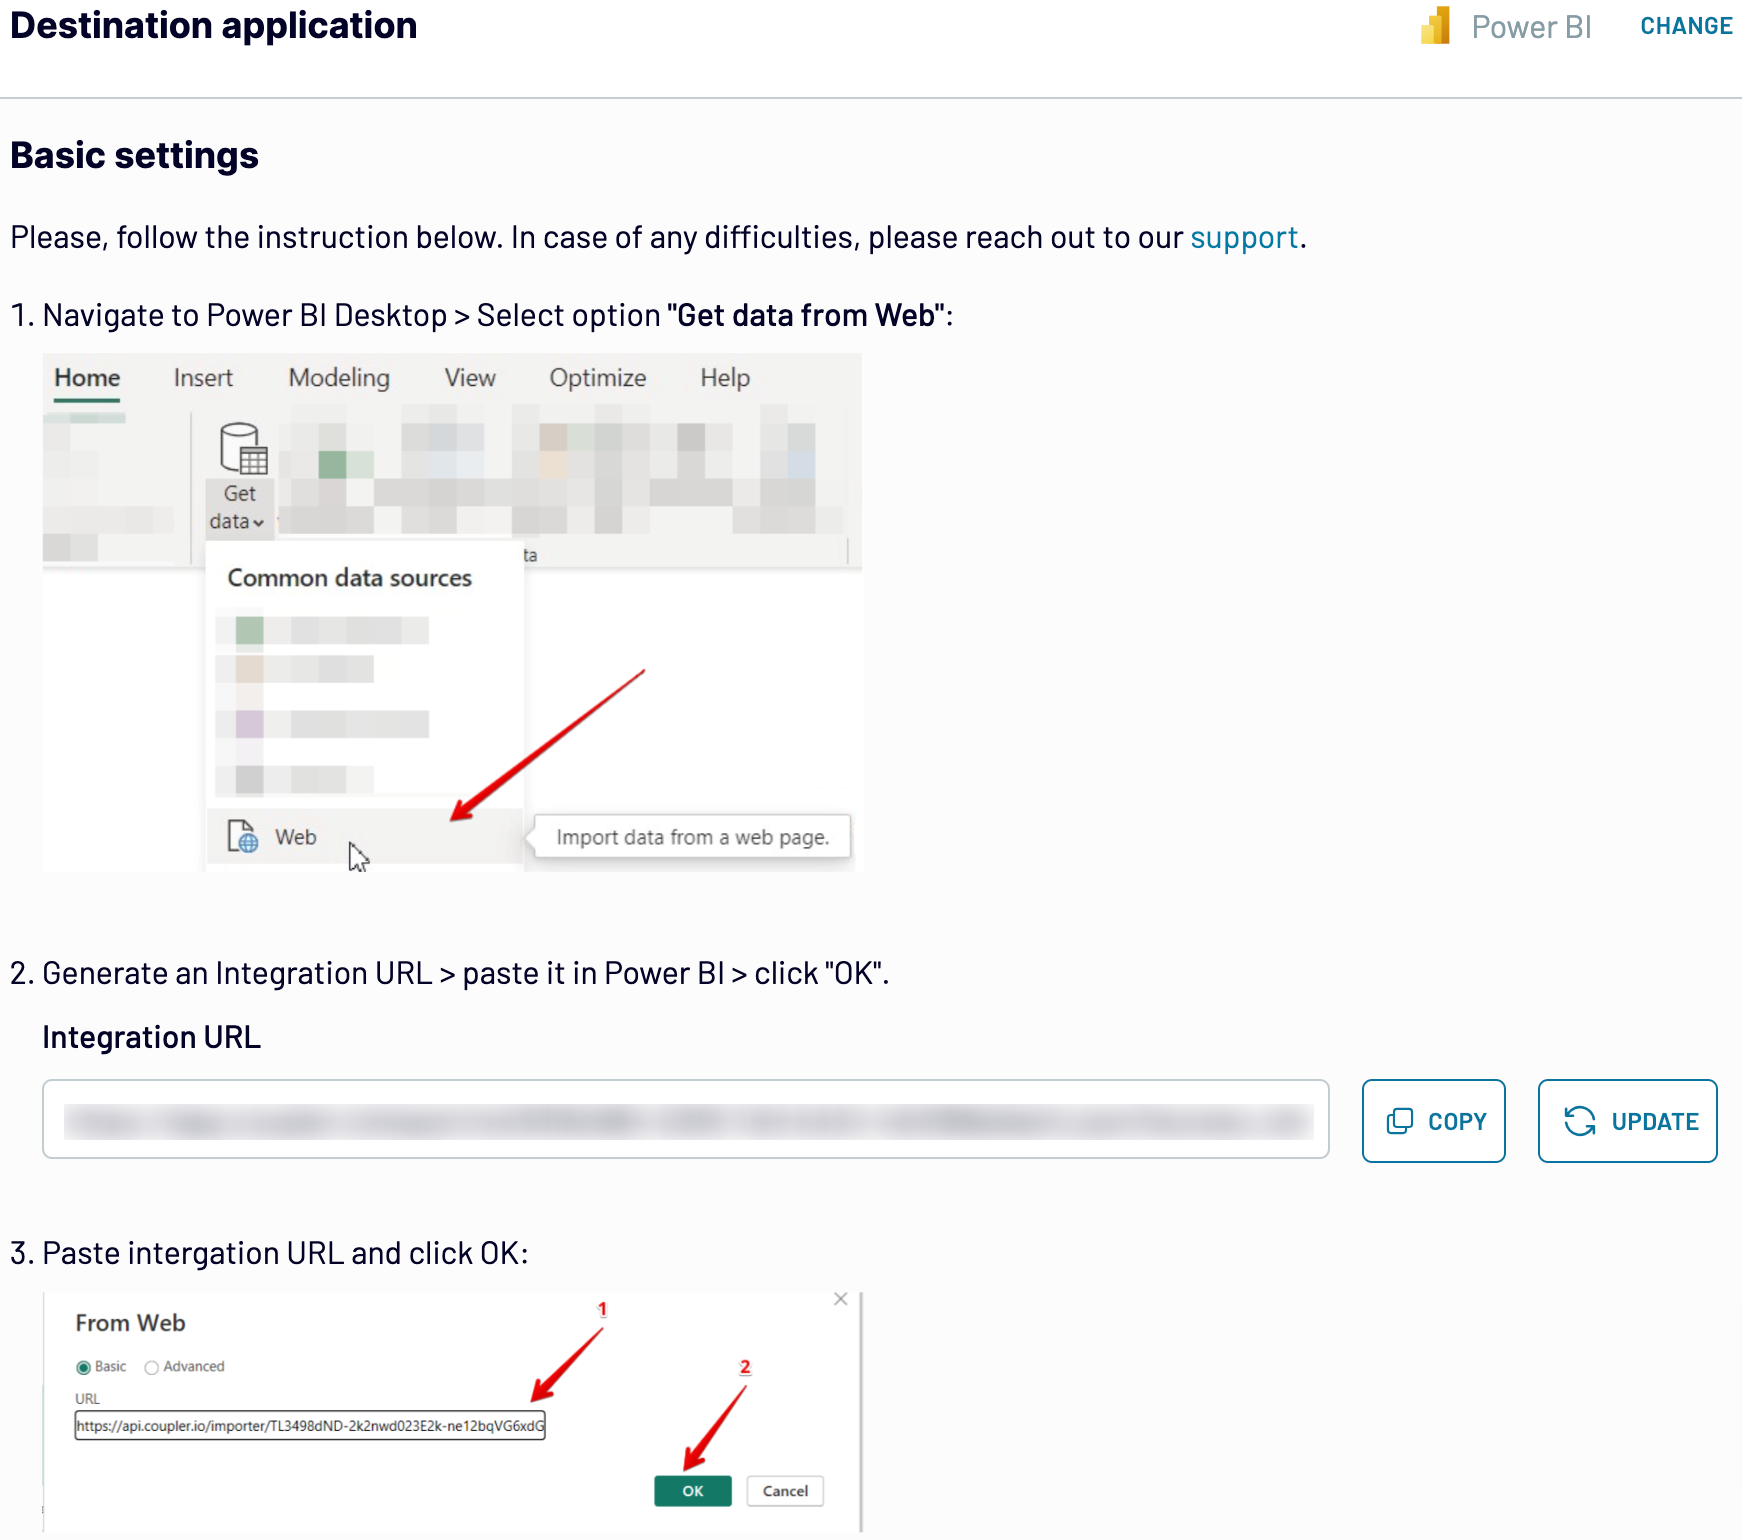
Step 3: Load and automate
To finally import your data from CSV to Power BI, follow the in-app instructions to do the following:
Next, toggle on automated data refreshes and set up a schedule. To complete the process, save and run the importer.
Step 1: Collect data
First, provide the link to the CSV file from where you'd like to export data. Then, you can adjust the optional settings. For example, you'll be offered the option to choose particular columns to load, skip a specific number of rows from the top of the document, etc.
Once you've set up the source, proceed to the next step.
Step 2: Organize and transform
Before importing CSV to Power BI, you can preview data to ensure its accuracy and compliance with your analytics needs. There are a number of transformations you can apply to your data if needed:
- Edit, rearrange, hide, or add columns.
- Apply various filters and sort your data.
- Create new columns with custom formulas.
- Combine data from multiple accounts or apps.
This lets you organize your data to avoid any similar actions in the destination and start analyzing data right after importing.
As soon as your data looks like you'd prefer, go to the destination settings.
Step 3: Load and automate
To finally import your data from CSV to Power BI, follow the in-app instructions to do the following:
- Generate the integration URL.
- Paste it into the Power BI desktop app.
Next, toggle on automated data refreshes and set up a schedule. To complete the process, save and run the importer.
Export CSV to Power BI and automate it on schedule
Activate automated data refreshes to make sure your report reflects the latest changes from the source. Specify the refresh frequency you're comfortable with, choosing from monthly, daily, hourly, or even intervals as brief as every 30 or 15 minutes.
You can customize this schedule even more by specifying preferred days of the week, the time slot, and the time zone.
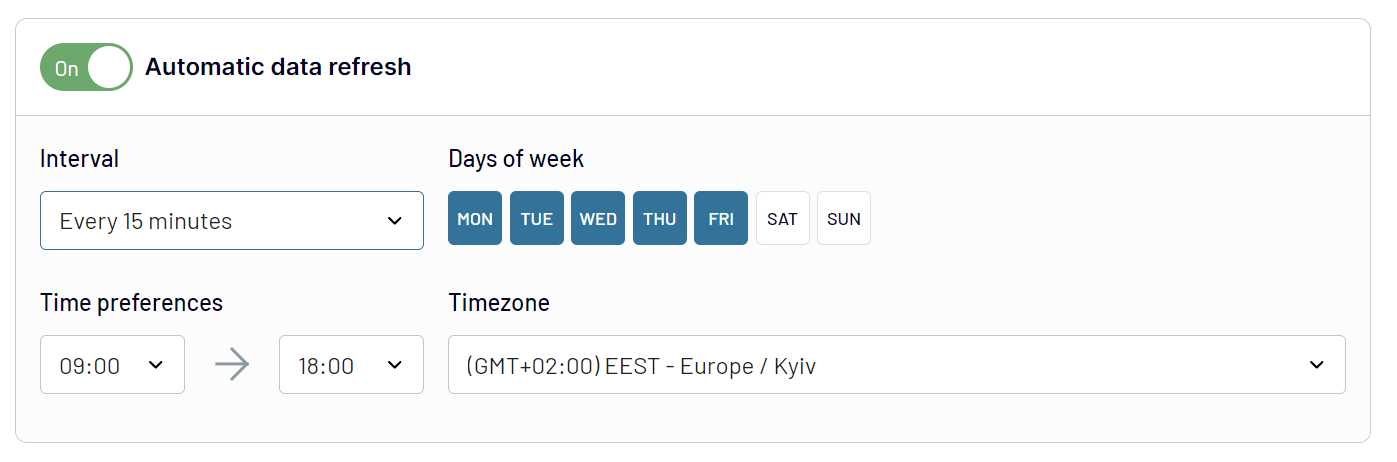
Thanks to this Coupler.io feature, your report will continuously deliver the most recent data.
You can customize this schedule even more by specifying preferred days of the week, the time slot, and the time zone.
Thanks to this Coupler.io feature, your report will continuously deliver the most recent data.
Replace or append the data you export from CSV to Power BI
Coupler.io doesn't just allow you to pull data from CSV files. It also makes it possible to load related records from different apps. You just have to connect the required application by clicking on the corresponding button while setting up the initial source.
Following that, you'll have to complete the process, which is much the same as described previously. You can connect not only multiple apps but also different accounts within the same application.
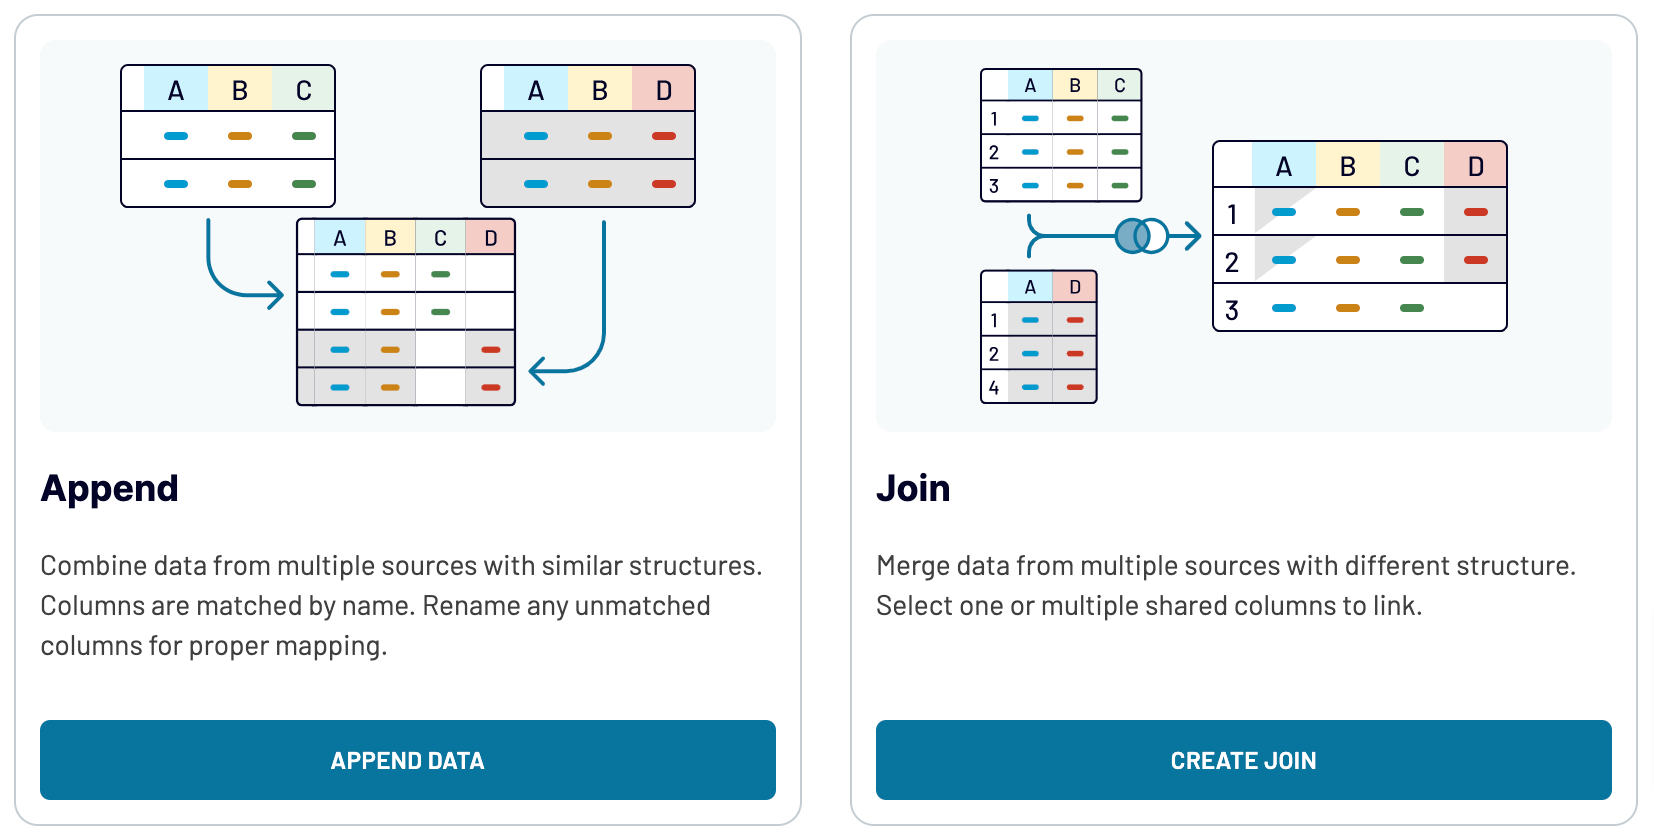
You can also take advantage of cross-platform data blending. Once you've linked all sources and proceeded to the next step, you'll be presented with two options to merge your data:
If you integrate various data sources, you'll broaden the scope of analytics and get a more thorough grasp of your data.
Following that, you'll have to complete the process, which is much the same as described previously. You can connect not only multiple apps but also different accounts within the same application.
You can also take advantage of cross-platform data blending. Once you've linked all sources and proceeded to the next step, you'll be presented with two options to merge your data:
- Append: Combine elements from one source into another. This method requires identical column names.
- Join: Put datasets side by side. You need at least one column with the same name.
If you integrate various data sources, you'll broaden the scope of analytics and get a more thorough grasp of your data.
Export CSV to Power BI or another destination
Coupler.io doesn't only offer to connect CSV to Power BI but also replicate importers to transfer your data to other apps:
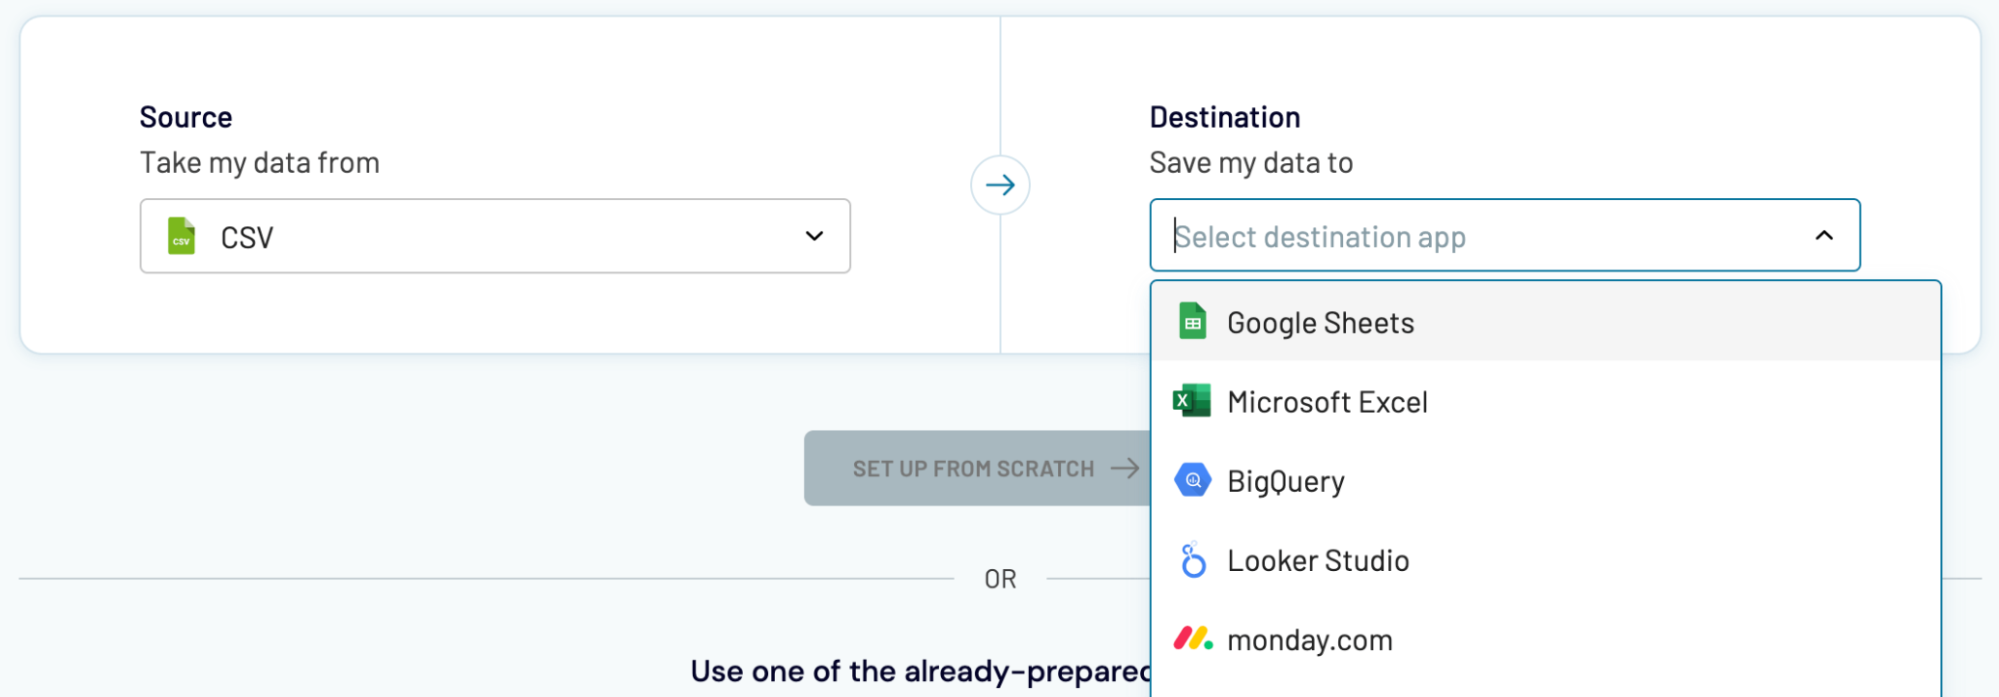
Data imports from CSV into Power BI, which we've previously explained, don't differ much from transfers into alternative destinations.
- Spreadsheet applications: Microsoft Excel and Google Sheets.
- Data warehouses: BigQuery, PostgreSQL, and Redshift.
- Other business intelligence (BI) tools: Looker Studio, Tableau, and Qlik Sense.
Data imports from CSV into Power BI, which we've previously explained, don't differ much from transfers into alternative destinations.