Trusted by 1M+ users worldwide
How to connect Instagram Ads and Tableau
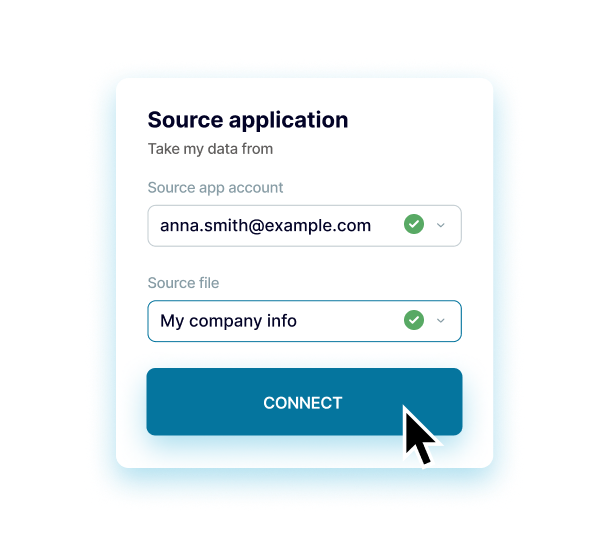
Connect Instagram Ads and configure the parameters
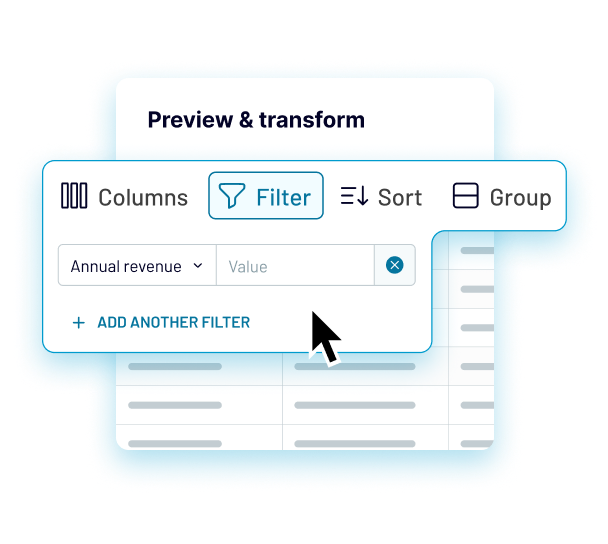
Preview, transform & filter data
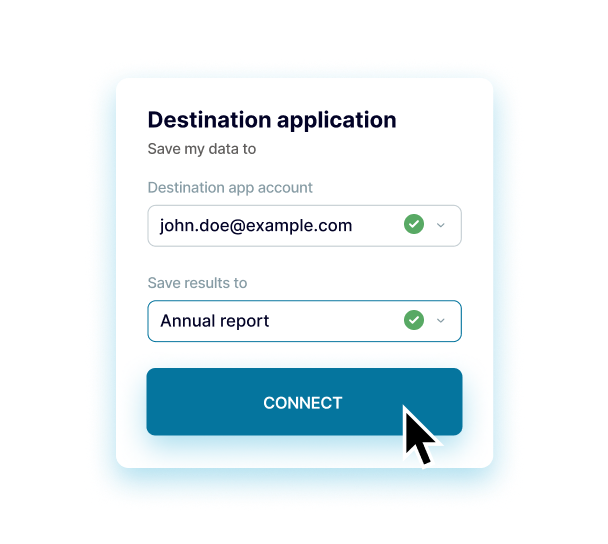
Setup Tableau and configure the parameters
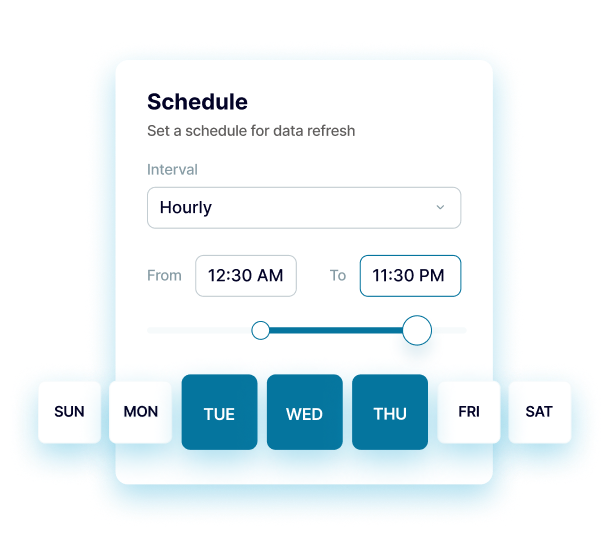
Set a schedule for data refreshes
Coupler.io made it easy to create dashboards and reports from different data sources. The sync is reliable and the user experience is amazing.
Take your data analytics to the next level
 Sign Up with Google
 Sign Up with MICROSOFT
 SIGN UP WITH EMAIL
By signing up to Coupler.io, you agree to our Privacy Policy and Terms of Use.
Connect Instagram Ads to Tableau using Coupler.io
Enjoy a seamless and efficient solution to integrate Instagram Ads and Google Sheets in just a few simple steps with zero technical skills required. Automate your reporting and analytical dataflows using Coupler.io: collect, merge, preview, transform, and filter data from Instagram Ads before loading it to Google Sheets. Set your schedule for the automatic data refresh, ranging from a monthly interval to as frequent as every 15 minutes.
Get a one-stop solution to make data-driven decisions and drive the business forward. Use the out-of-the-box expert service to amplify your data analytics and workflow automation. Build bespoke data analytics dashboards to track your business metrics and see the holistic picture of your business.


Build your Instagram Ads integrations with these destinations
Other integrations you can benefit from
All sources
-
ActiveCampaign
-
Airtable
-
Amazon Ads
-
Amplitude
-
Apple Search Ads
-
Asana
-
BigQuery
-
Bing Ads
-
Braze
-
Calendly
-
CallRail
-
Campaign Monitor
-
Chargebee
-
Chartmogul
-
ClickUp
-
Clockify
-
Confluence
-
CSV
-
Delighted
-
Dropbox
-
Facebook Ads
-
Facebook Page Insights
-
Facebook Public Data
-
Freshservice
-
GoHighLevel
-
Google Ads
-
Google Analytics 4
-
Google Business Profile
-
Google Calendar
-
Google Drive
-
Google PageSpeed Insights
-
Google Search Console
-
Google Sheets
-
Harvest
-
HubSpot
-
Instagram Ads
-
Instagram Insights
-
Instagram Public Data
-
Intercom
-
Jira
-
JSON
-
Klaviyo
-
Lemlist
-
LinkedIn Ads
-
LinkedIn Company Pages
-
Mailchimp
-
MailerLite
-
Microsoft Excel
-
MySQL
-
Omnisend
-
OneDrive
-
Pinterest Ads
-
Pipedrive
-
Piwik Pro
-
Plausible
-
PostgreSQL
-
QuickBooks
-
Quora Ads
-
Recurly
-
Redshift
-
Reply.io
-
Salesforce
-
Sendgrid
-
Shopify
-
Slack
-
Snapchat Ads
-
Stripe
-
Tableau
-
TikTok Ads
-
TikTok Organic
-
TimeTonic
-
Trello
-
Typeform
-
Vimeo Public Data
-
WooCommerce
-
Wordpress
-
X (Twitter) Ads
-
Xero
-
Yahoo Finance Price
-
YouTube
Early access sources
-
100ms
-
7shifts
-
AgileCRM
-
Aircall
-
Apify Dataset
-
Appcues
-
Appfigures
-
Appfollow
-
Apptivo
-
Ashby
-
AWIN Advertiser
-
BambooHR
-
BigMailer
-
Bitly
-
BlueTally
-
Breezy HR
-
Brevo
-
Brex
-
Bunny, Inc.
-
Cal.com
-
Campayn
-
Canny
-
Capsule CRM
-
Captain Data
-
Chameleon
-
Chargedesk
-
Chargify
-
Cin7
-
Clockodo
-
Close.com
-
Cloudbeds
-
Coassemble
-
Coda
-
Coin API
-
CoinGecko Coins
-
CoinMarketCap
-
Copper
-
Customer.io
-
Customerly
-
Datadog
-
Deputy
-
Drip
-
e-conomic
-
Easypost
-
Easypromos
-
Elasticemail
-
EmailOctopus
-
Encharge
-
Eventbrite
-
Eventee
-
Eventzilla
-
Everhour
-
Exchange Rates Api
-
EZOfficeInventory
-
Factorial
-
Fastbill
-
Fillout
-
Finage
-
Financial Modelling
-
Finnhub
-
Finnworlds
-
Fleetio
-
Flexmail
-
Flexport
-
float
-
Flowlu
-
Formbricks
-
Freshchat
-
Freshdesk
-
Freshsales
-
Front
-
Fulcrum
-
Fullstory
-
Gainsight Px
-
GetGist
-
GitBook
-
GoCardless
-
Gong
-
Gorgias
-
Guru
-
Height
-
Hellobaton
-
Hub Planner
-
Humanitix
-
Huntr
-
Inflowinventory
-
Insightful
-
Insightly
-
Invoiced
-
Invoiceninja
-
JobNimbus
-
Jotform
-
JustCall
-
Katana
-
Lago
-
Lightspeed Retail
-
Lob
-
luma
-
MailerSend
-
Mailgun
-
Mailjet Mail
-
Mailjet SMS
-
Merge
-
Missive
-
MixMax
-
Mode
-
Mux
-
n8n
-
Nexiopay
-
NoCRM
-
Nutshell
-
Nylas
-
OnceHub
-
OnePageCRM
-
Opinion Stage
-
OPUSWatch
-
Oura
-
Pabbly
-
Paddle
-
PandaDoc
-
Paperform
-
Partnerize
-
PartnerStack
-
PayFit
-
Paystack
-
Pendo
-
Pennylane
-
PersistIq
-
Phyllo
-
Picqer
-
Pipeliner
-
Plaid
-
Planhat
-
Polygon Stock API
-
PostHog
-
Postmark App
-
PrestaShop
-
Pretix
-
Printify
-
Productboard
-
Productive
-
Recreation
-
Recruitee
-
referralhero
-
RentCast
-
Repairshopr
-
RevenueCat
-
Revolut Merchant
-
Ringcentral
-
Rocket.chat
-
Rocketlane
-
Ruddr
-
Sage HR
-
Salesflare
-
Salesloft
-
SavvyCal
-
Segment
-
Sendinblue
-
Sendowl
-
Serpstat
-
Shippo
-
ShipStation
-
ShopWired
-
Shortcut
-
Shortio
-
SimFin
-
SimpleCast
-
Simplesat
-
Smaily
-
SmartEngage
-
Smartreach
-
SparkPost
-
SpotlerCRM
-
Square
-
SurveySparrow
-
Survicate
-
Systeme
-
Taboola
-
Tavus
-
Teamtailor
-
Teamwork
-
Tempo
-
Testrail
-
Thinkific
-
Thinkific Courses
-
Thrive Learning
-
Ticketmaster
-
TicketTailor
-
Tinyemail
-
Todoist
-
Toggl
-
Trustpilot
-
Twilio TaskRouter
-
Ubidots
-
UpPromote
-
Uservoice
-
Visma Economic
-
Vitally
-
VWO
-
When I Work
-
Workable
-
Wrike
-
You Need A Budget (YNAB)
-
Younium
-
Zoom
Get the most of Instagram Ads to Tableau integration
Gather data
Export data from numerous apps and sources into a single destination. Blend data from different apps to get a single source of truth.
Understand data
Preview, transform, sort, and filter data for better clarity in just a few clicks in the Coupler.io interface. Take your data analytics to the next level.
Automate data
Access data that is always up to date by enabling the automatic data refresh on a schedule as often as every 15 minutes and using triggered automation.
Act on data
Visualize your data by quickly connecting to data visualization and BI tools. Build insightful dashboards in a breeze and make better decisions.


