Shopify sales funnel dashboard template for Looker Studio
Track and analyze your Shopify sales funnel with the [Looker Studio] dashboard template, built based on Google Analytics data from your store. Designed to visualize your sales data easily, use the provided steps to duplicate the template and link it to your Google Analytics 4 accounts.


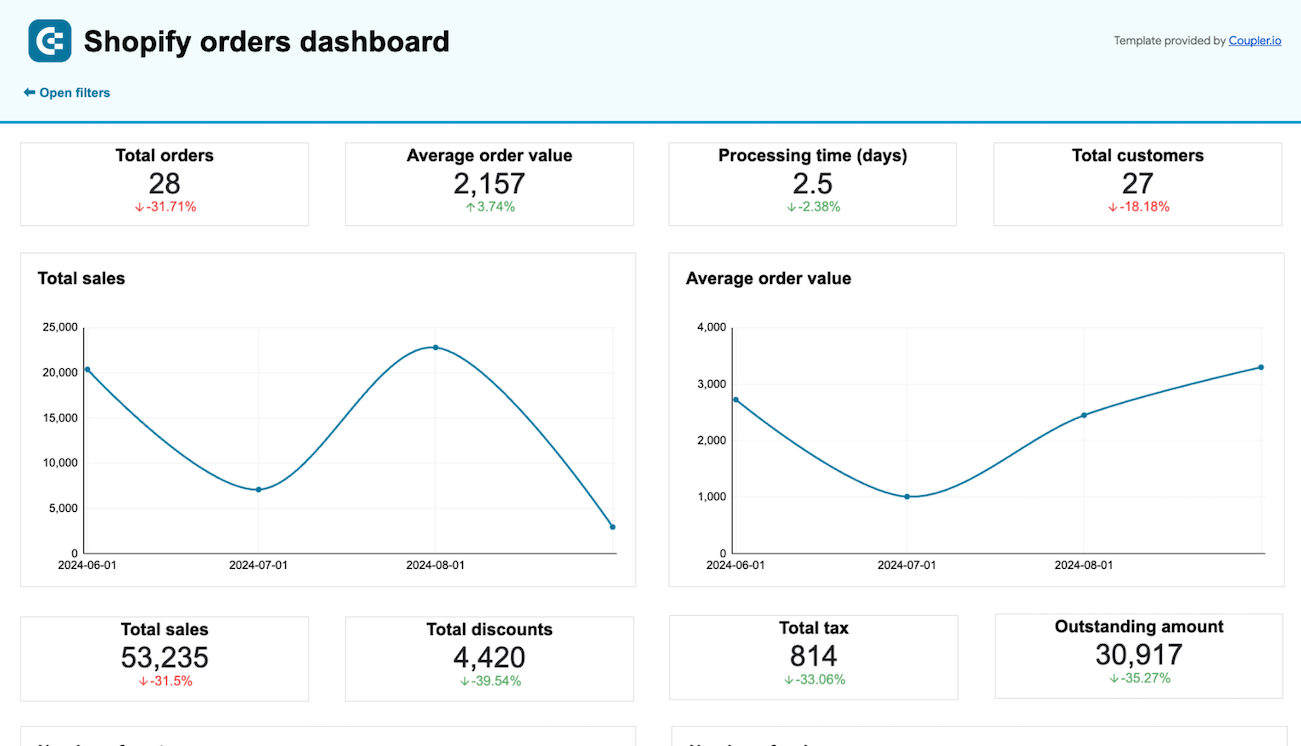
Quick overview of the Shopify sales funnel dashboard
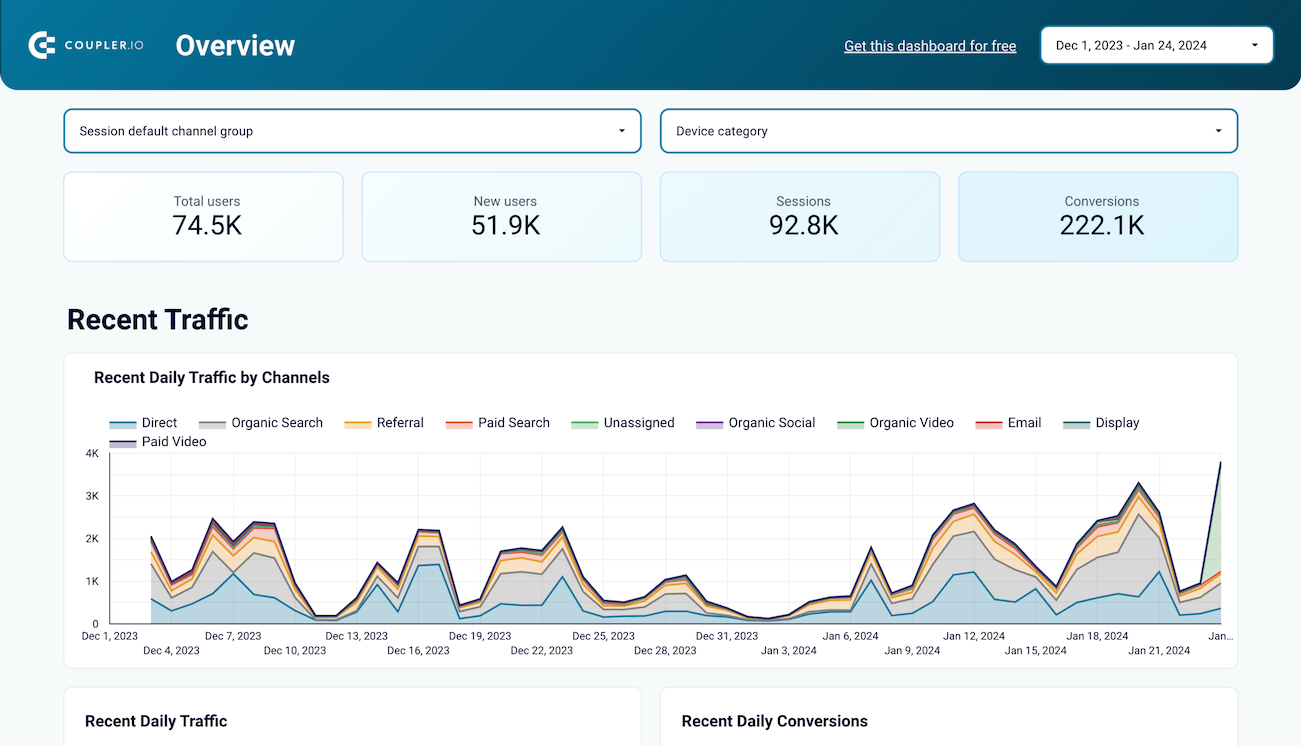
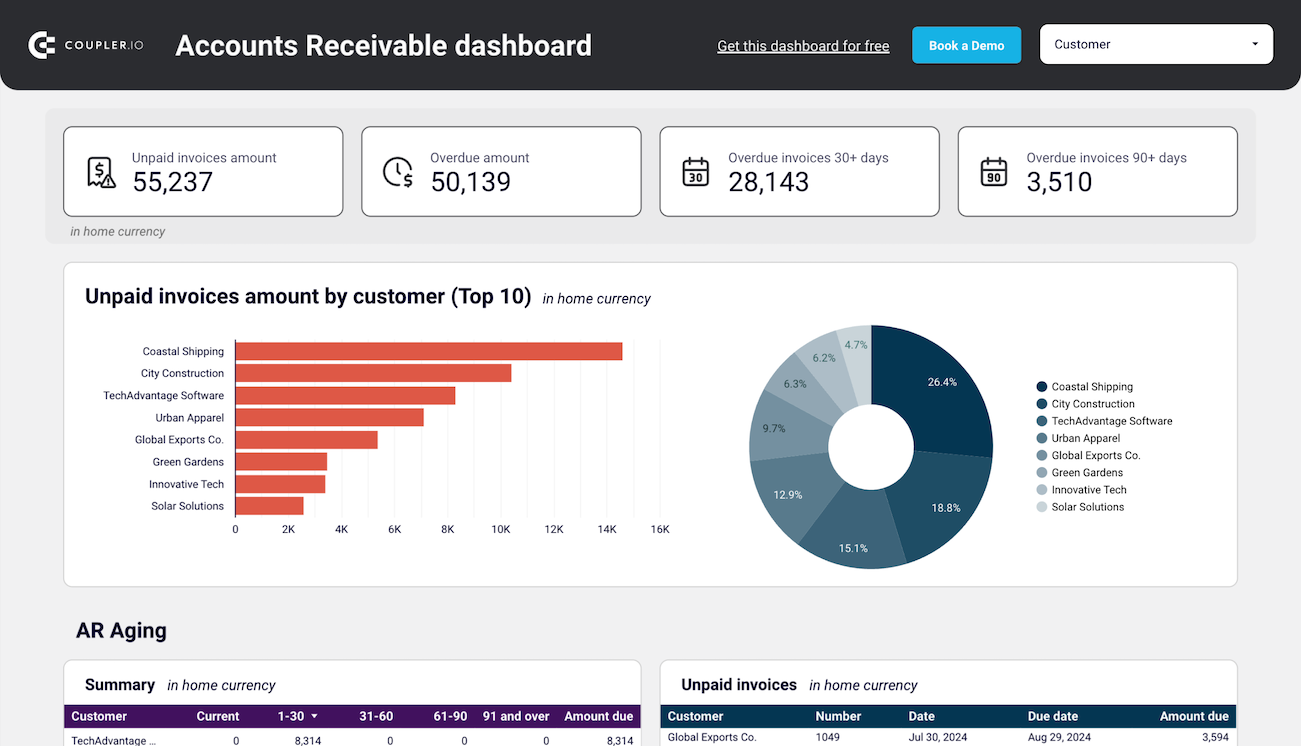
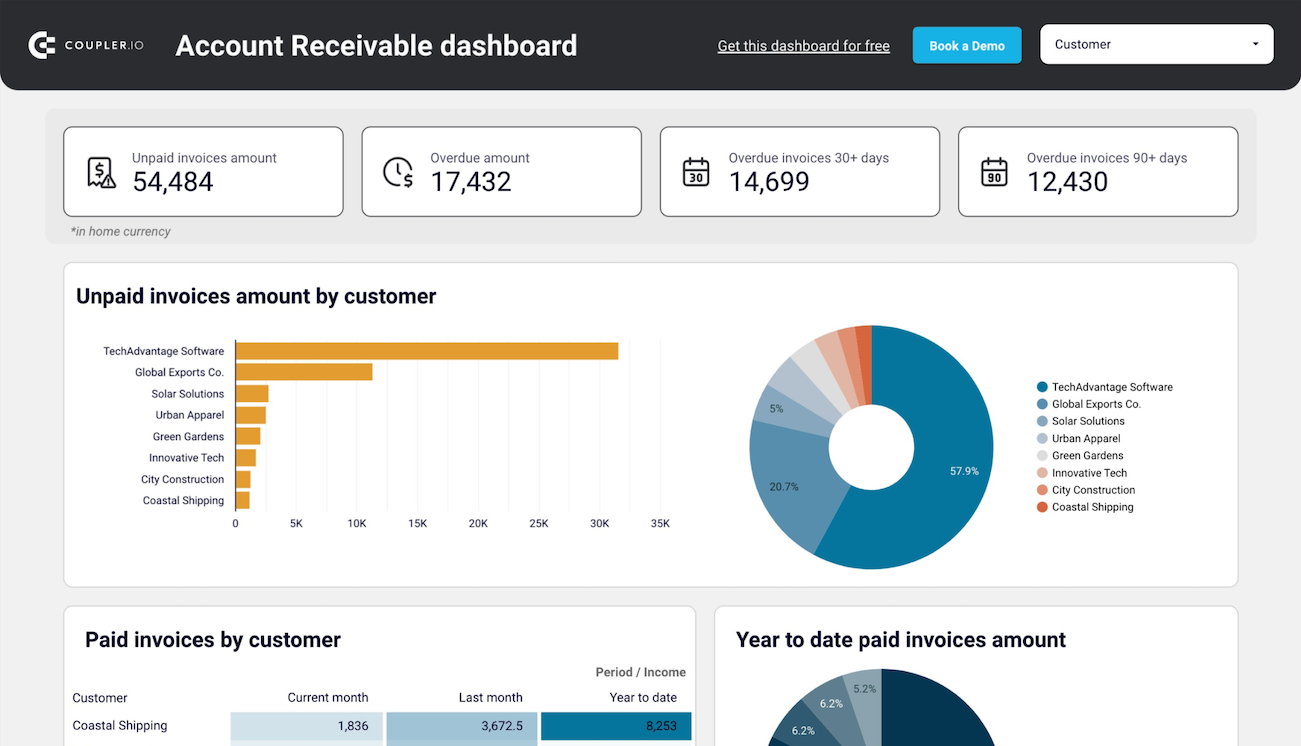
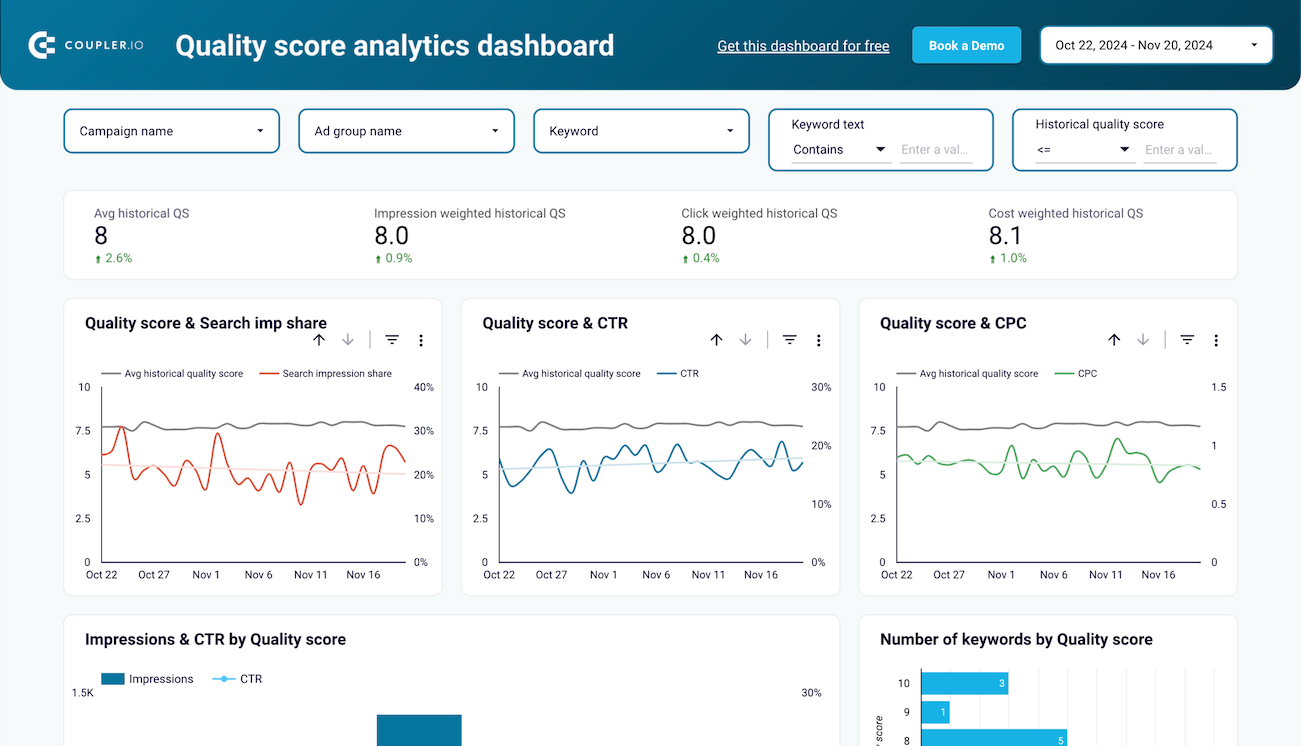
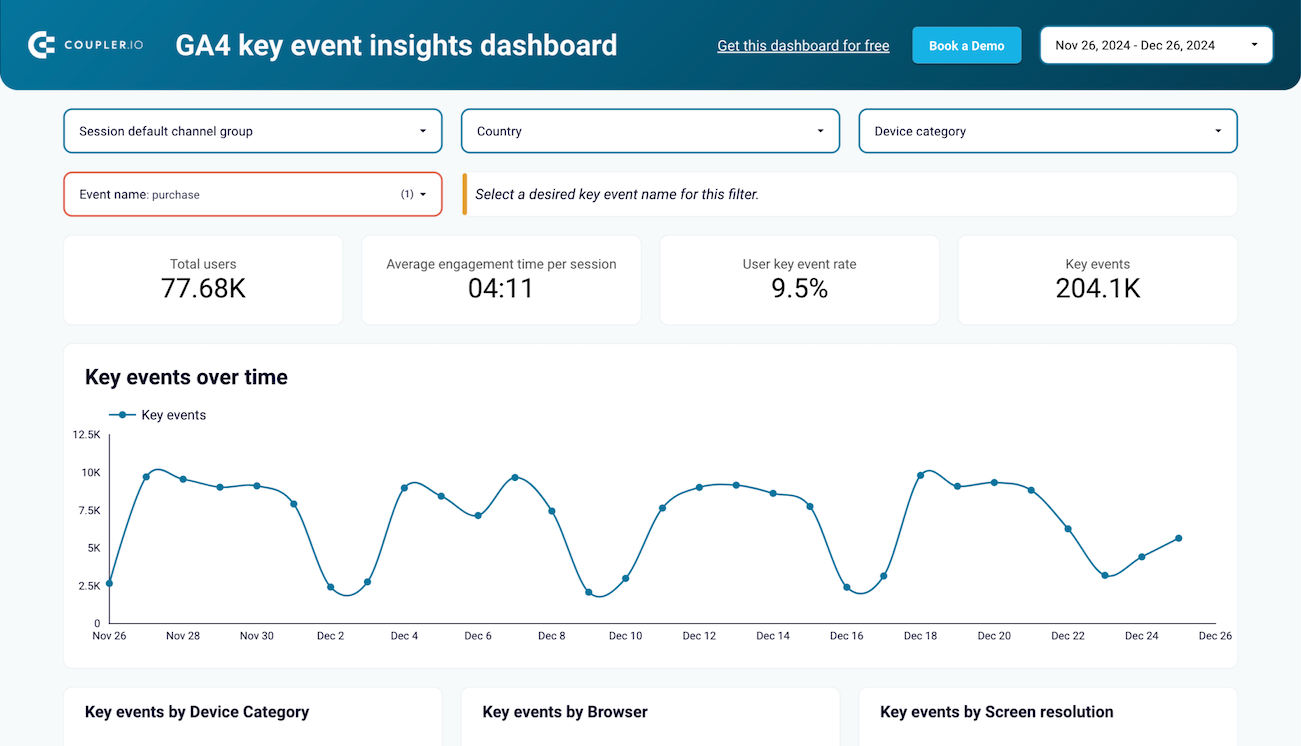
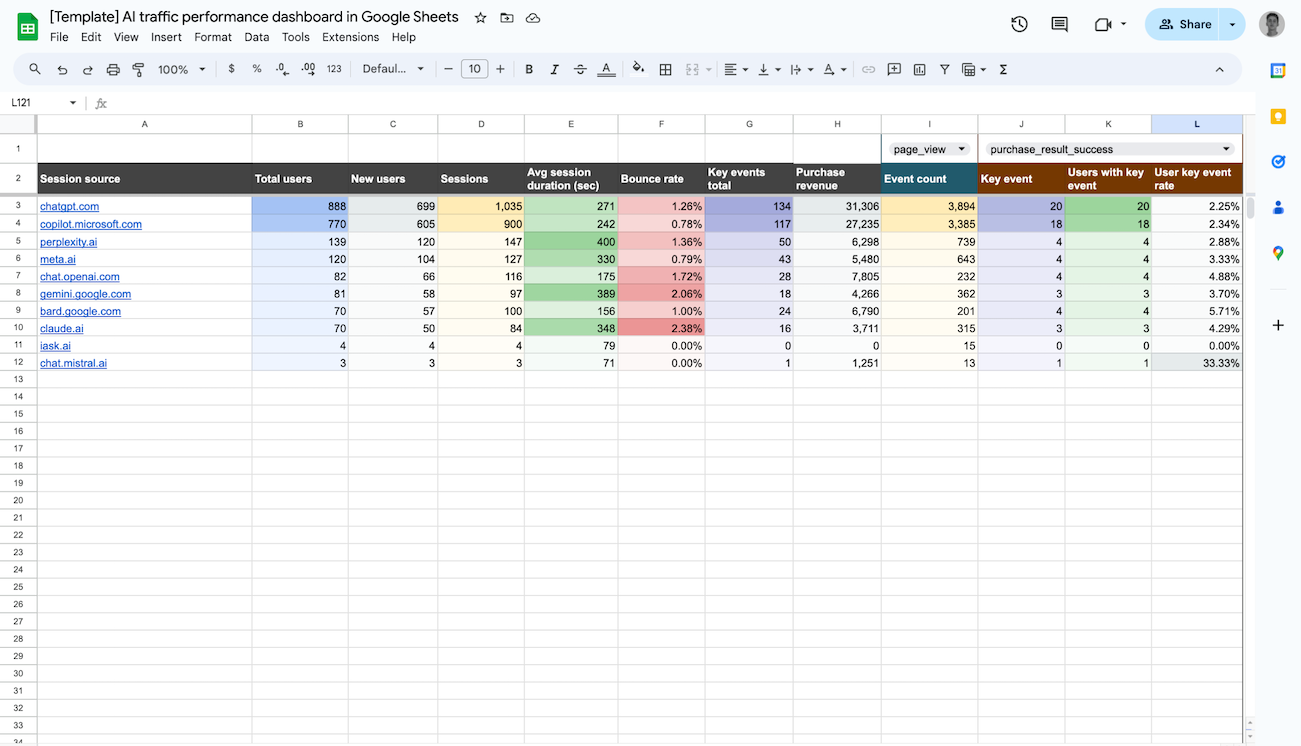
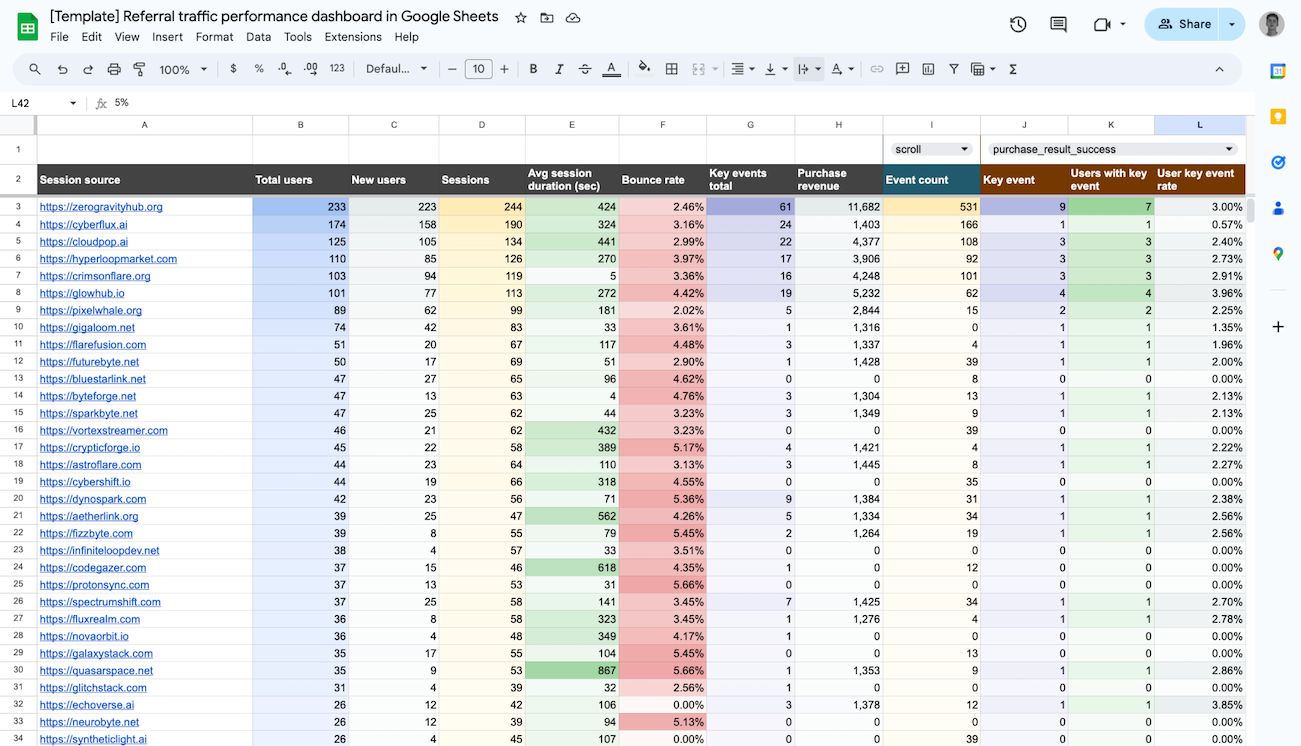
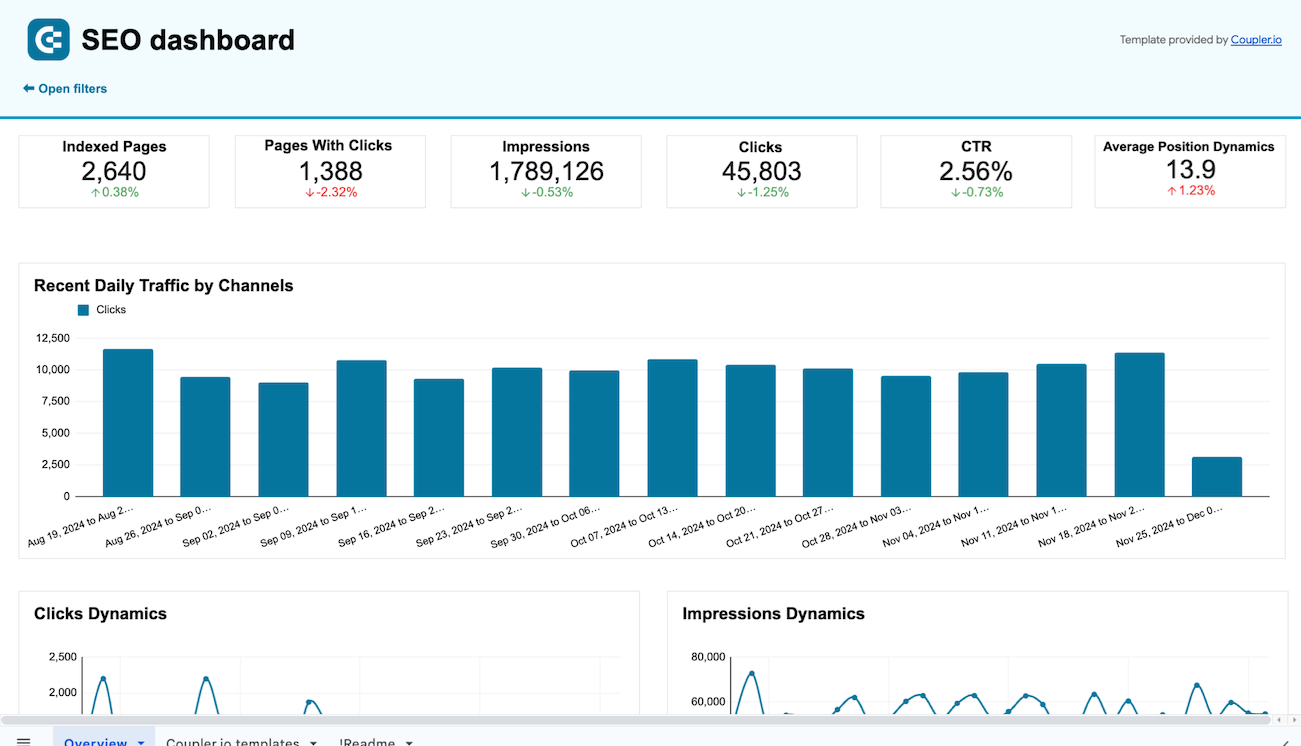
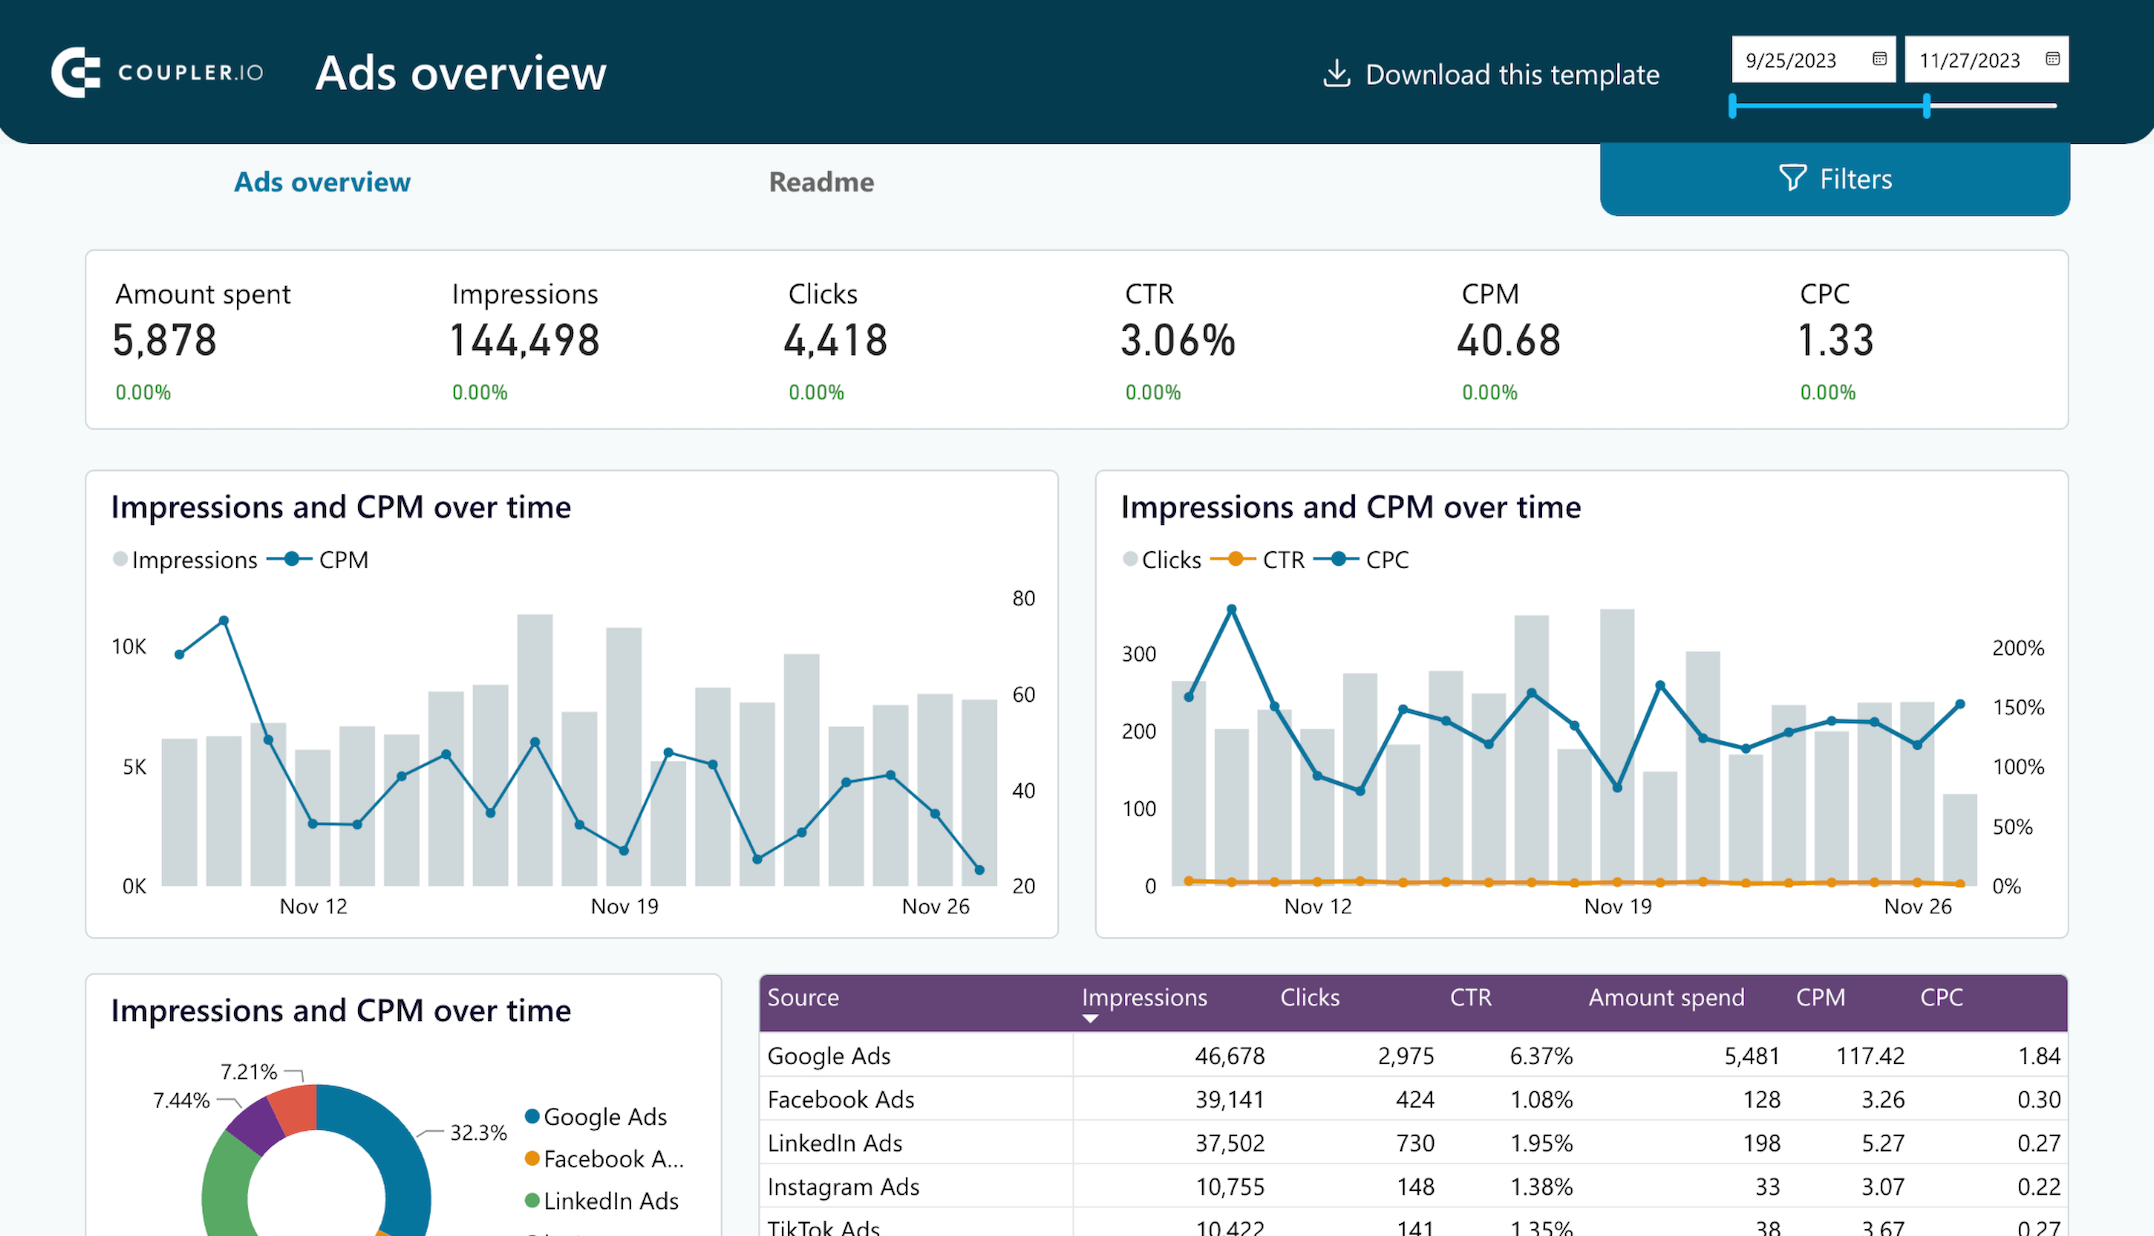
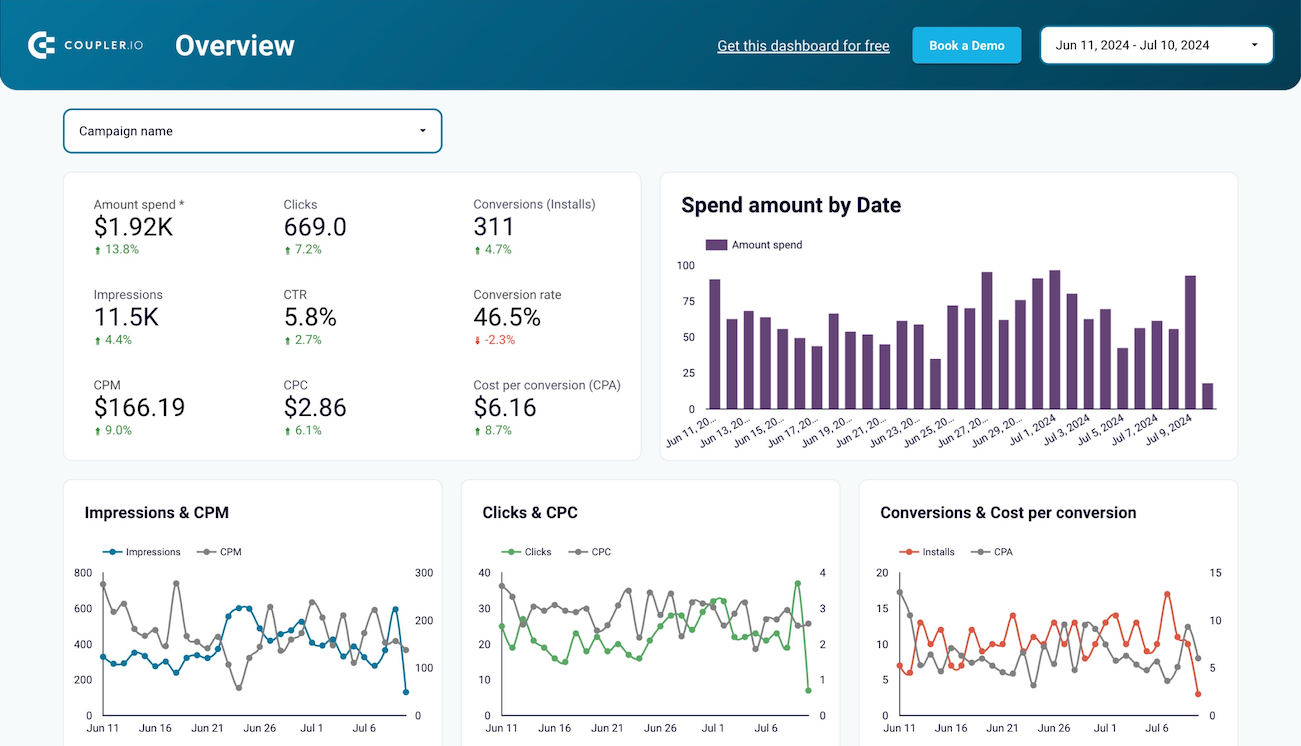
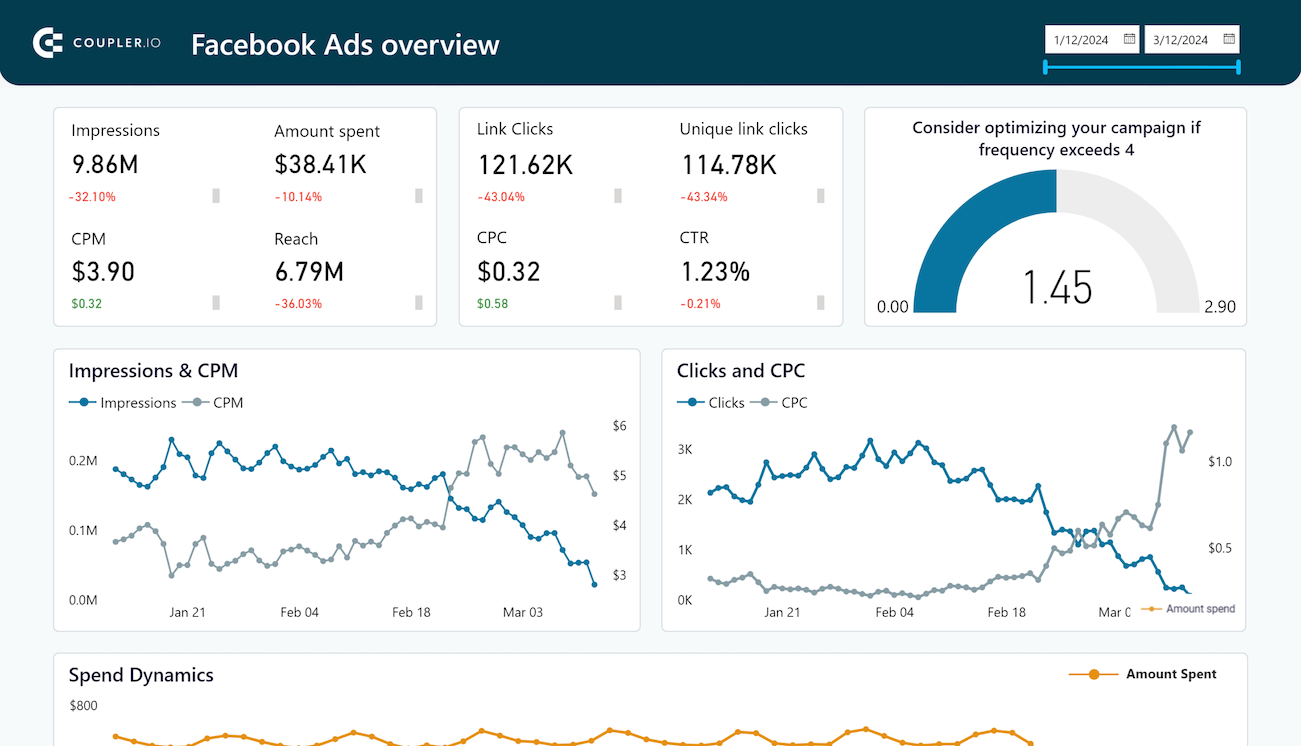
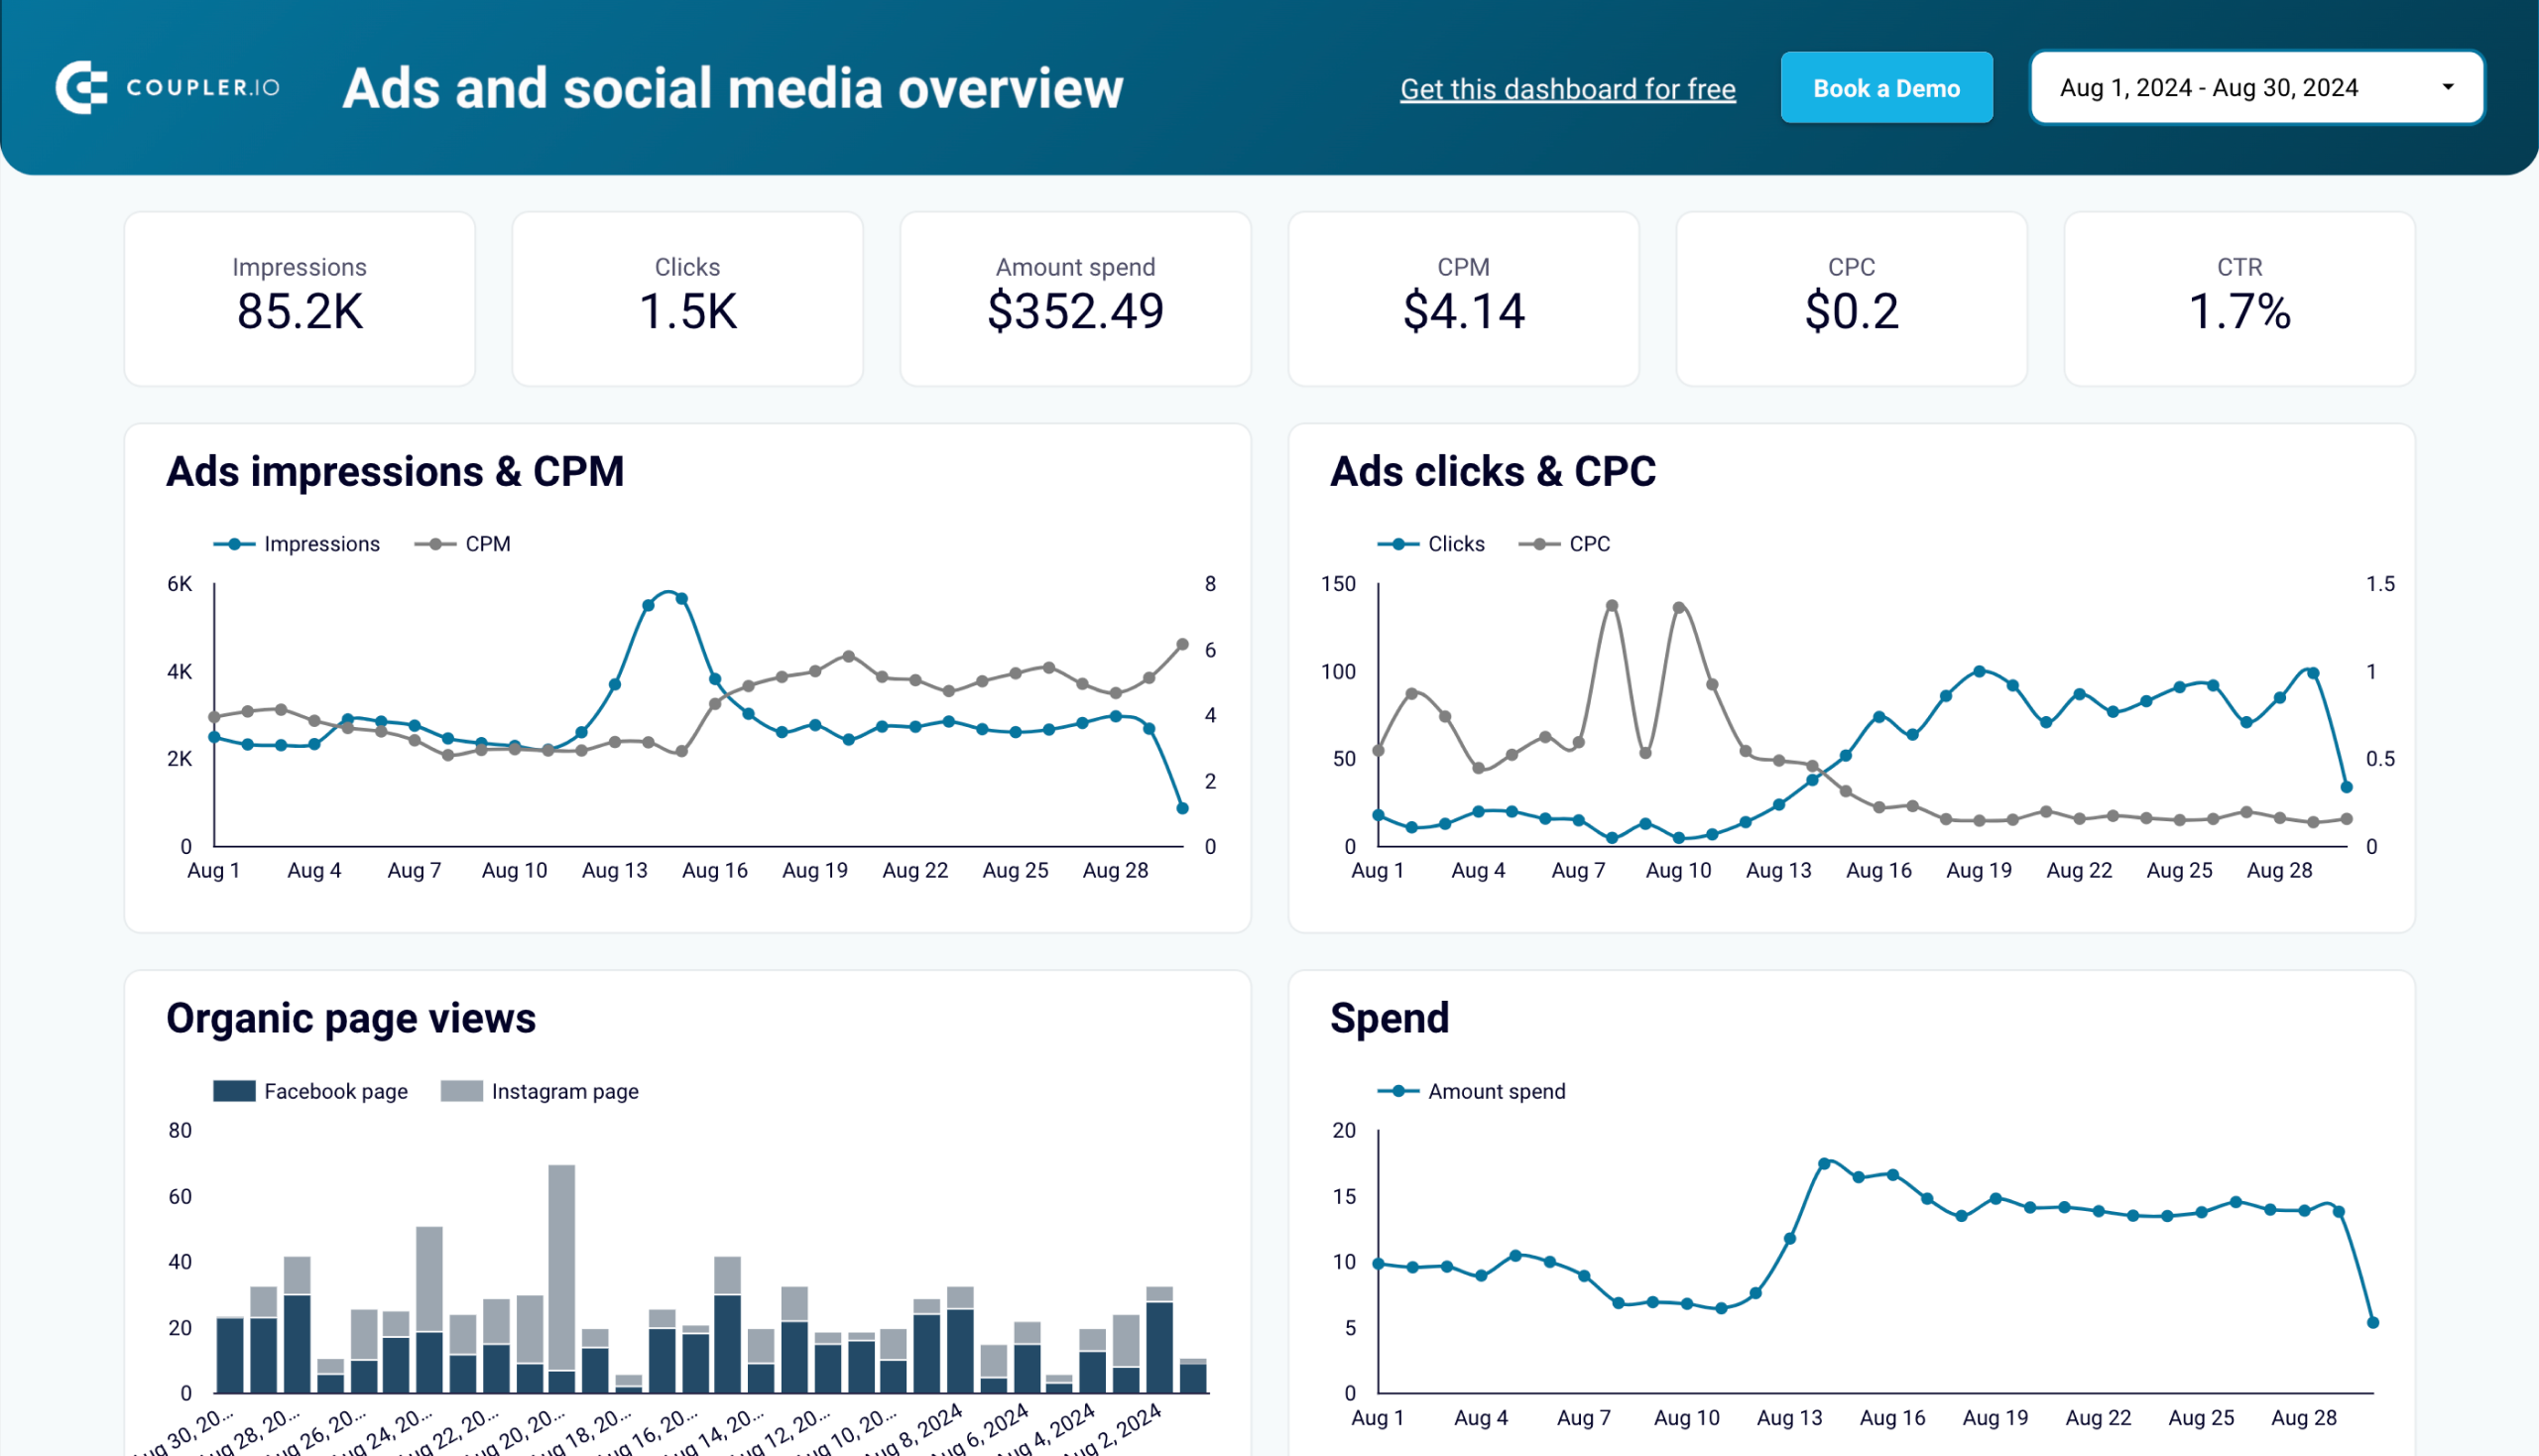
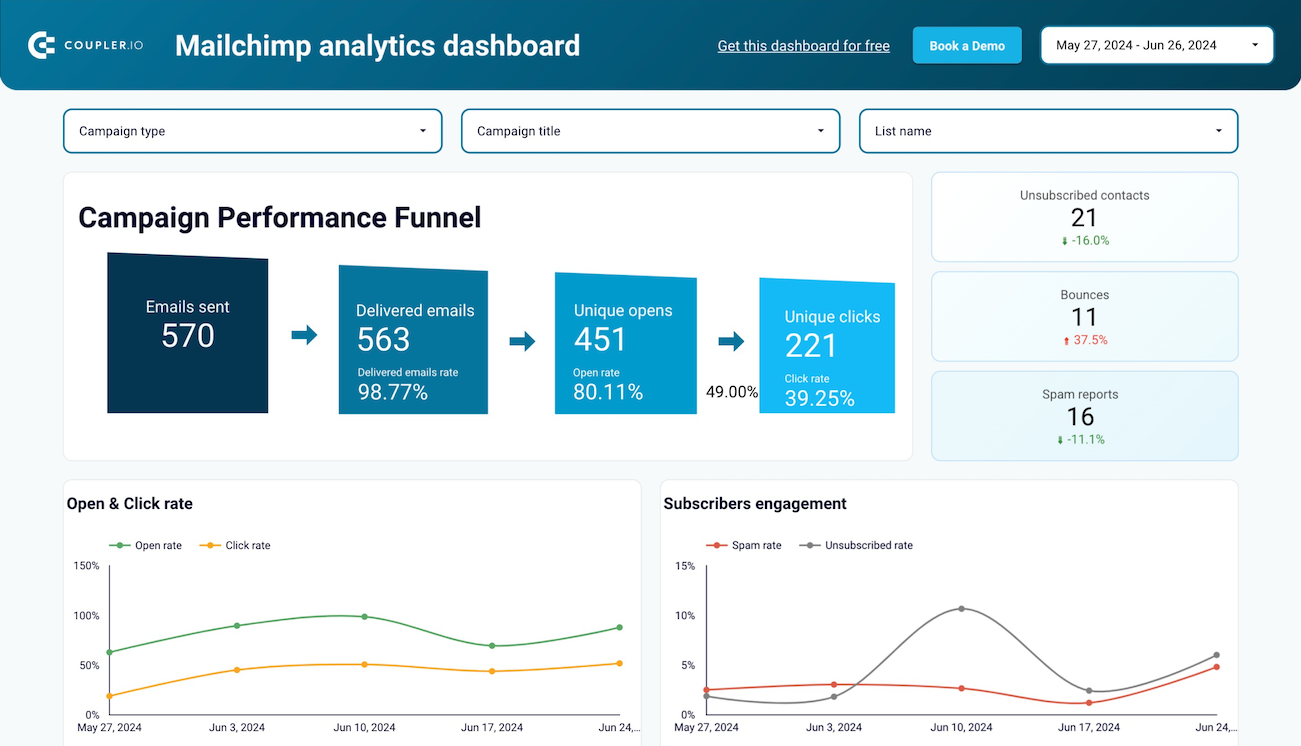
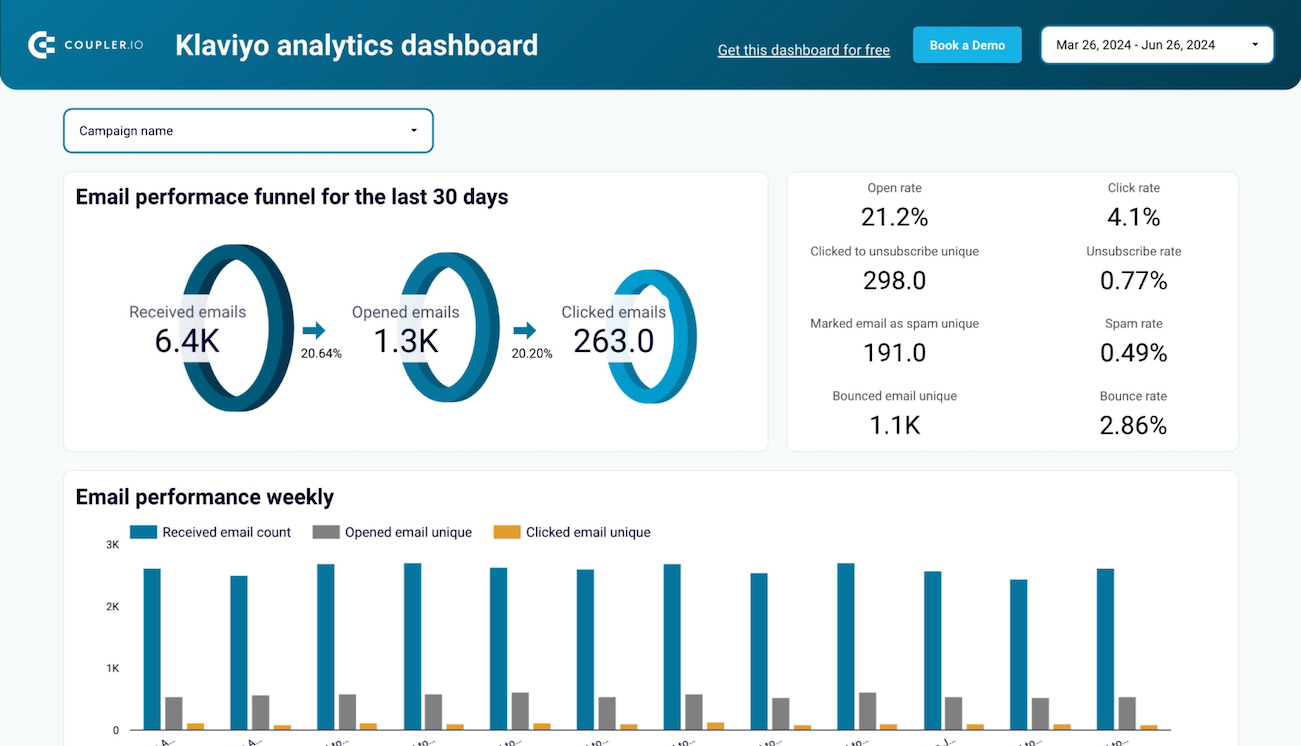
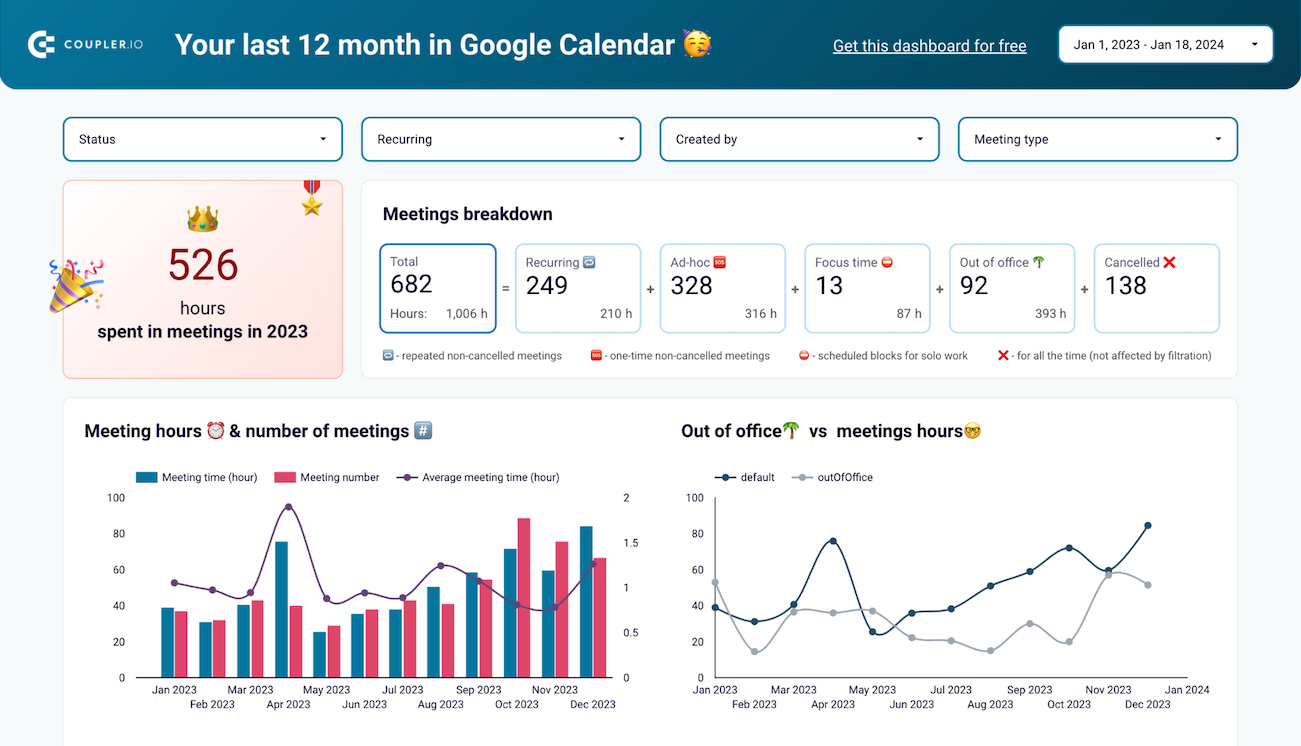
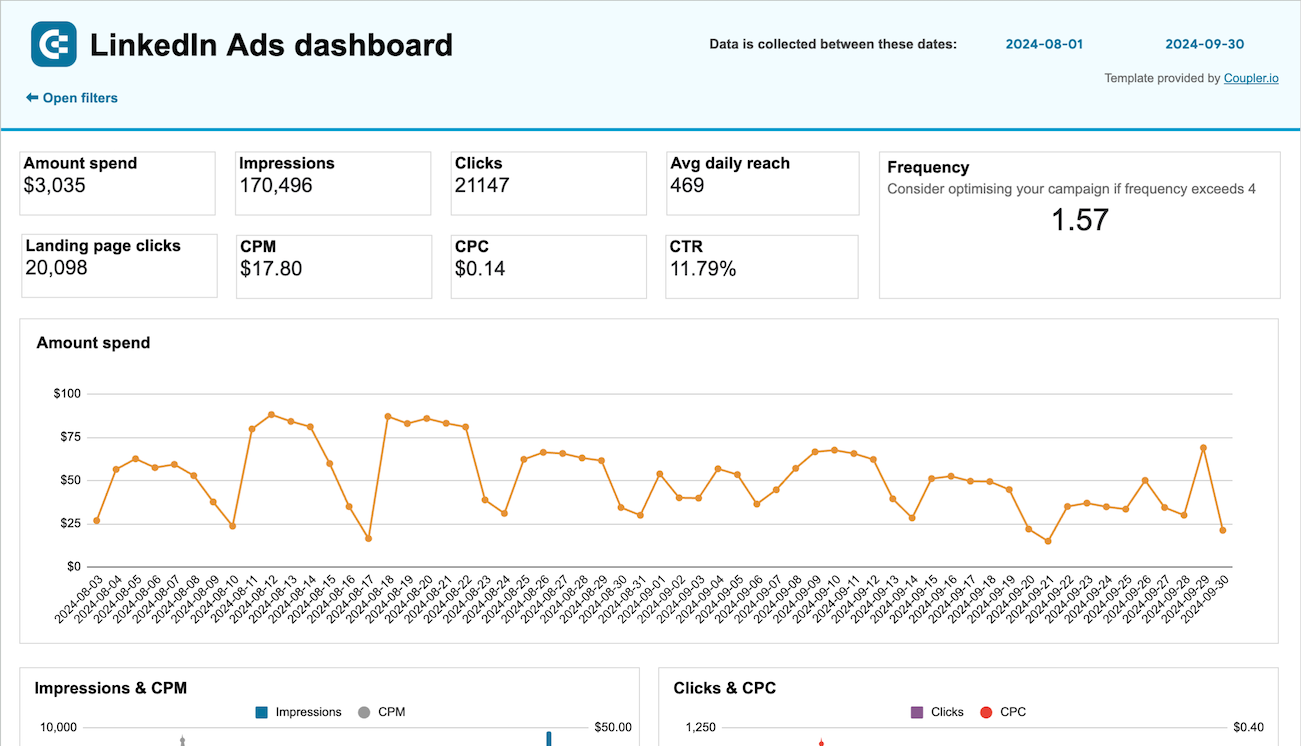
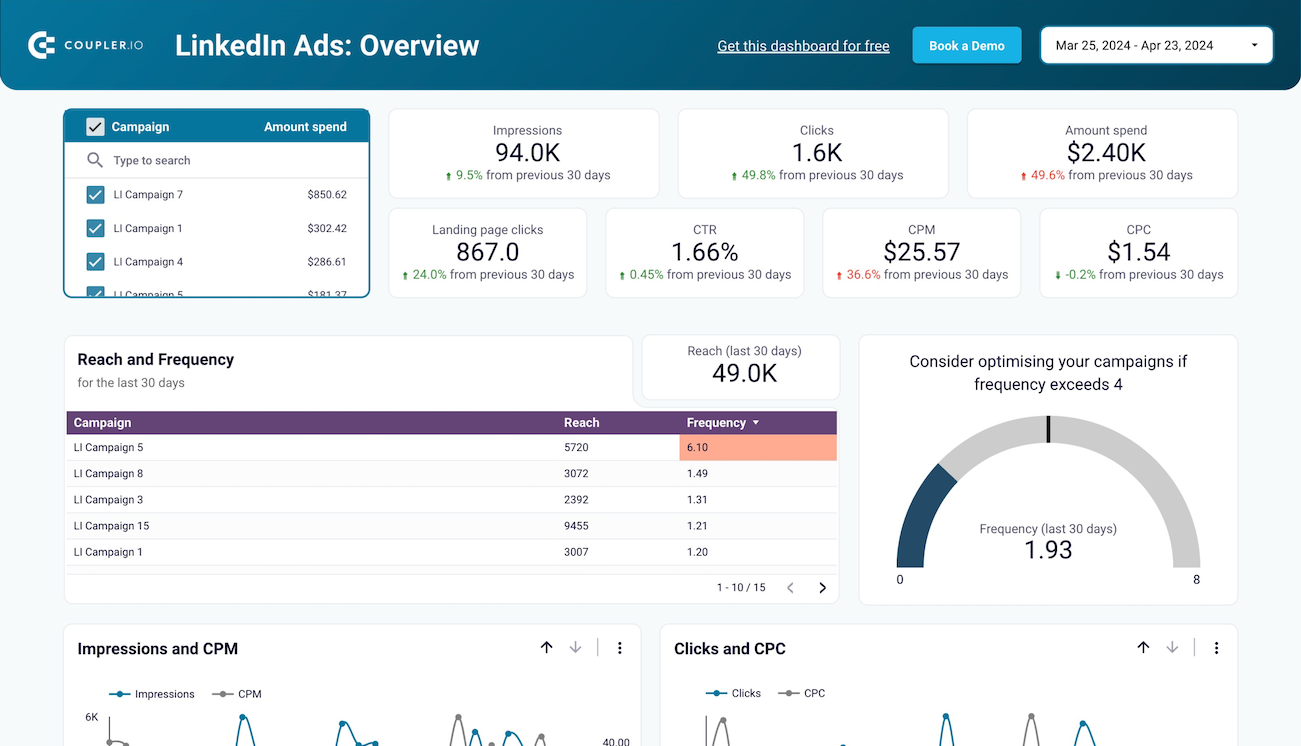
Measure the effectiveness of your marketing campaigns by monitoring the conversion rate from page views to completed purchases.

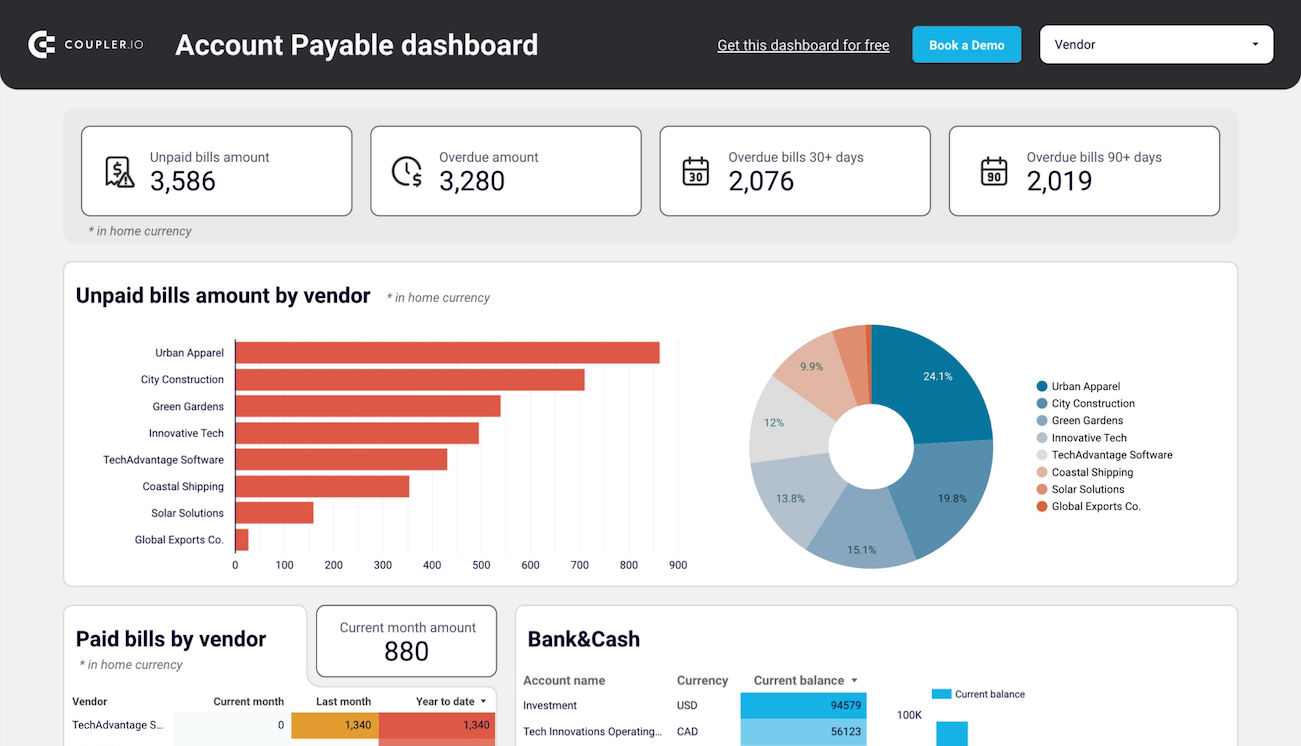
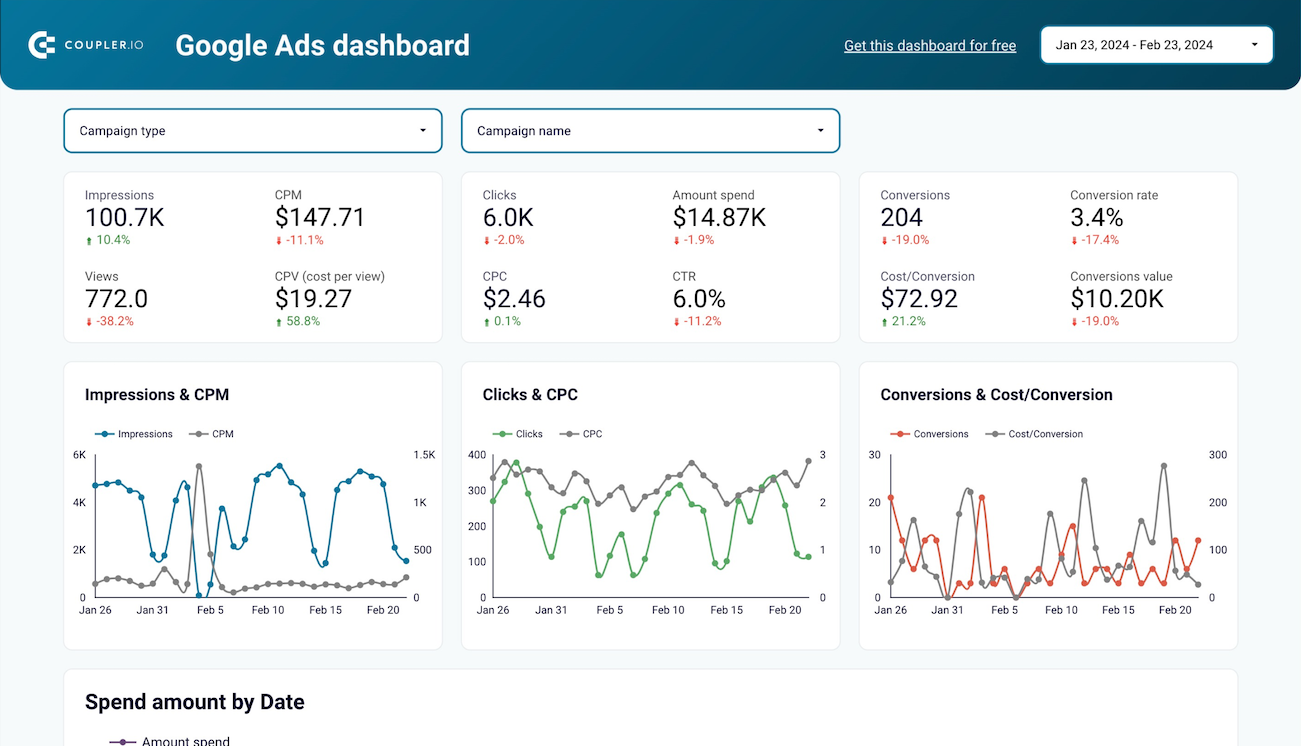
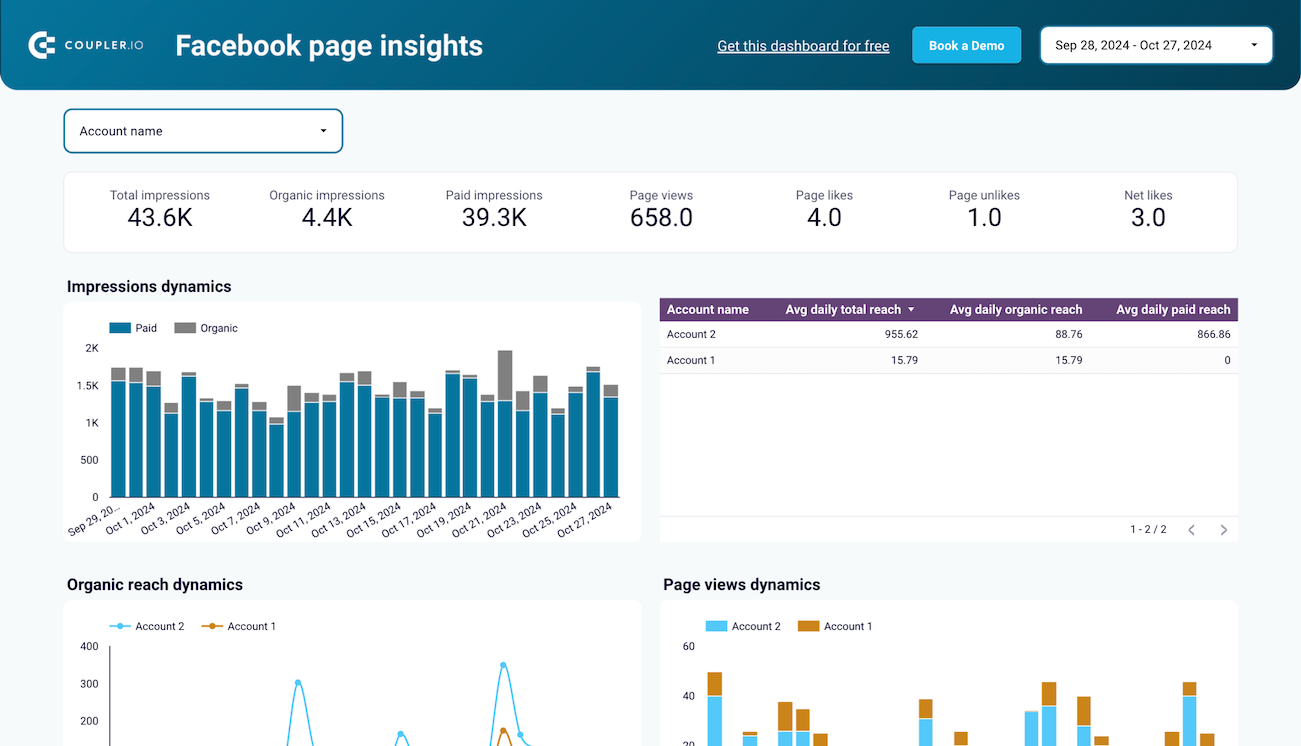
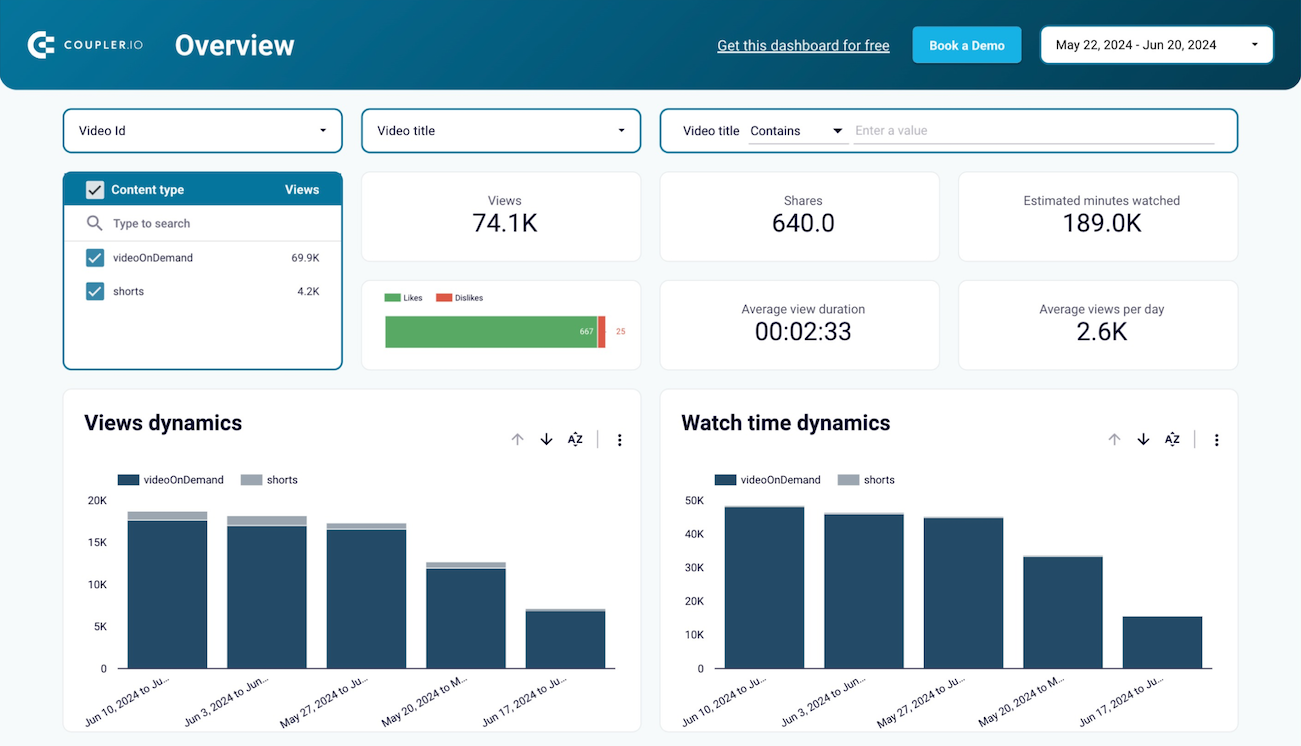
Discover trends in your sales performance by comparing first-time purchases with repeat purchases over time.

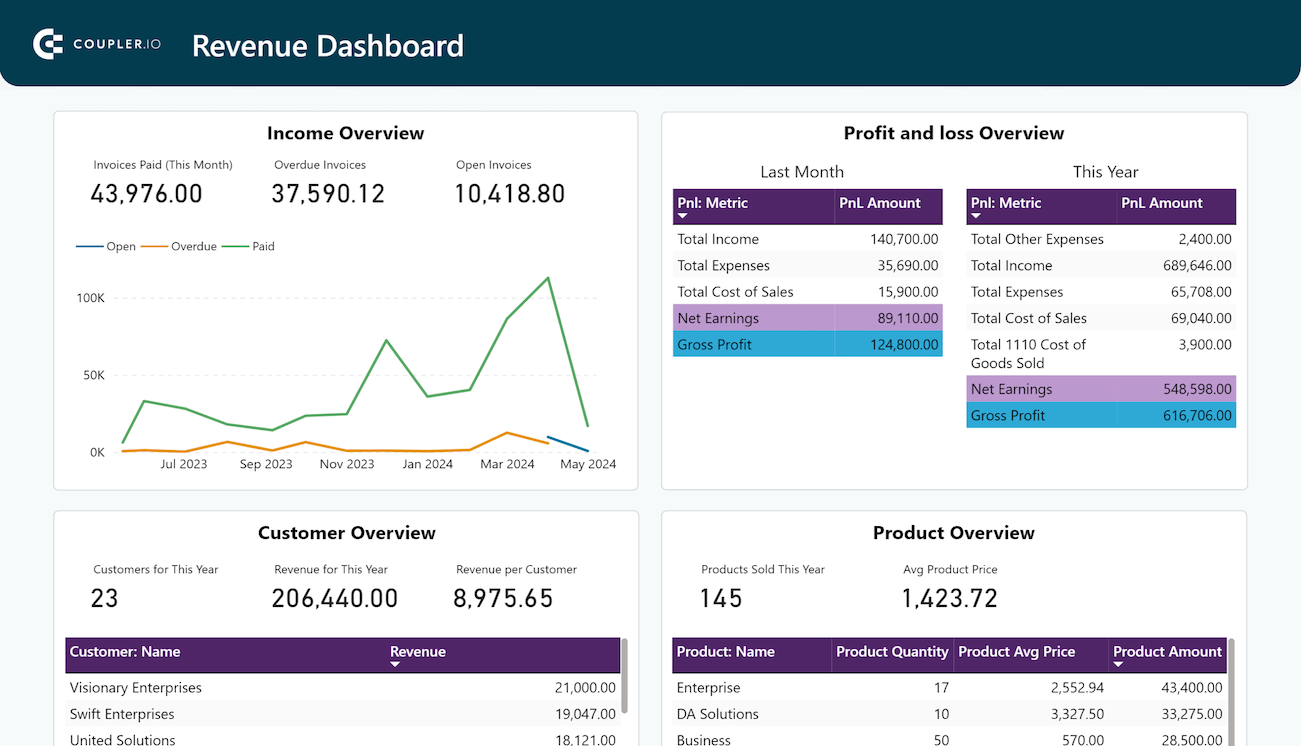
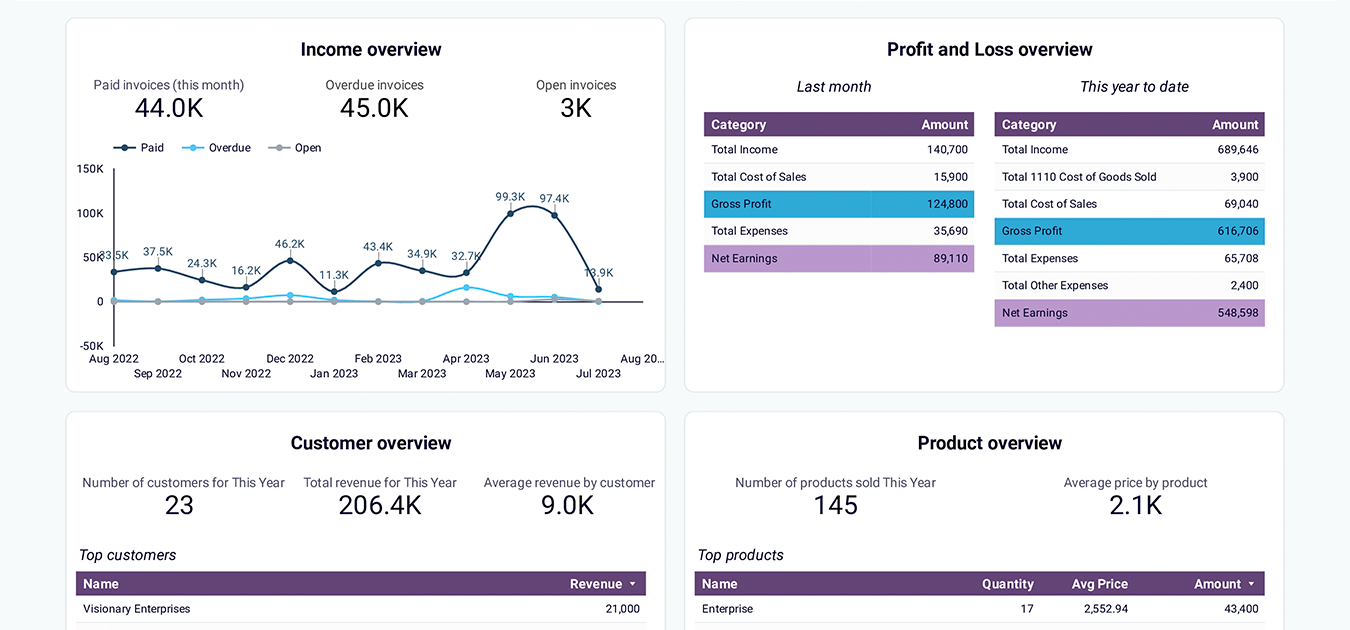
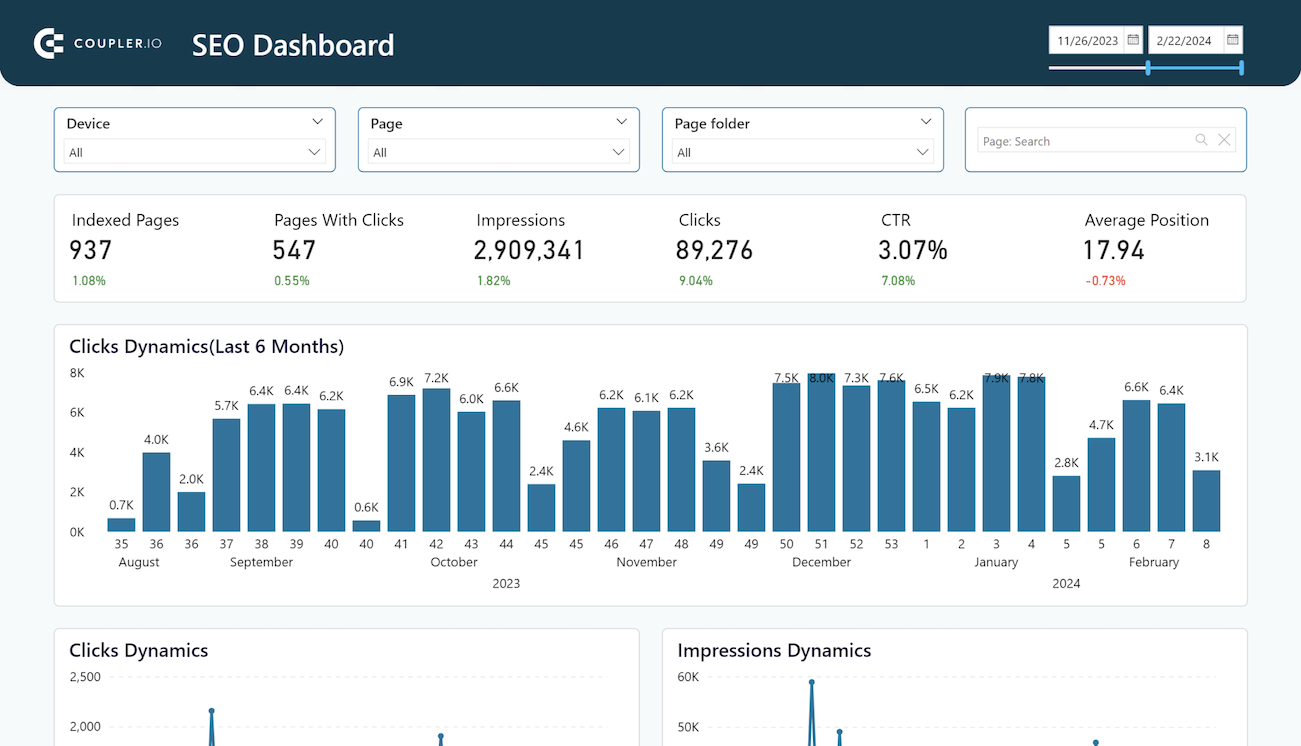
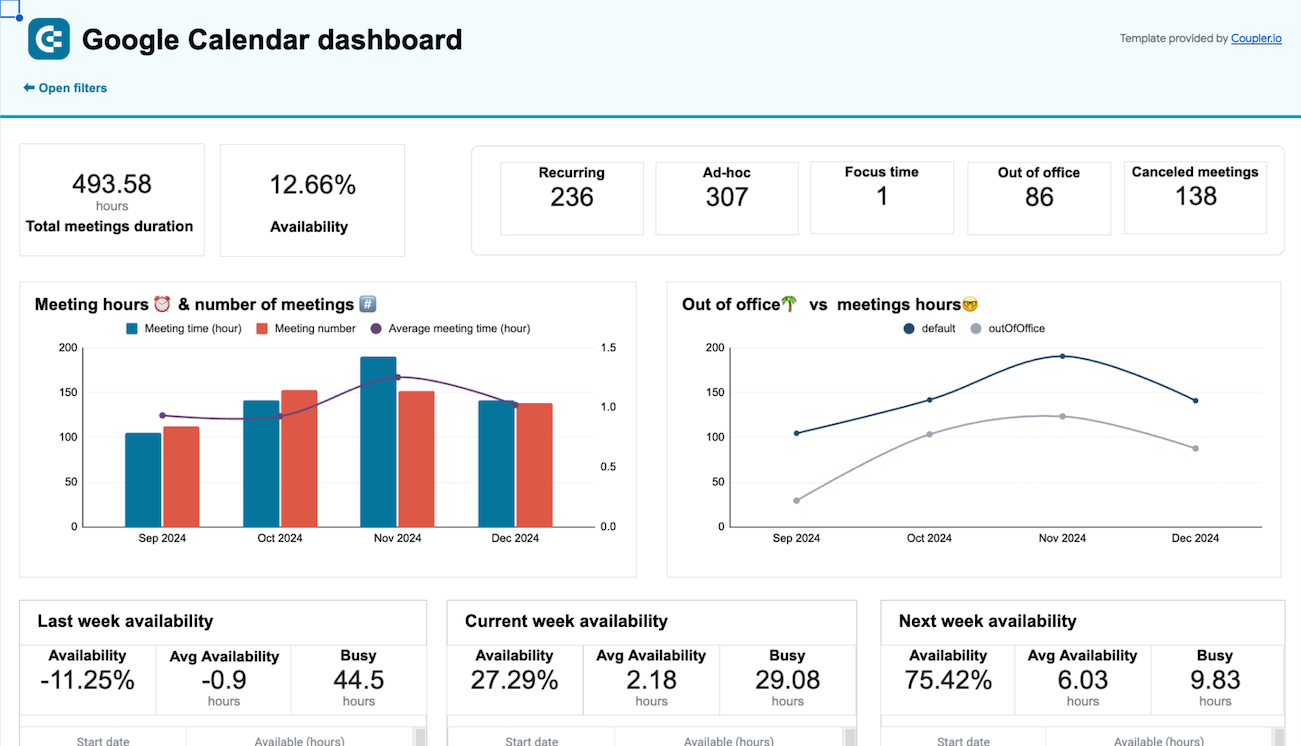
Evaluate how seasonal changes affect your sales funnel metrics, such as page views and purchases, to better prepare for peak shopping periods.

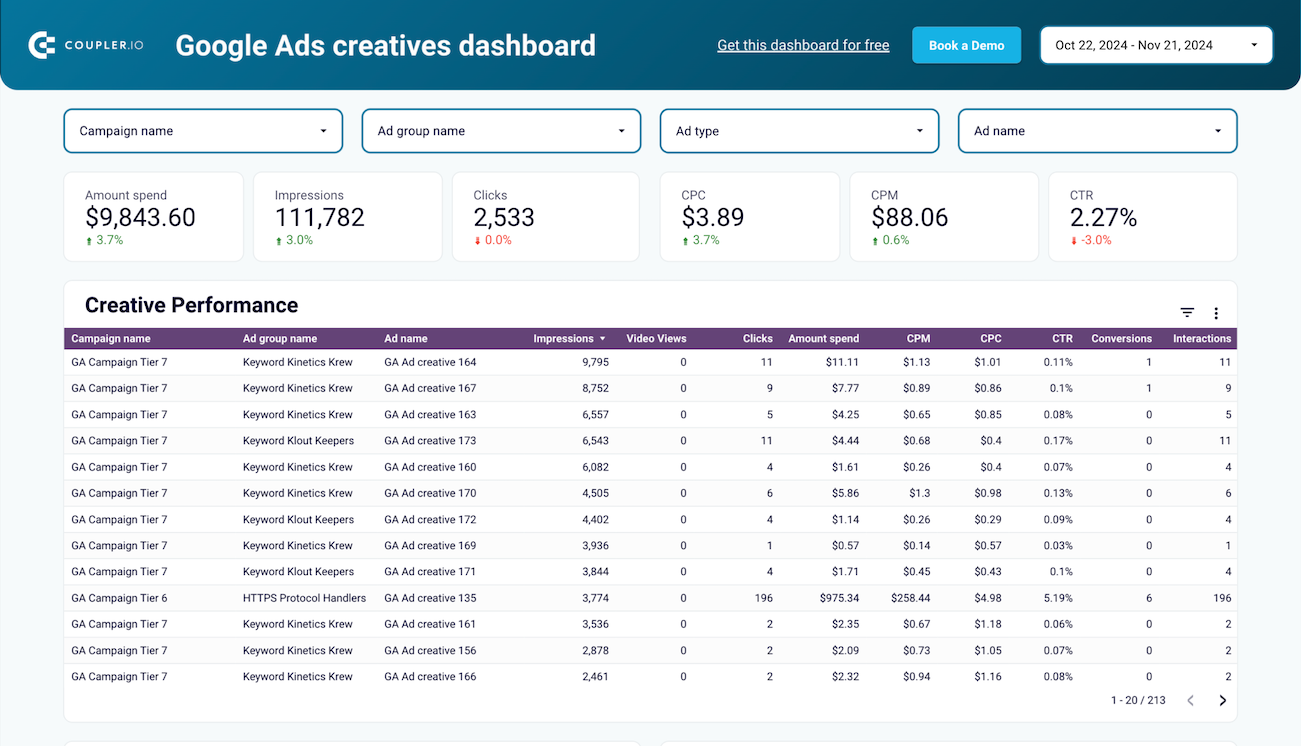
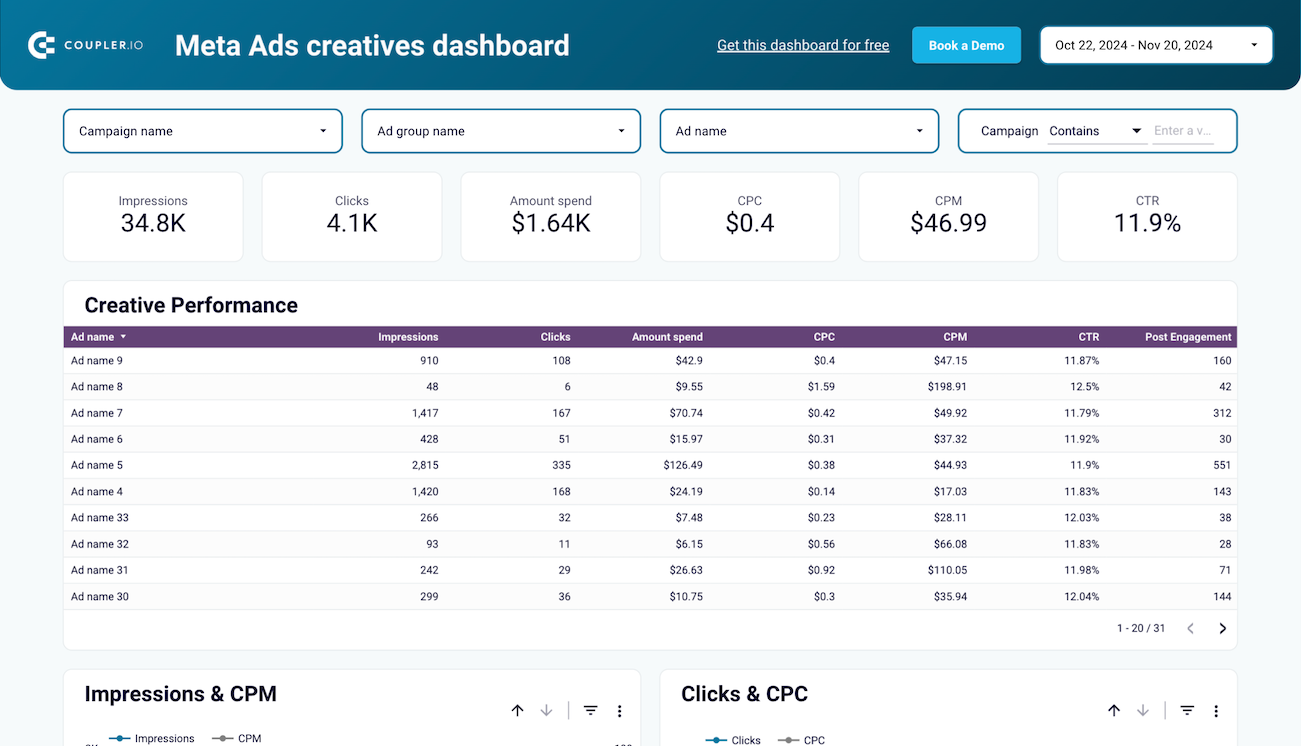
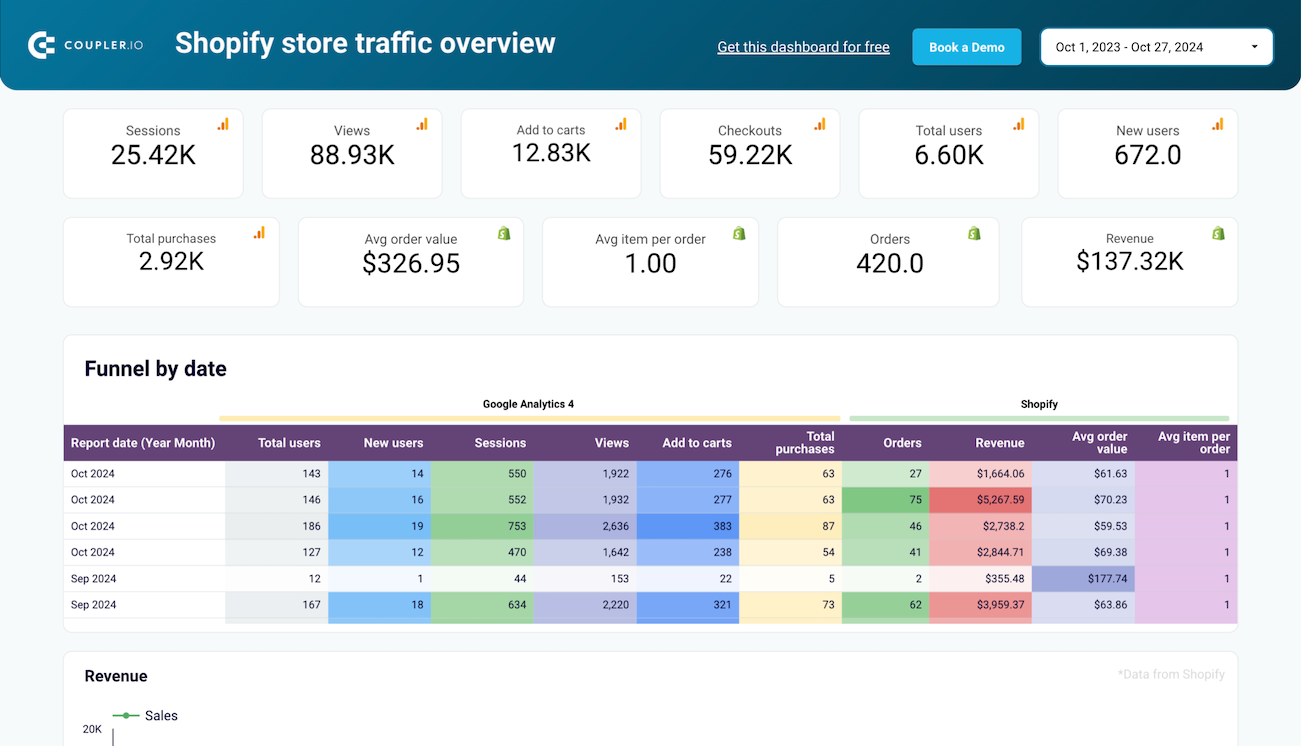
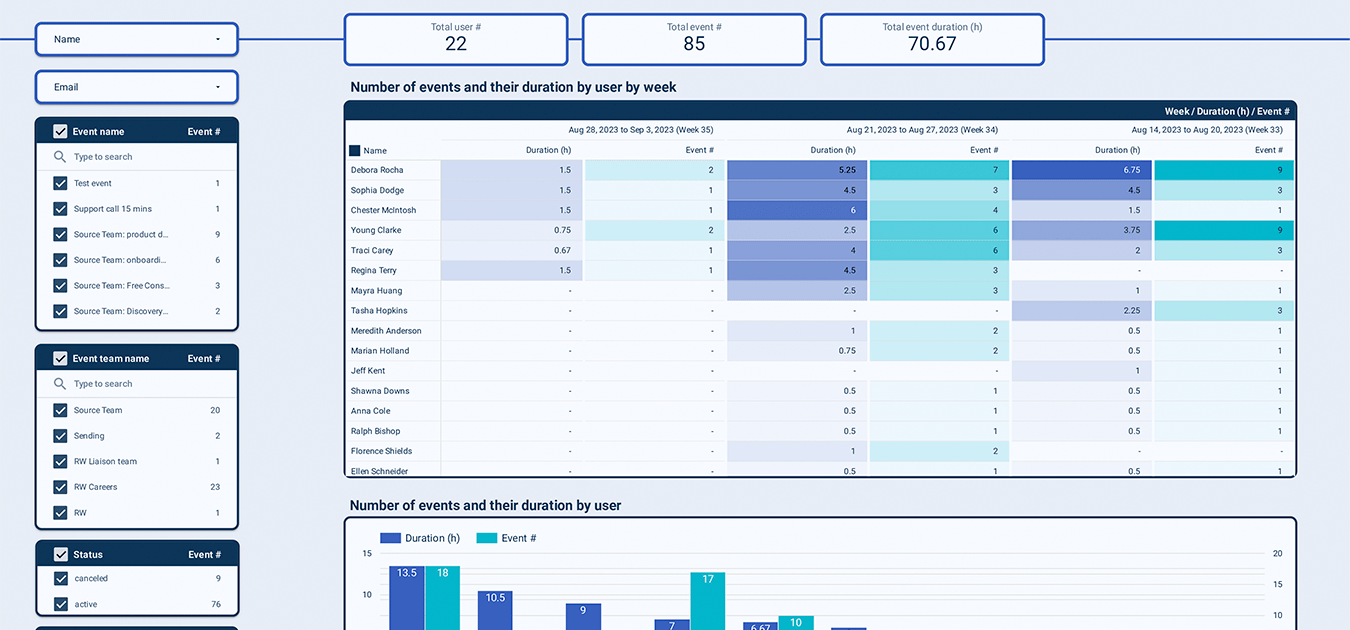
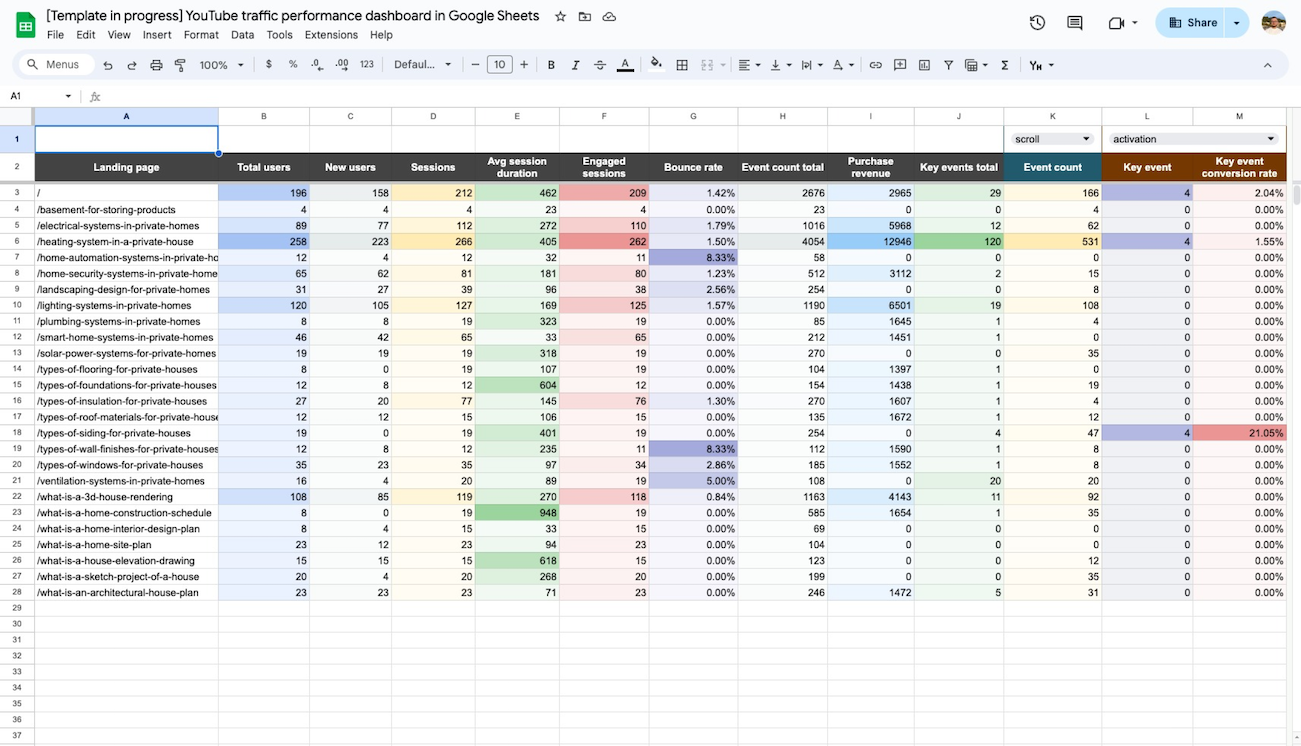
Track the journey of your order items from view to purchase, and monitor popularity dynamics over time to optimize inventory, improve marketing strategies, and enhance customer experience by focusing on best-selling products and addressing drop-off points.

Acquire peace of mind with the interactive Shopify sales funnel dashboard
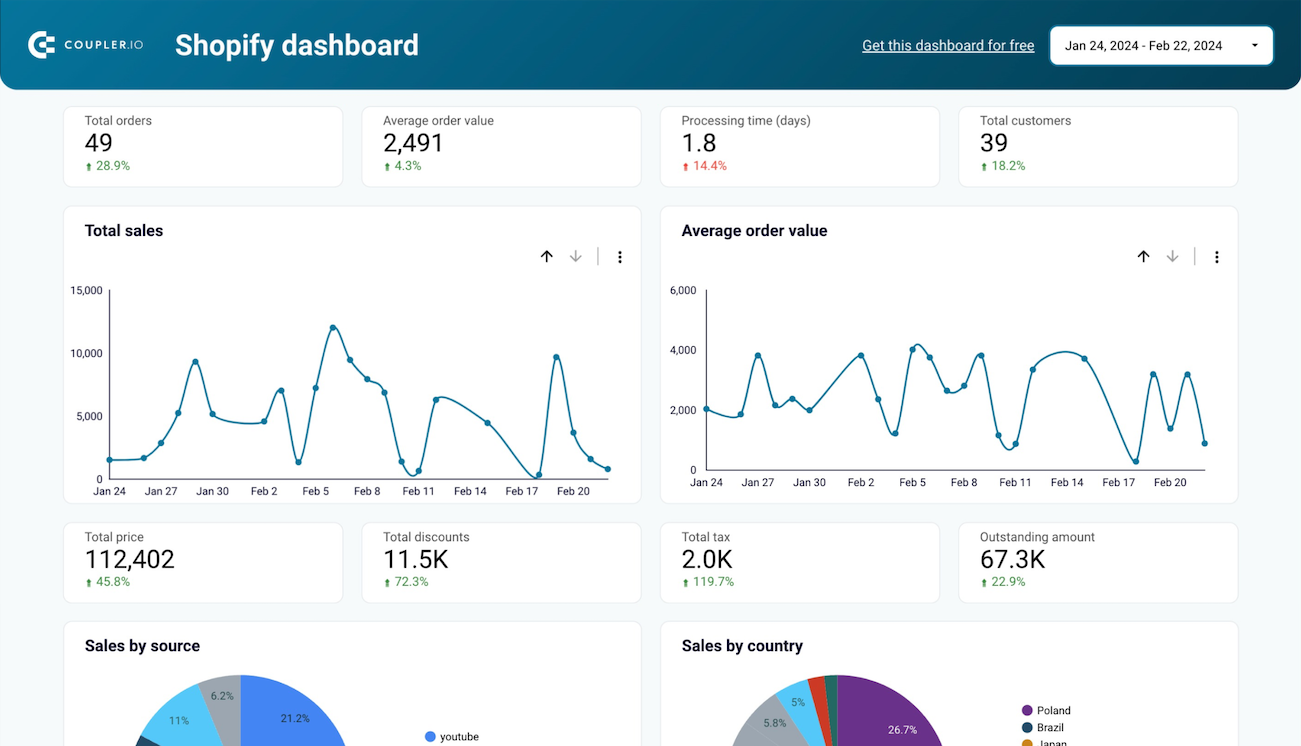
Instant analytics dashboard
Begin tracking your key metrics effortlessly. Connect the Google Analytics 4 account of your Shopify store to the dashboard in just several minutes—faster than you can drink a cup of coffee—by following the simple instructions.
Seamless data updates
Stay on top of your data with Coupler.io, ensuring your charts are always refreshed with the latest information from your Shopify sales funnel. Set your desired refresh frequency as frequently as every 15 minutes so your data is always current.
Personalized template
Tweak metrics and visuals to adapt the template to your requirements. Effortlessly share Instagram business insights with stakeholders at the click of a button.
No need to build a Shopify sales funnel dashboard from scratch.
Use the fully automated template!
Check out the Coupler.io dashboard gallery


about your case. It doesn't cost you a penny 😉
Metrics you can track with the Shopify sales funnel dashboard

