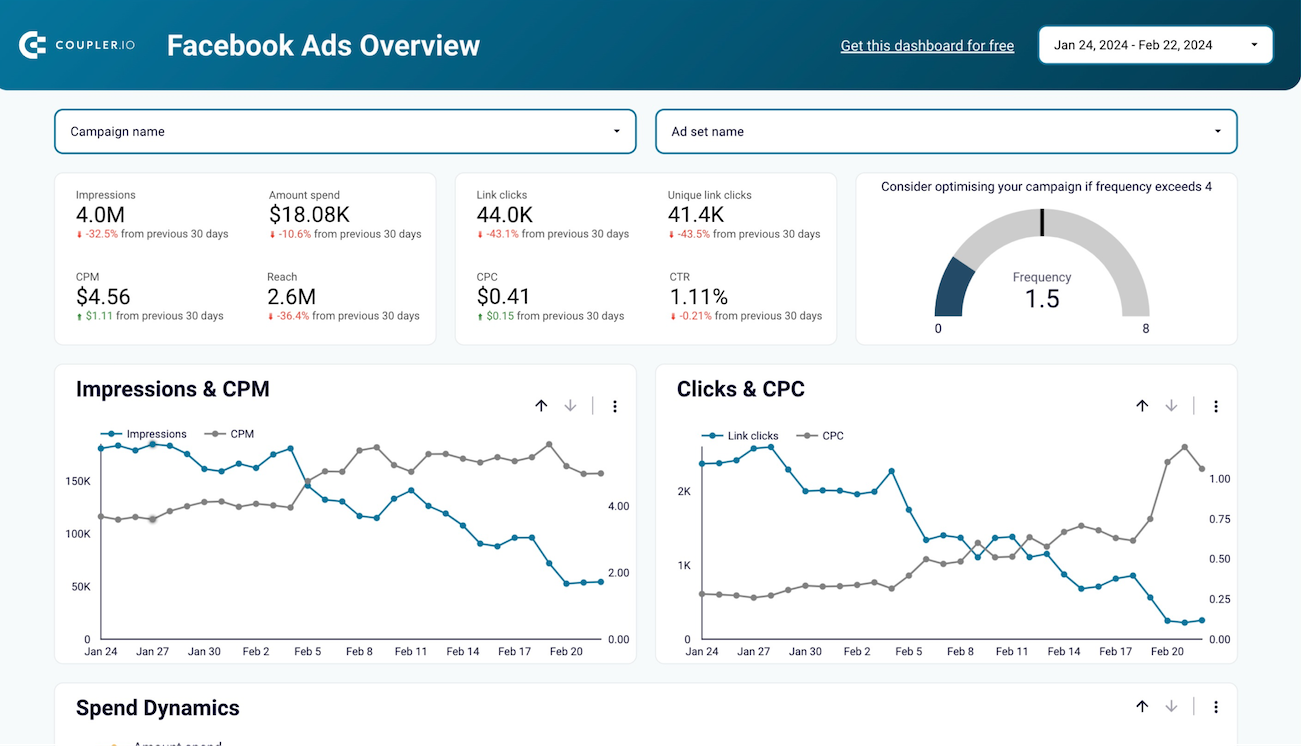
Facebook Ads leads breakdown dashboard template for Looker Studio
Designed in Looker Studio, this Facebook Ads leads breakdown dashboard provides a complete visualization tool for lead analysis. Simply copy the template and connect it to your Facebook Ads data to monitor real-time conversions.


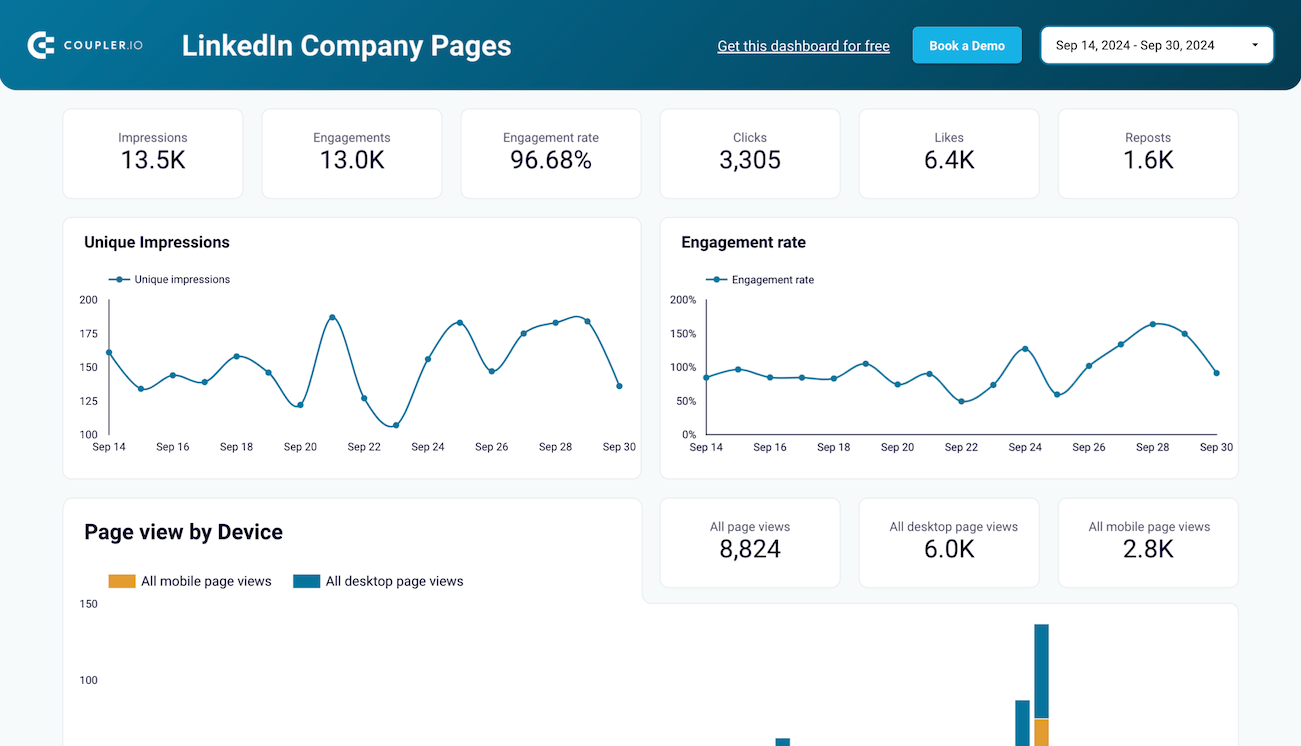
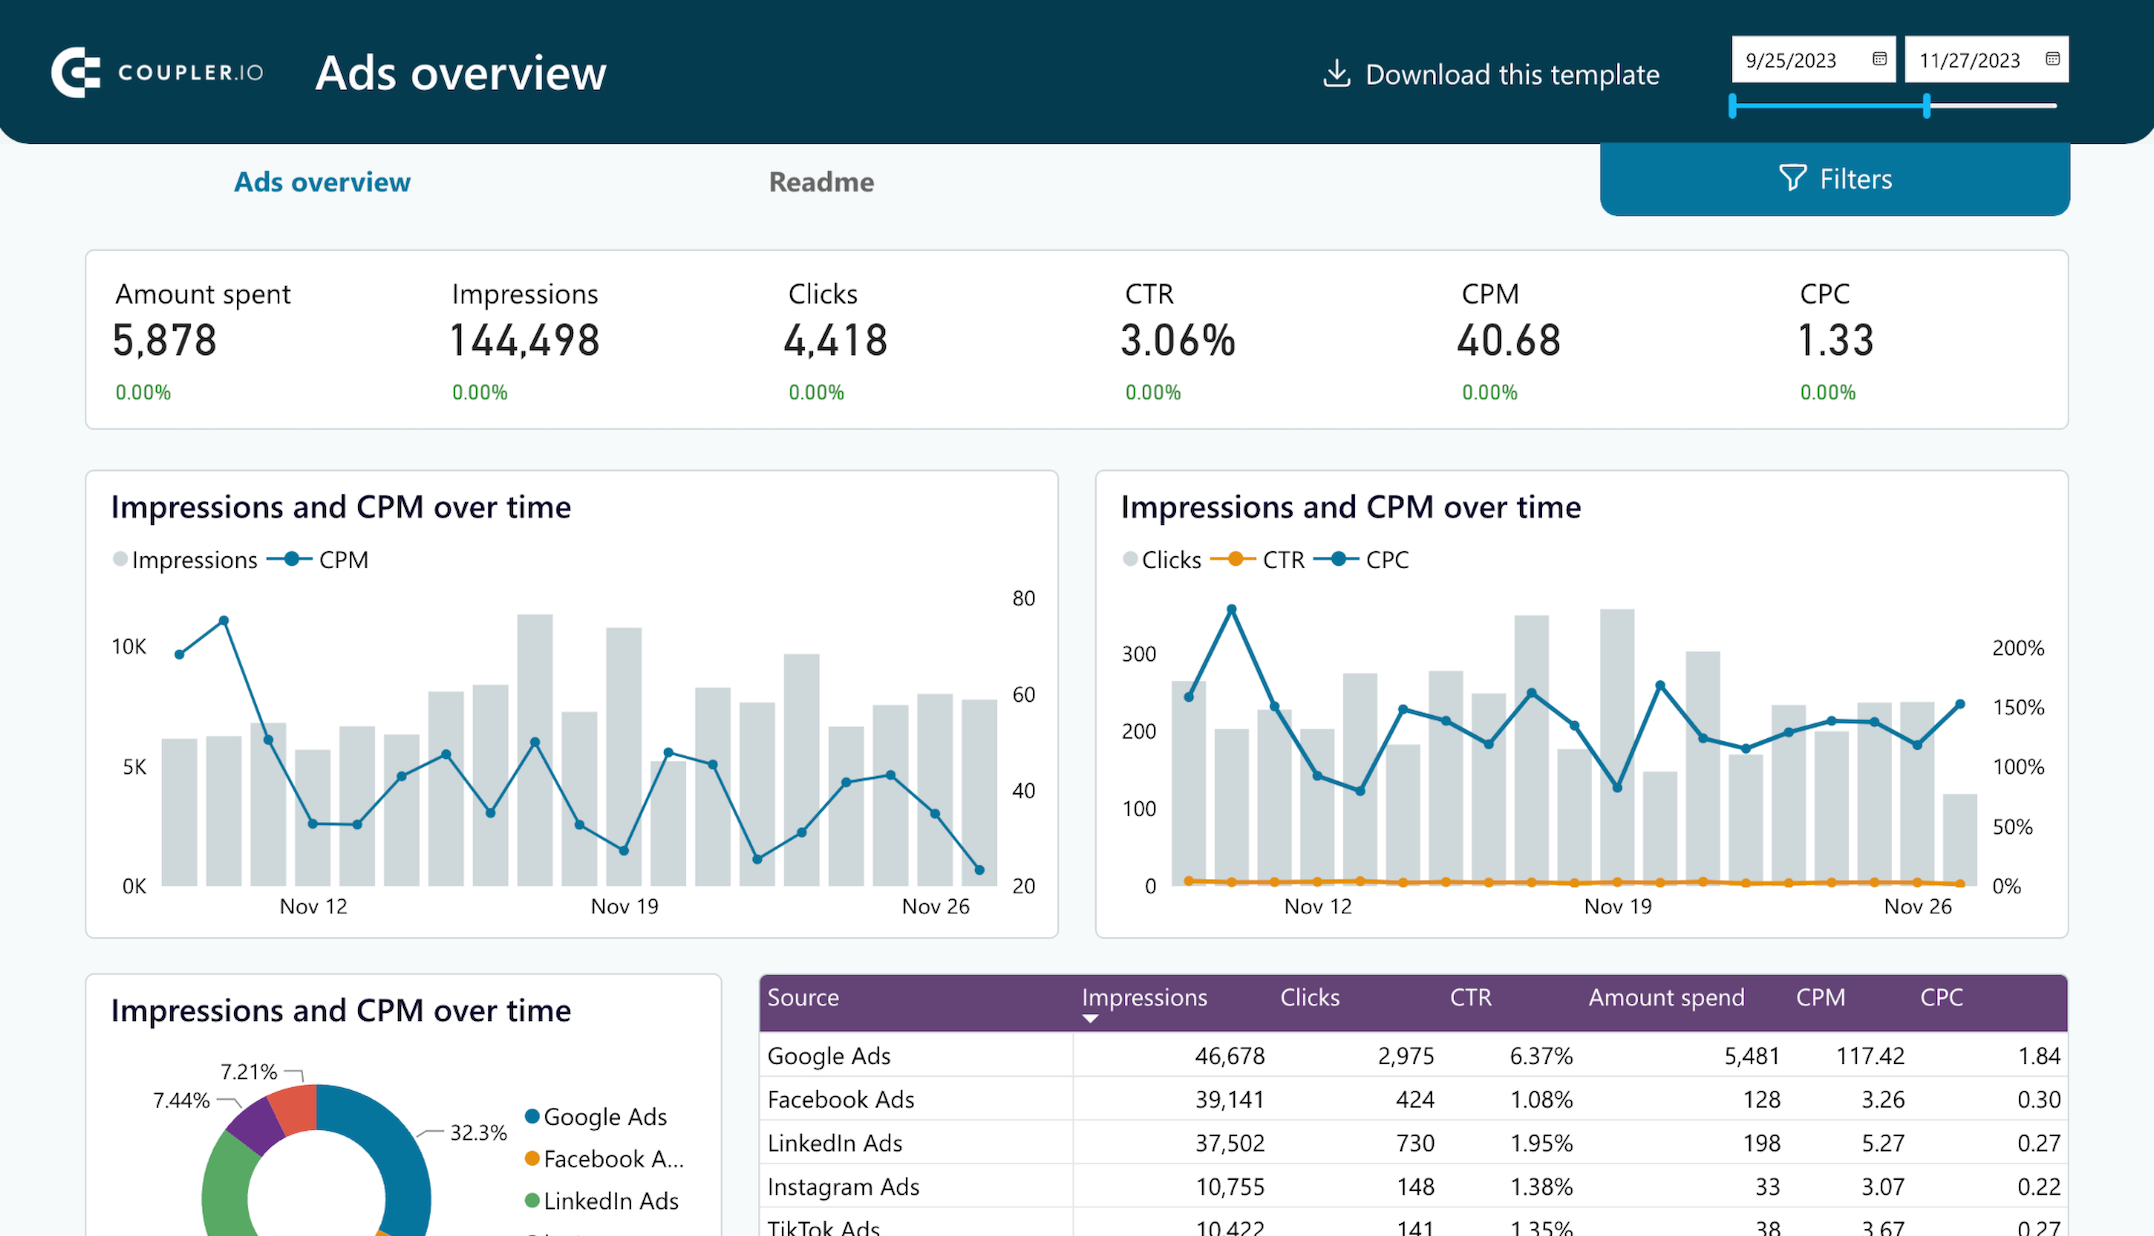
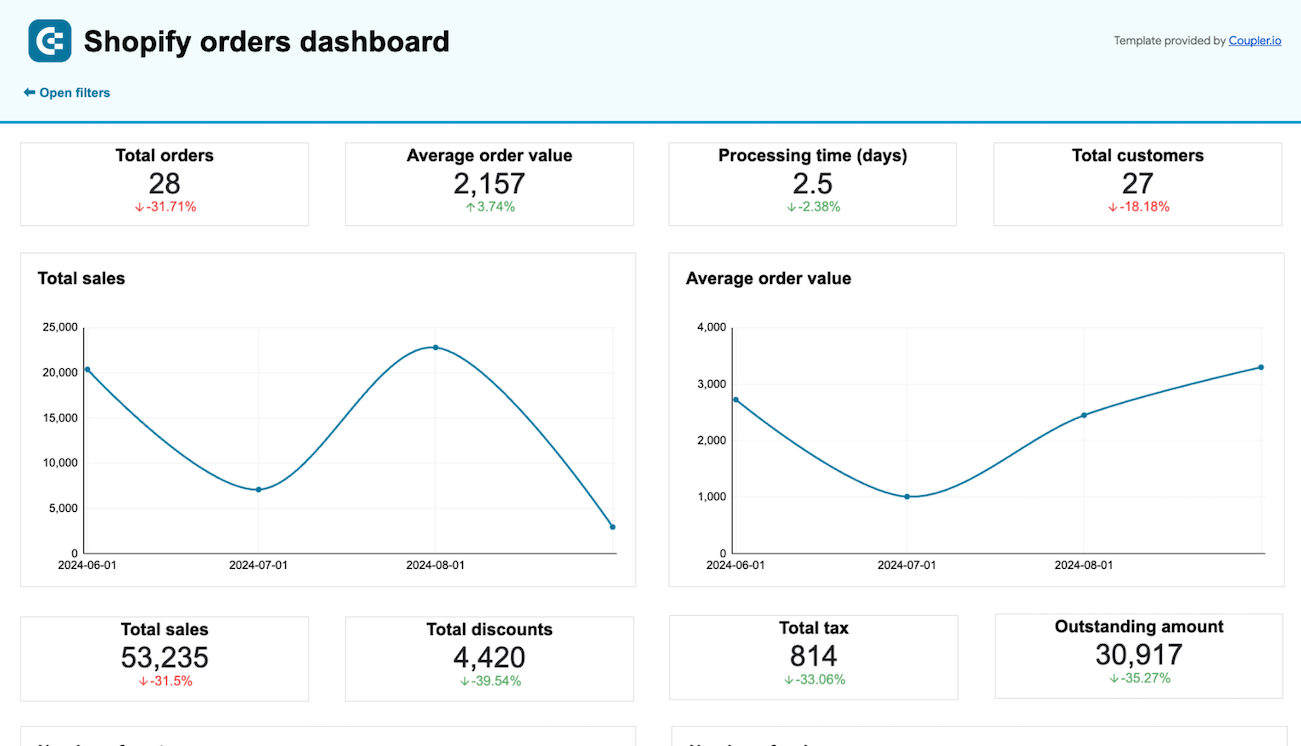
Quick overview of the Facebook Ads leads breakdown dashboard
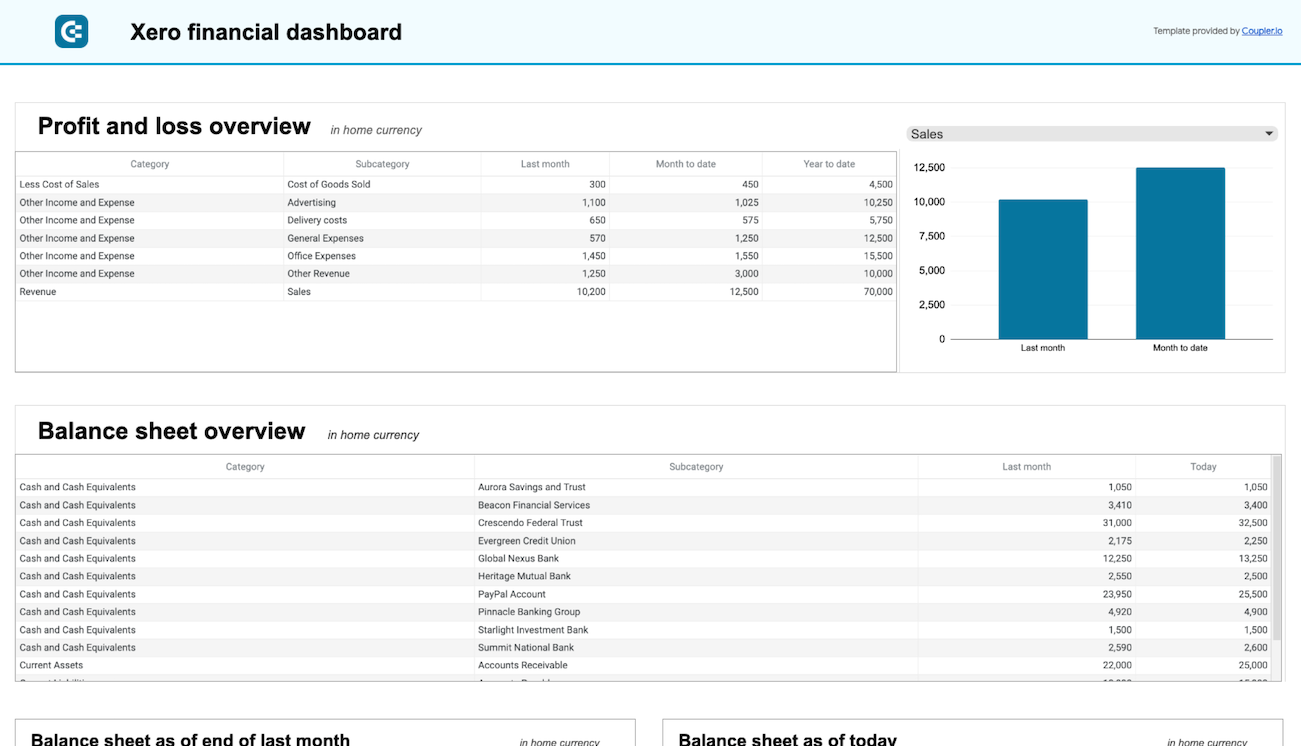
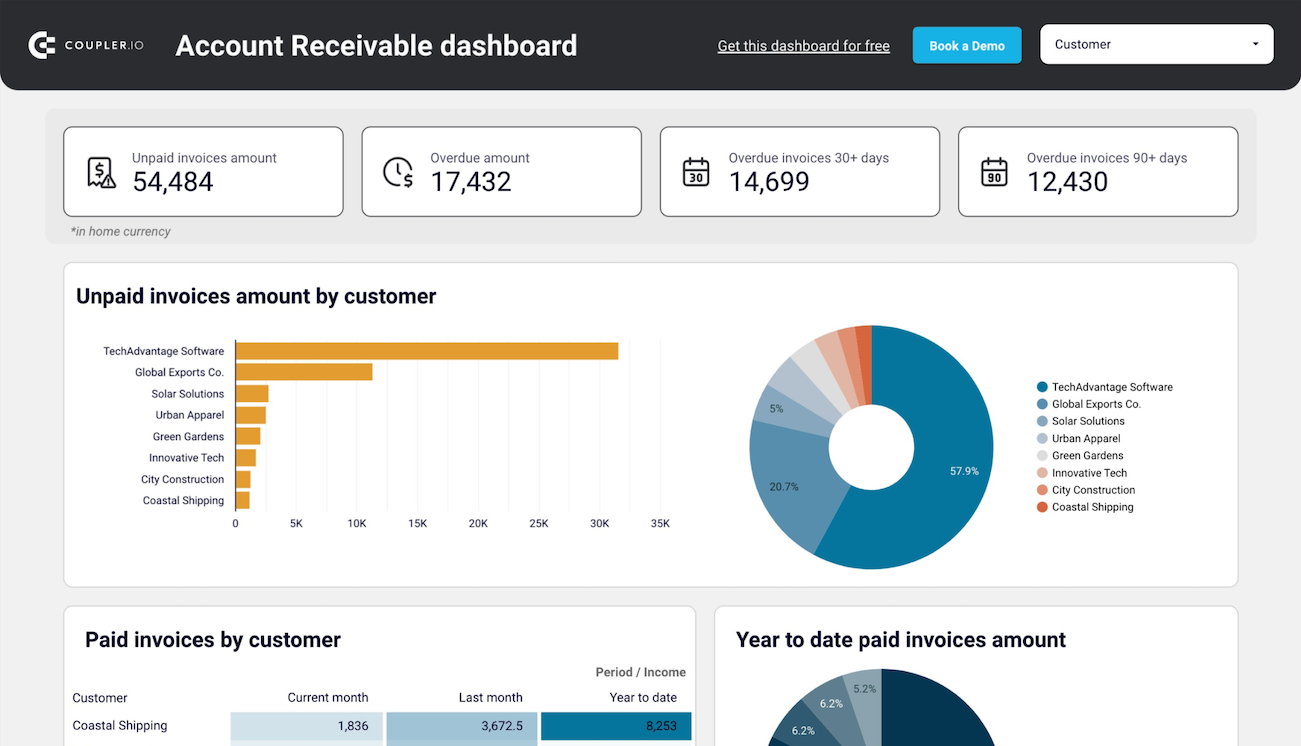
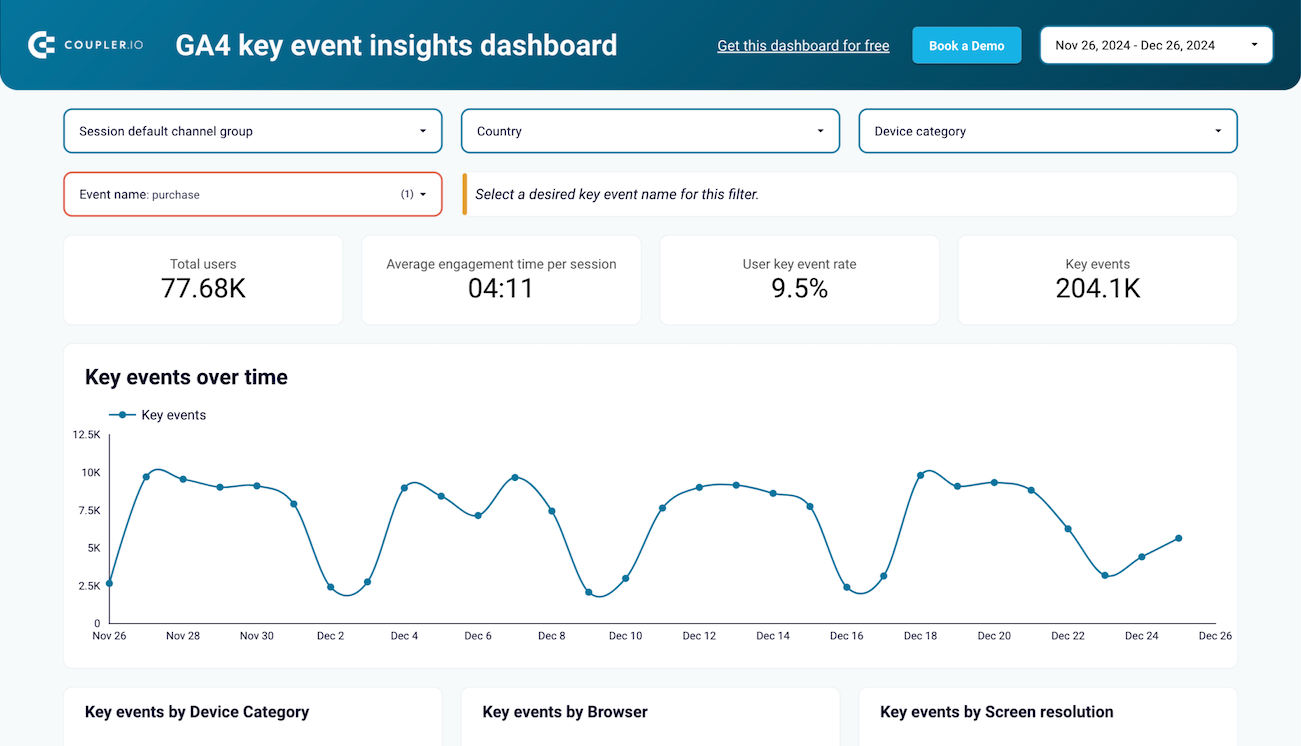
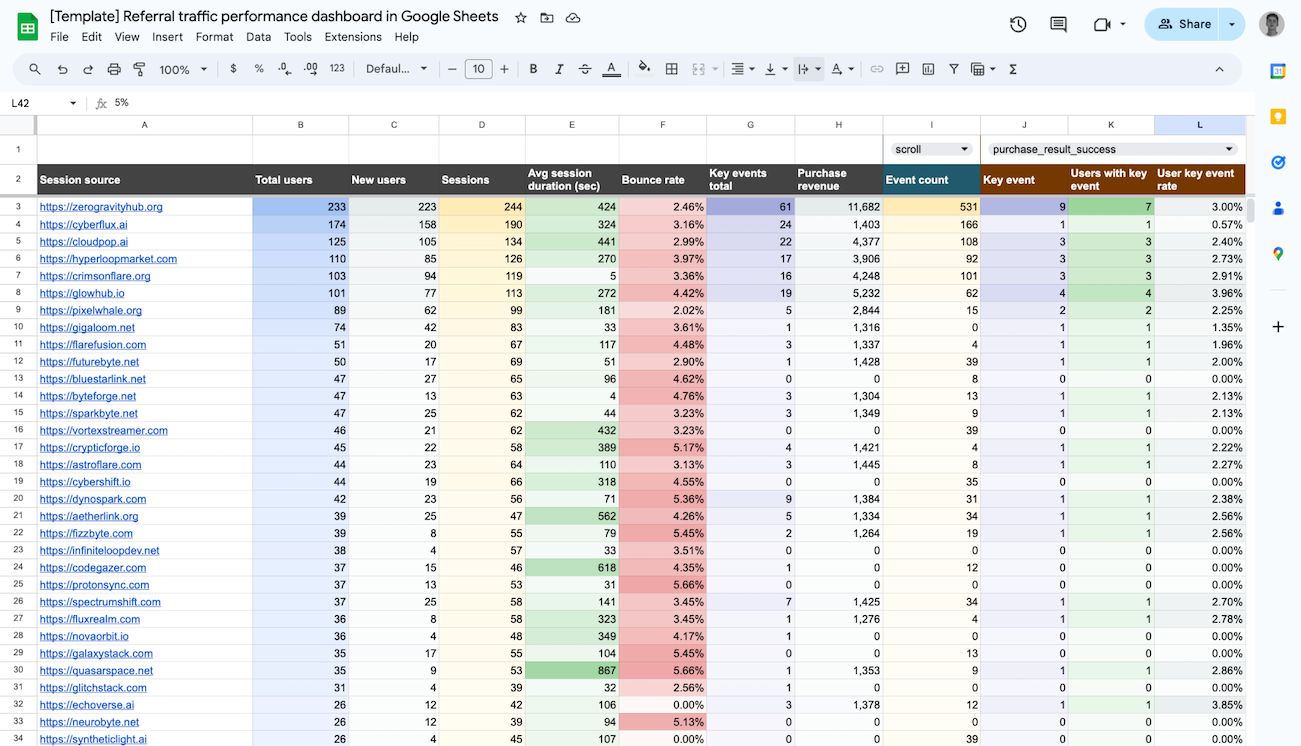
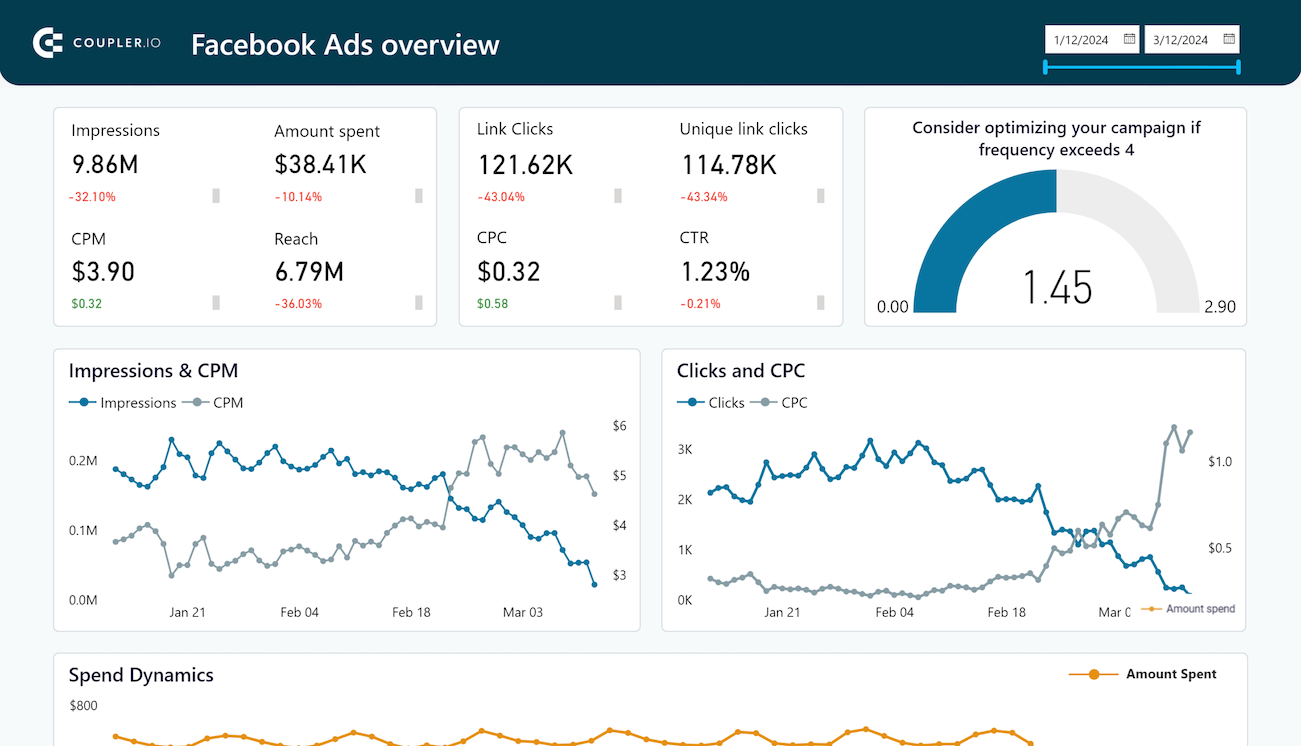
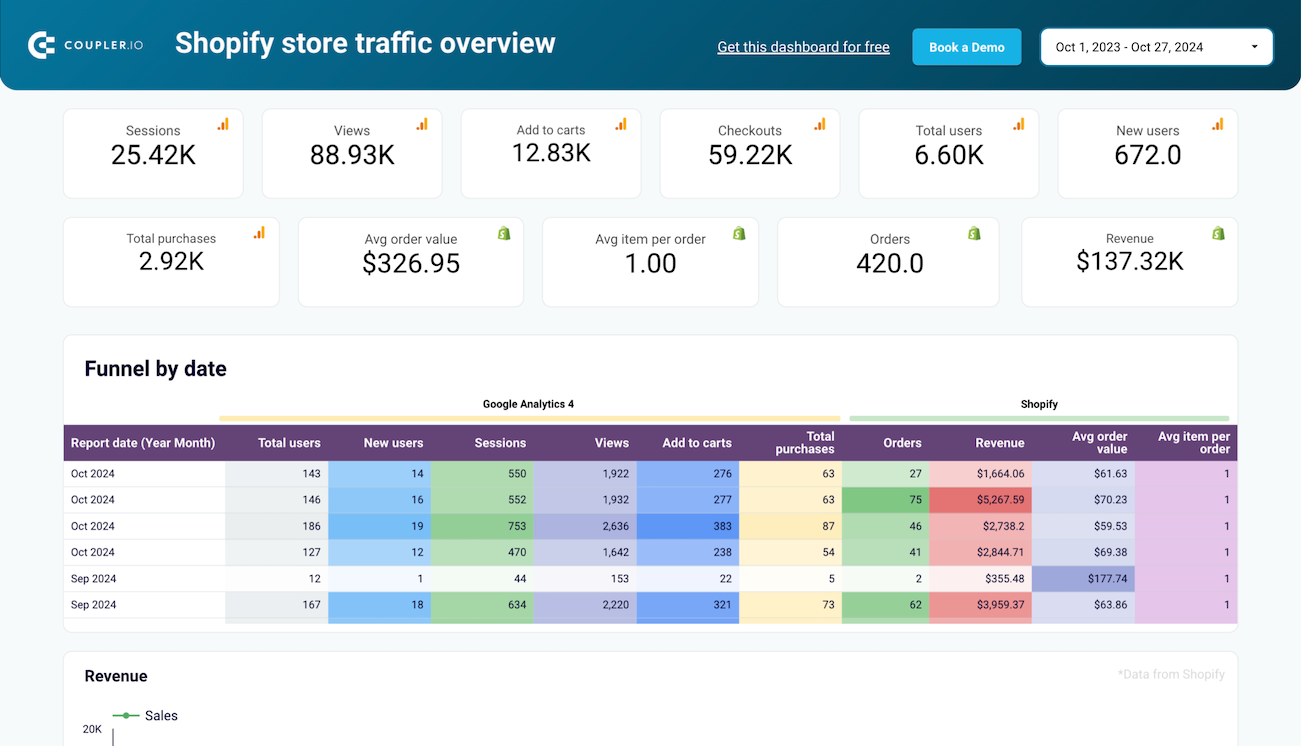
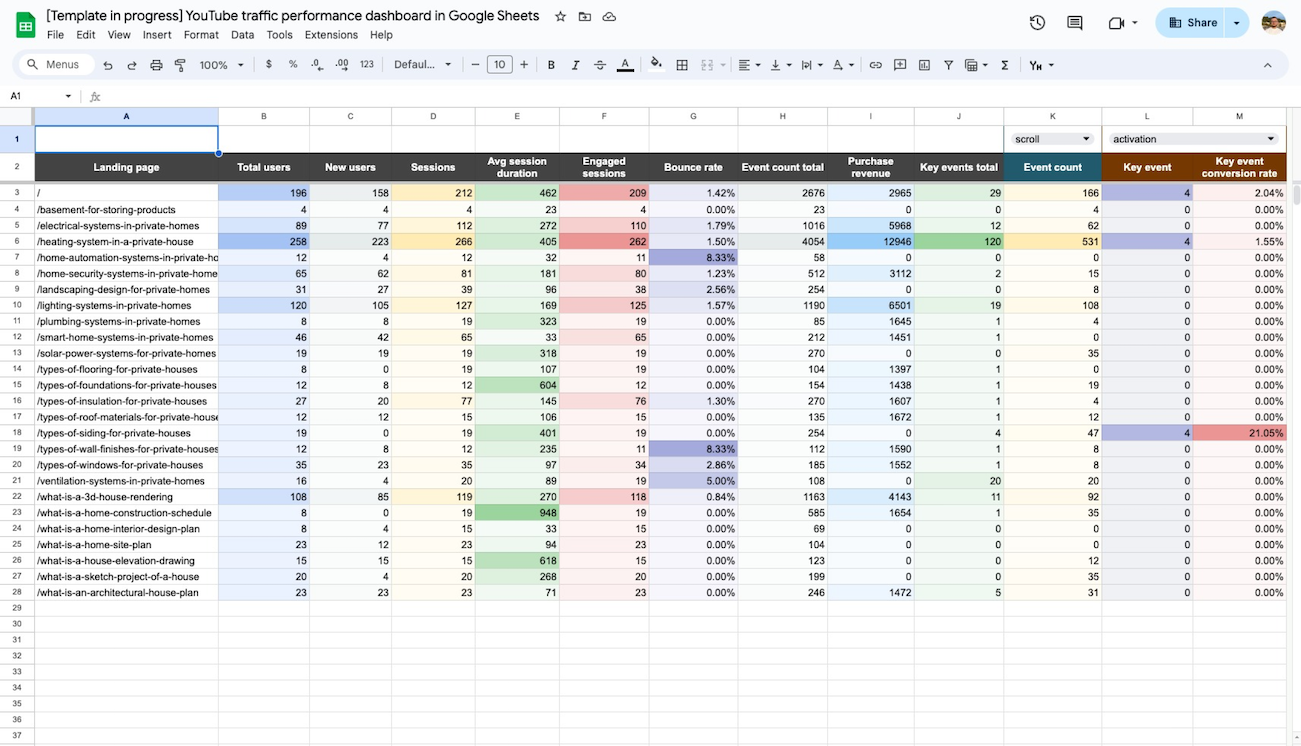
Compare ad spend and leads value over time to understand which companies bring in high-quality prospects and ensure you focus resources on top-performing strategies.

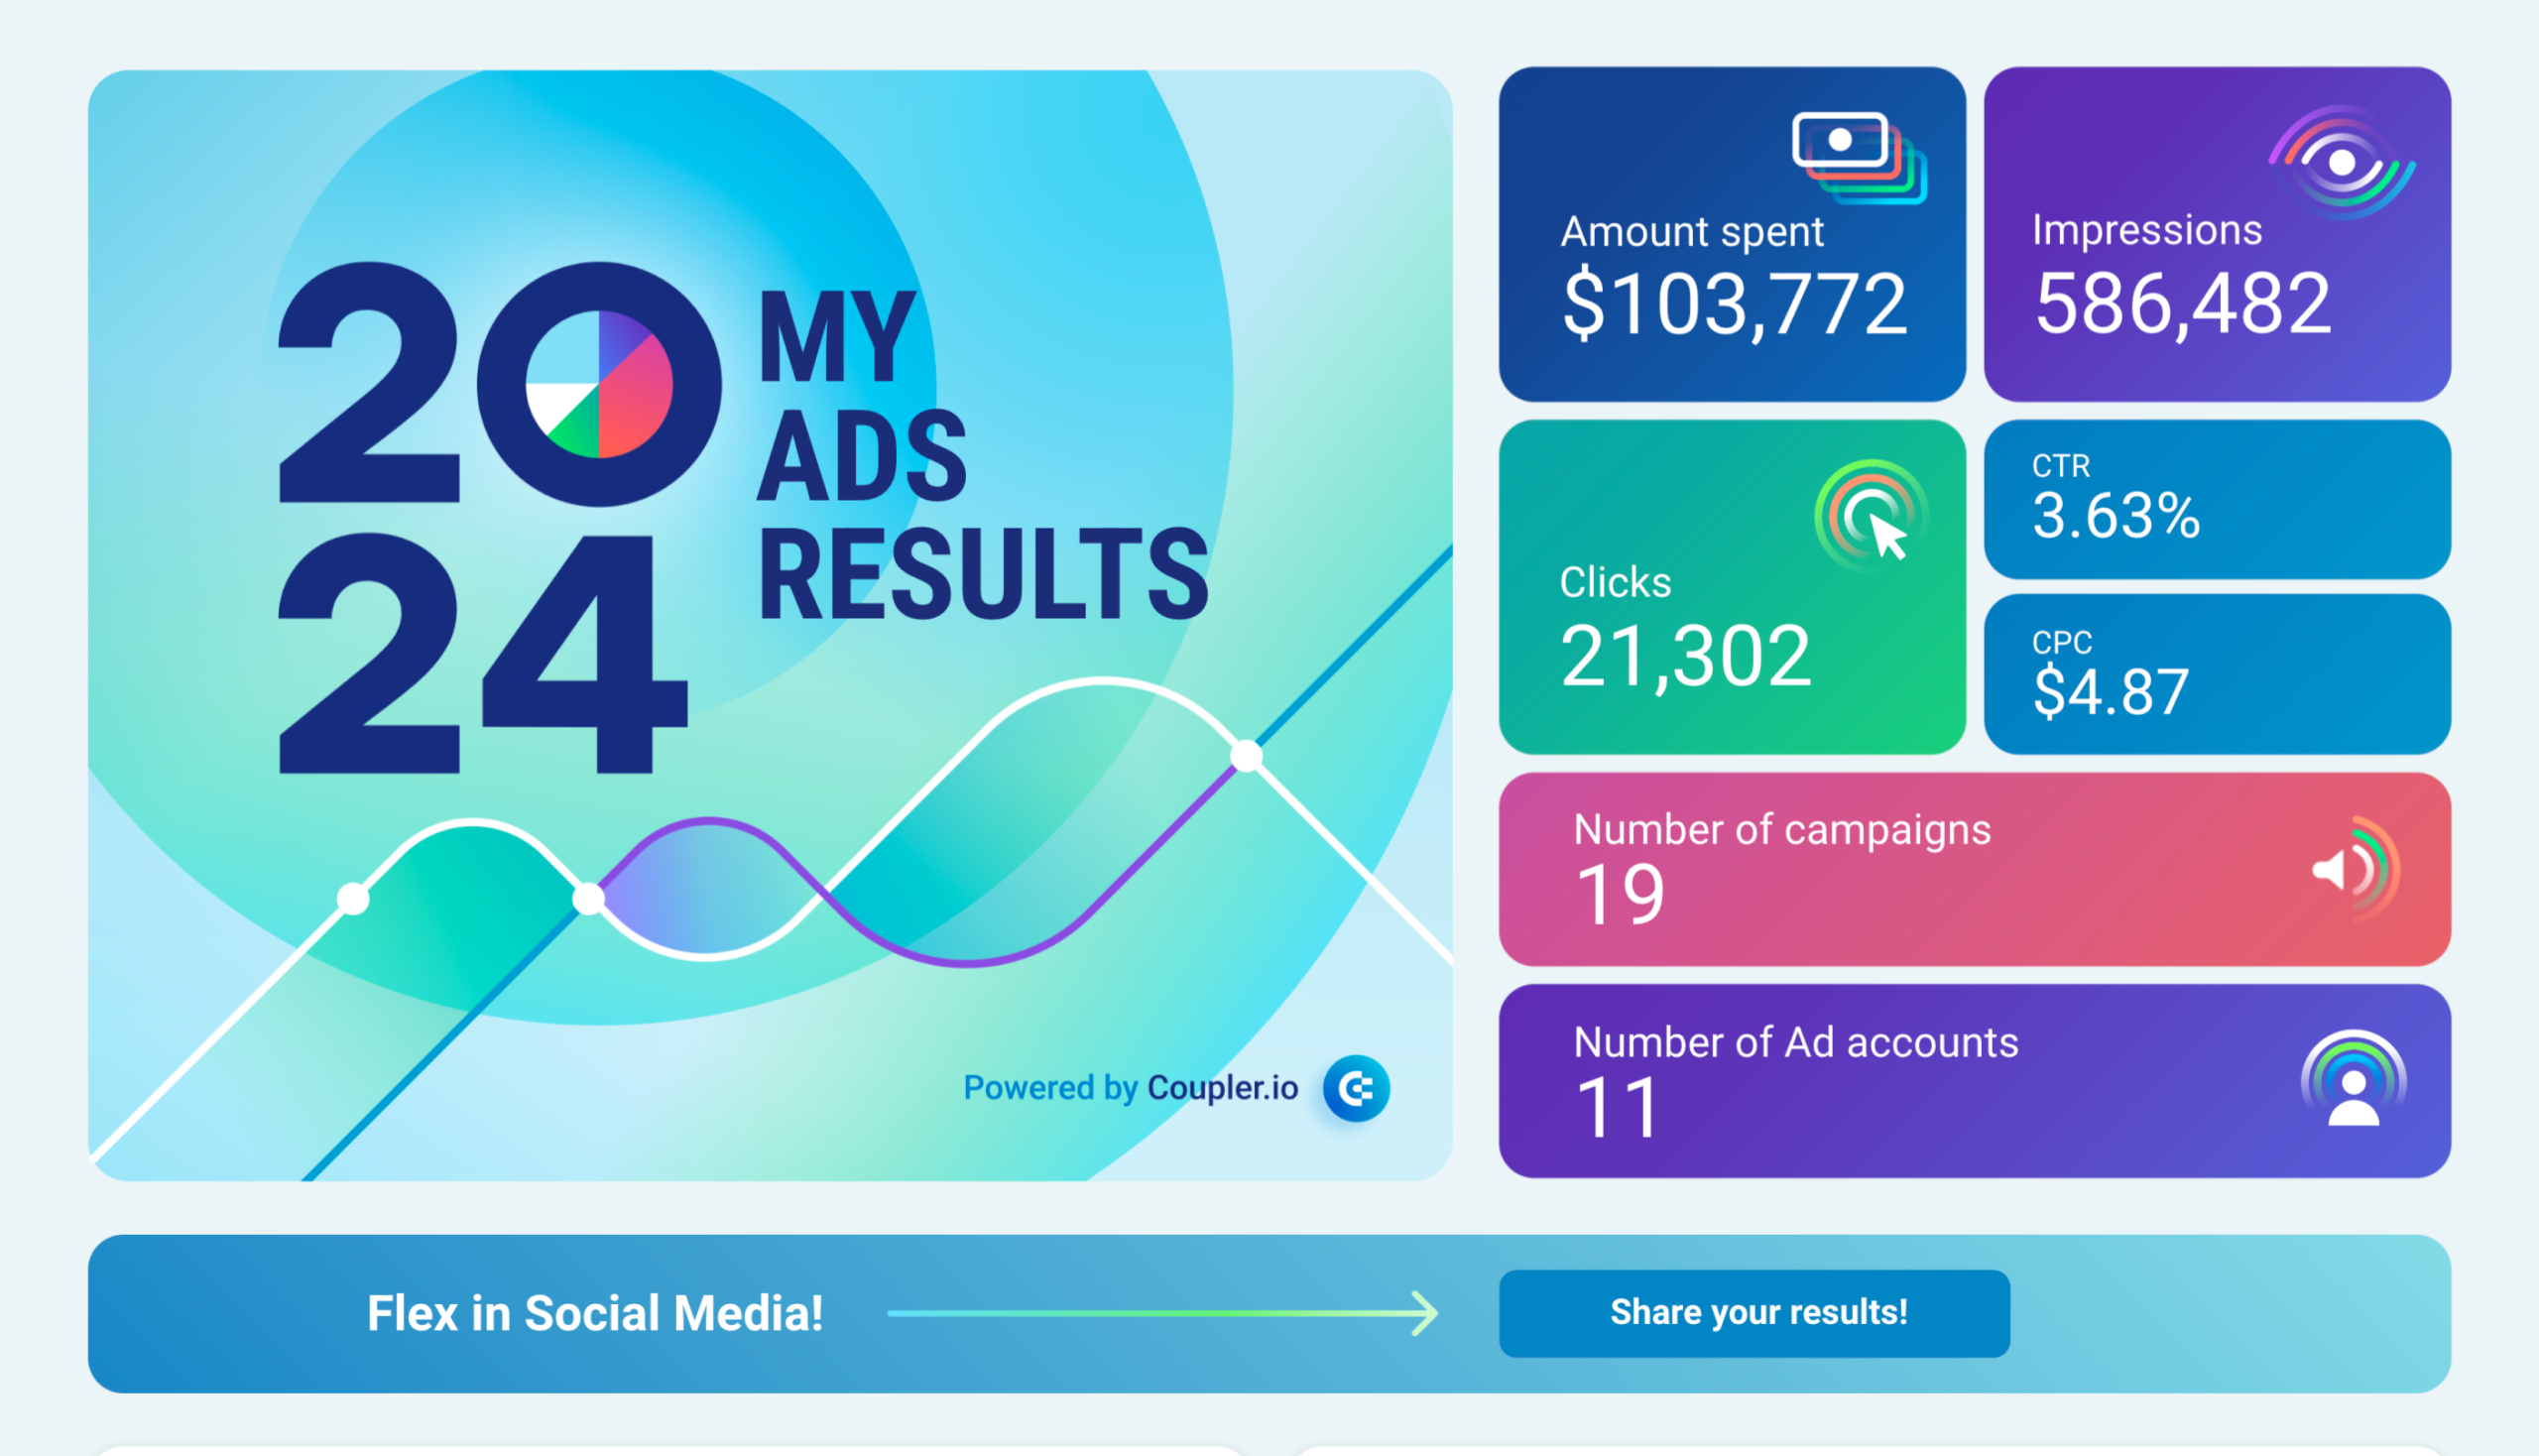
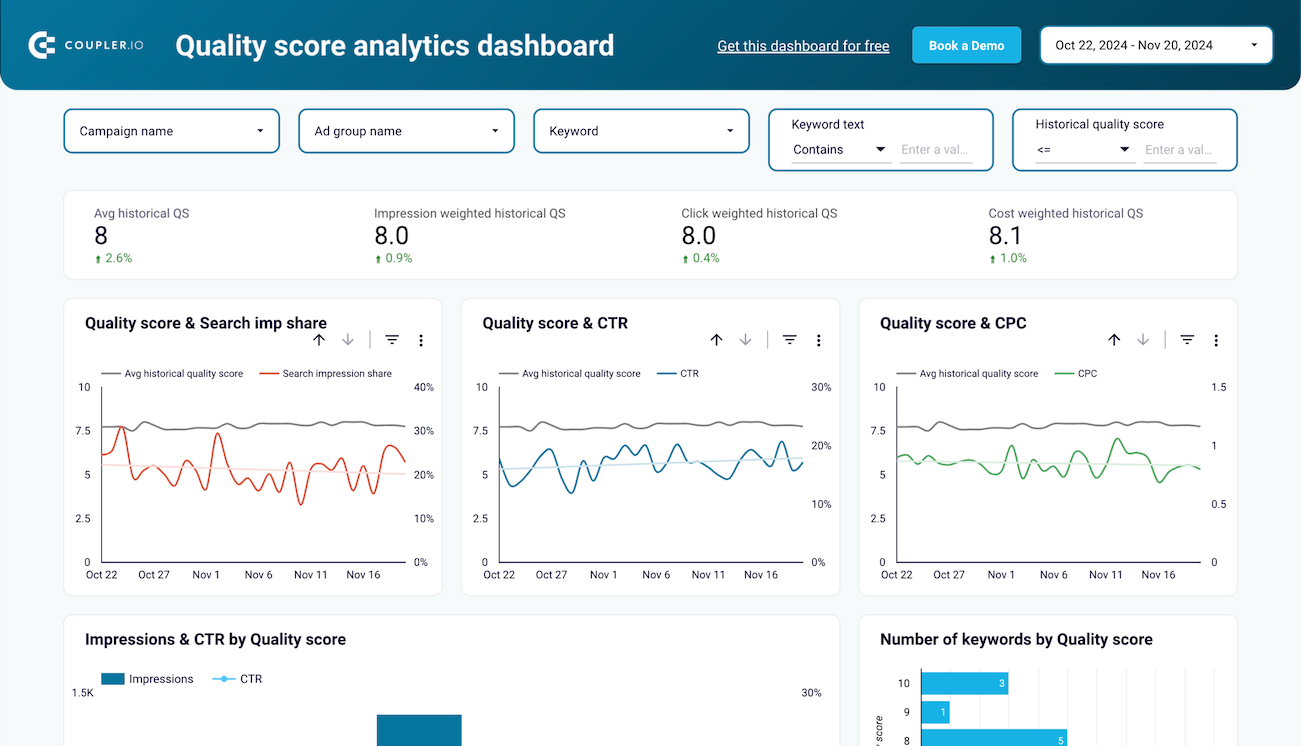
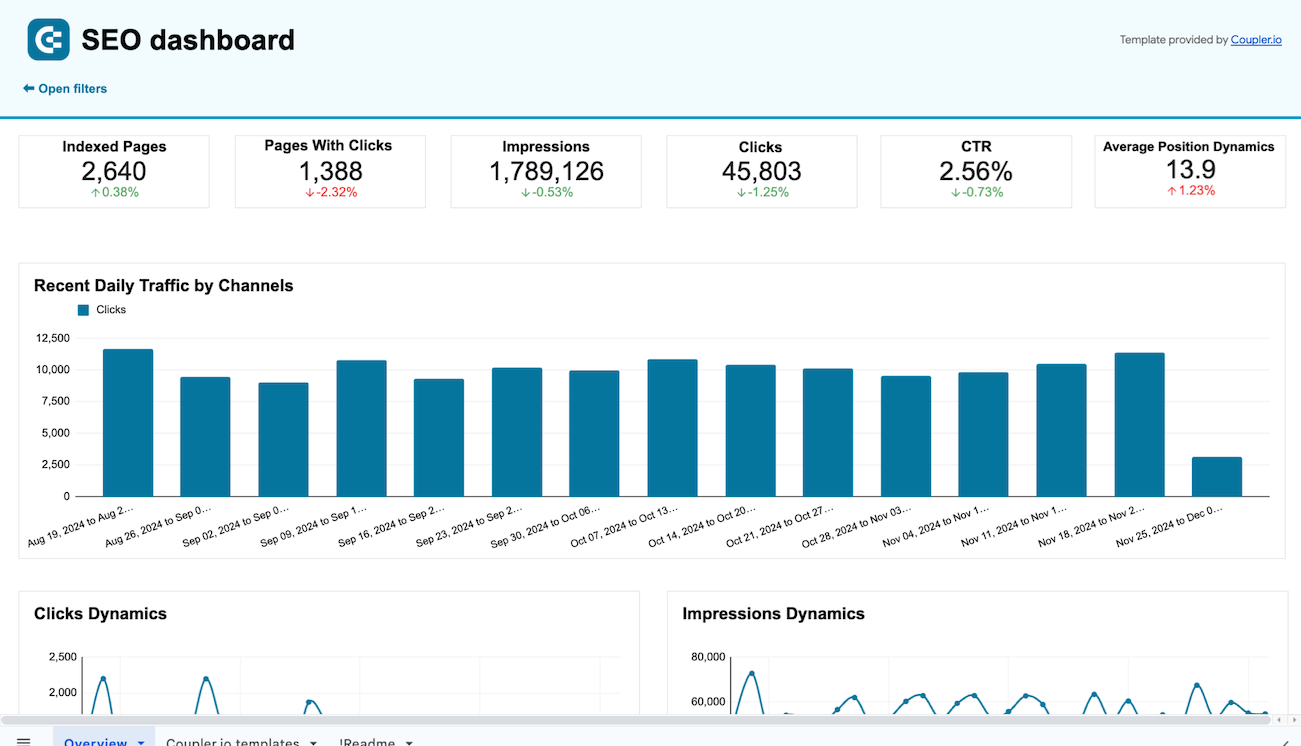
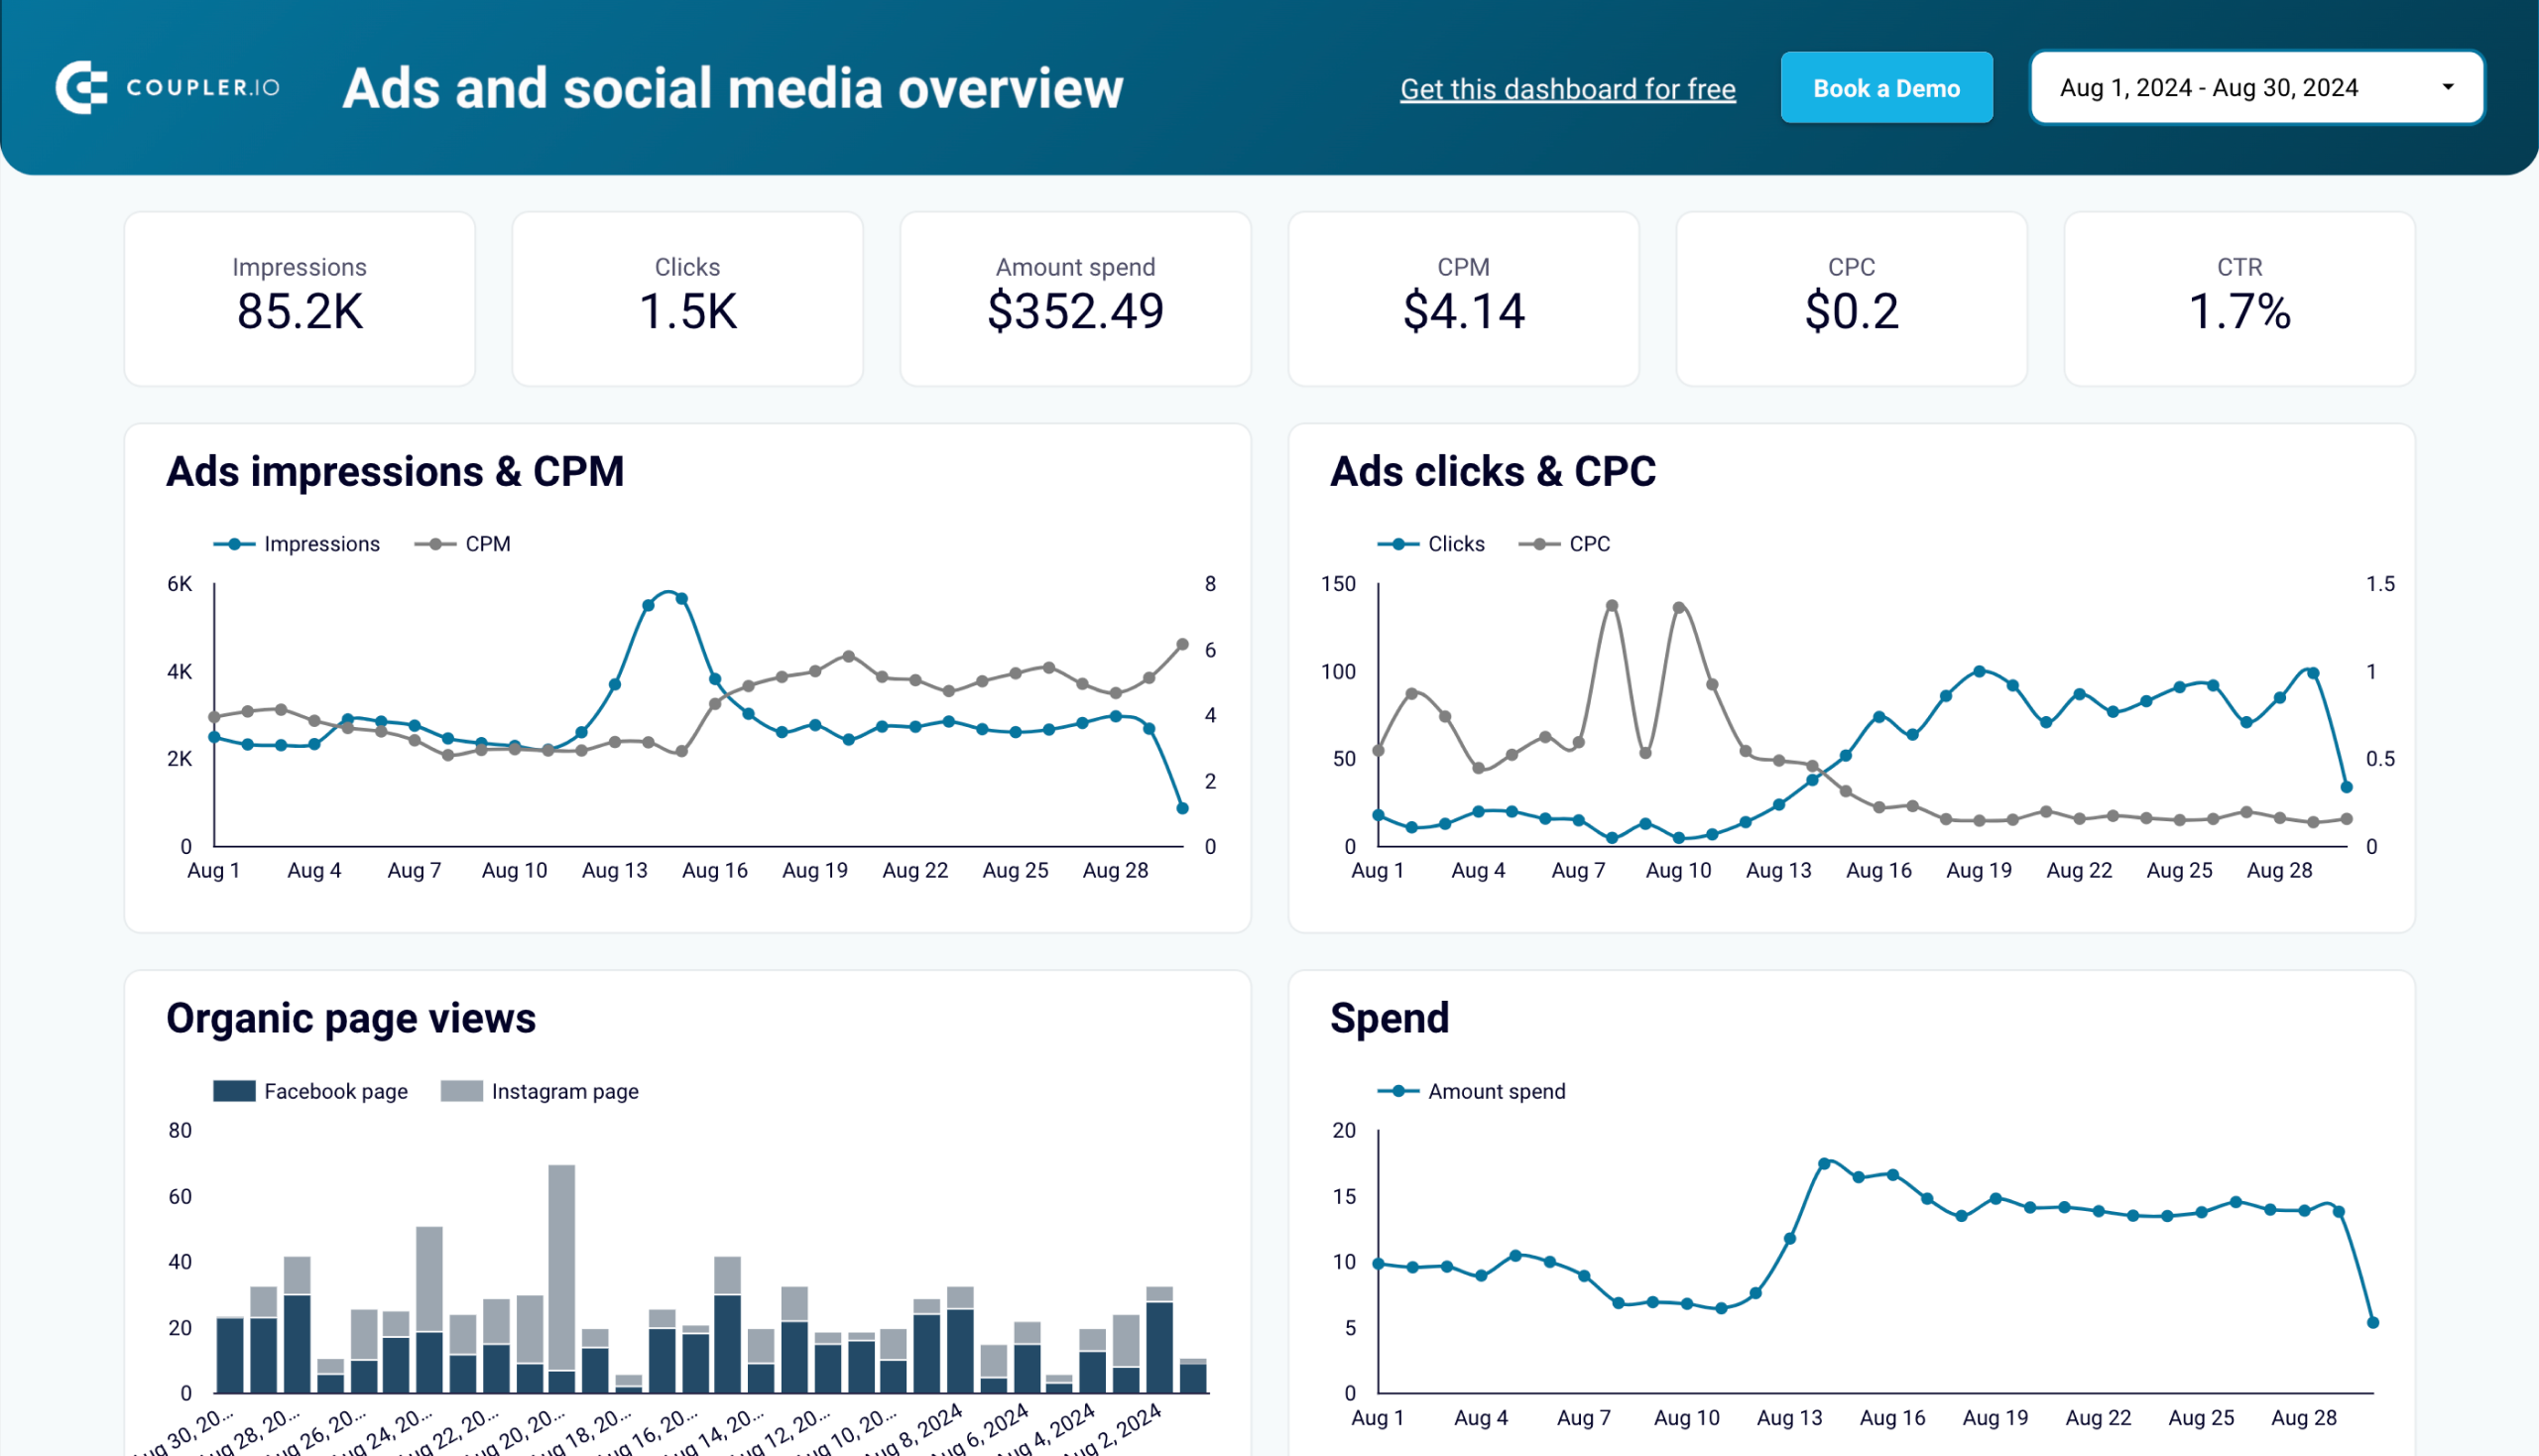
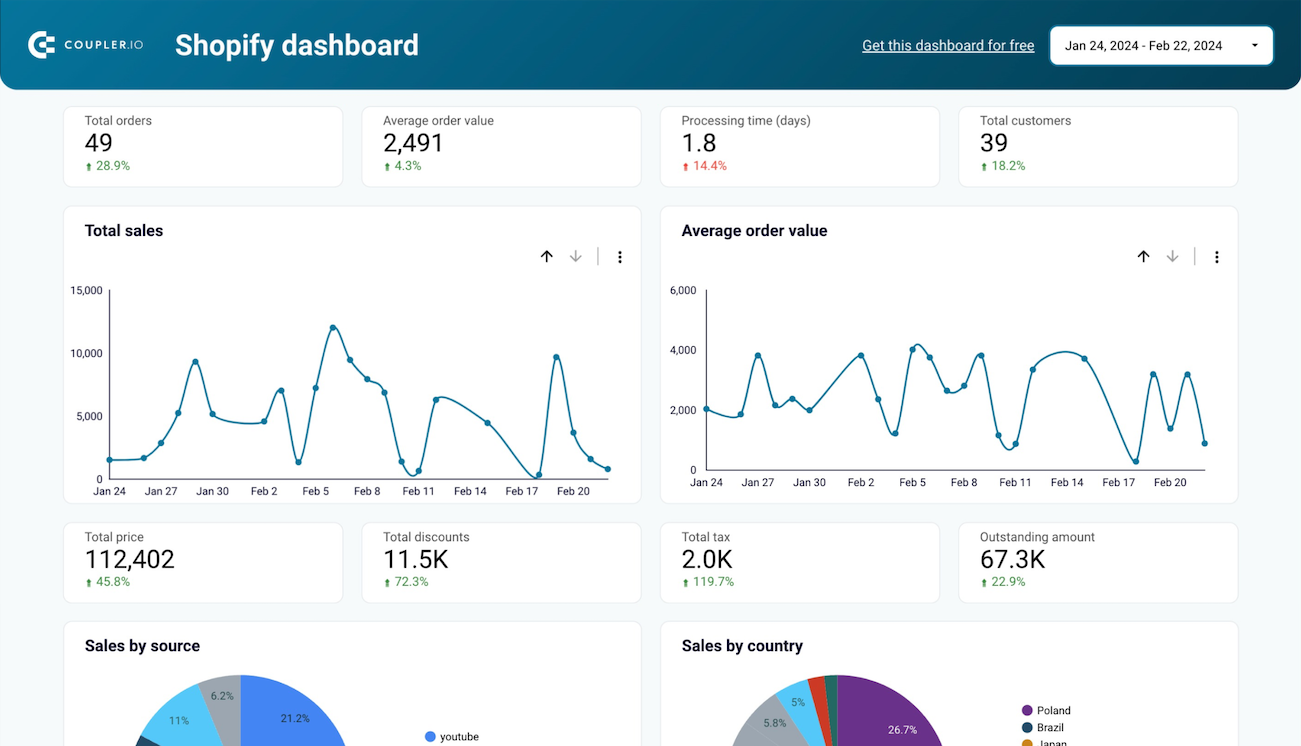
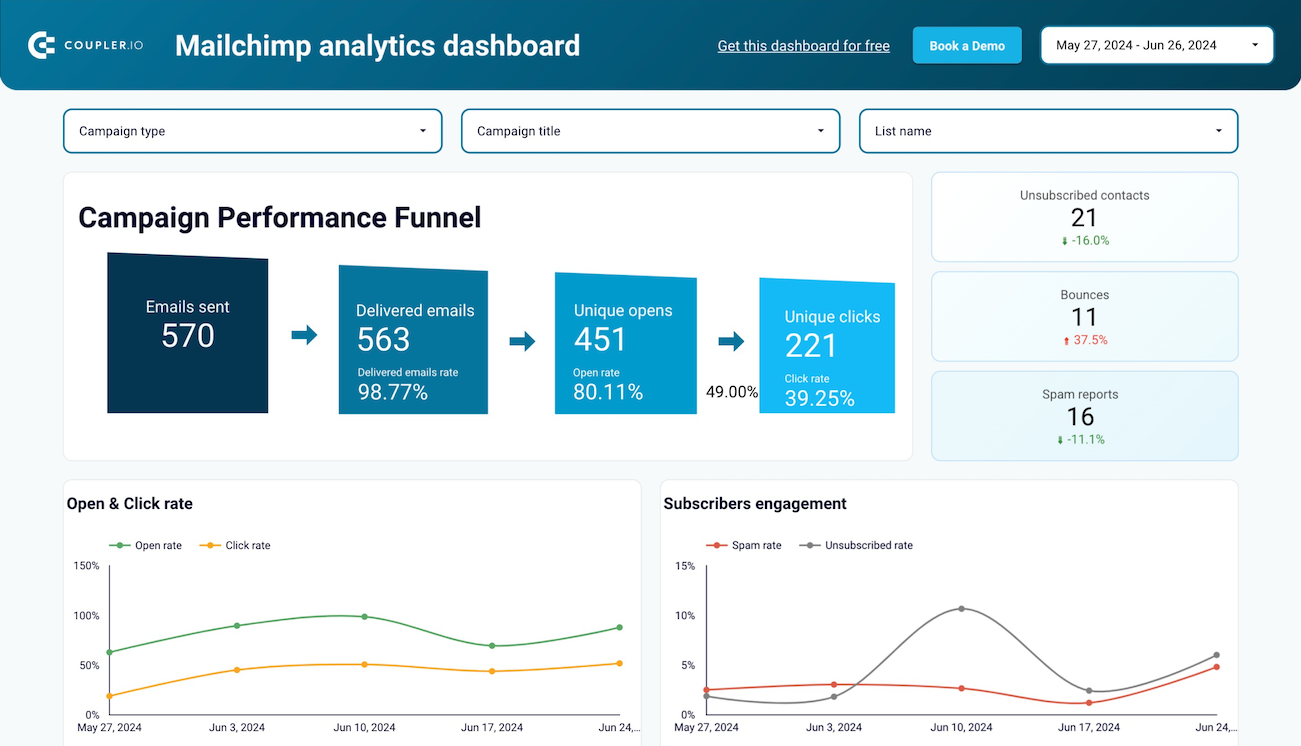
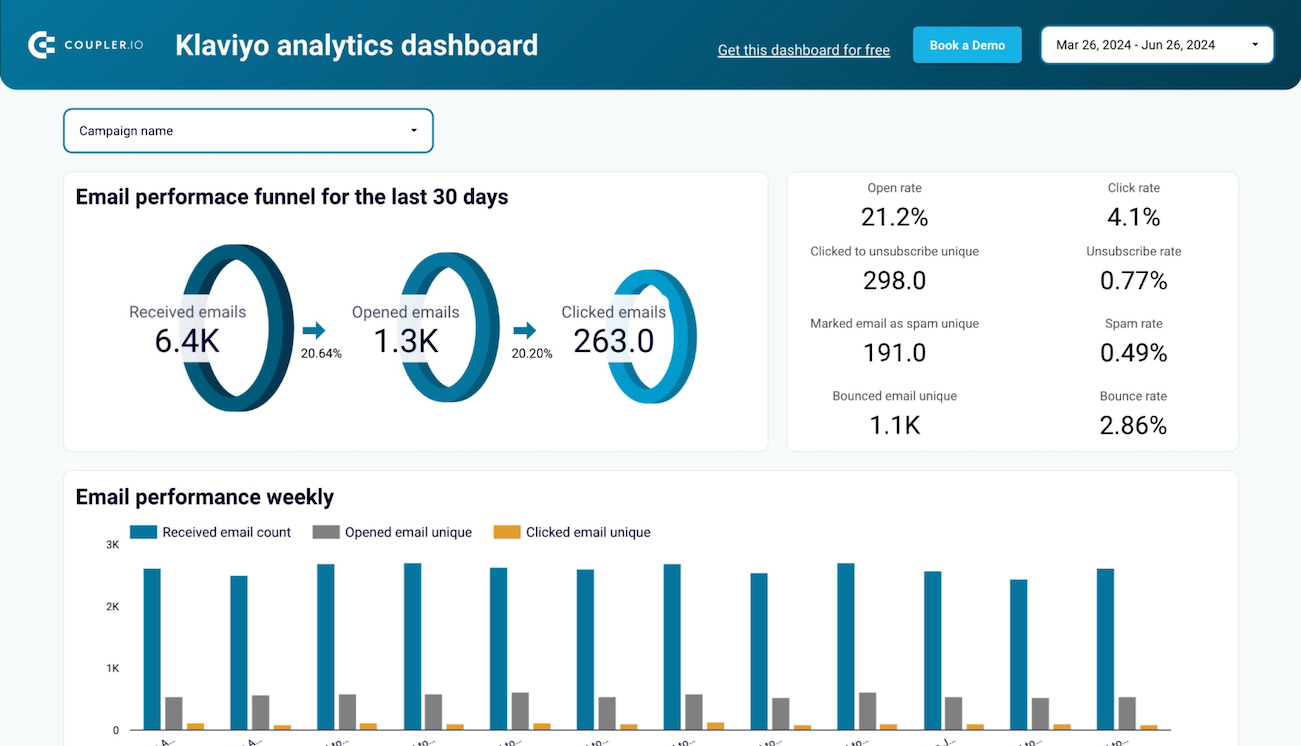
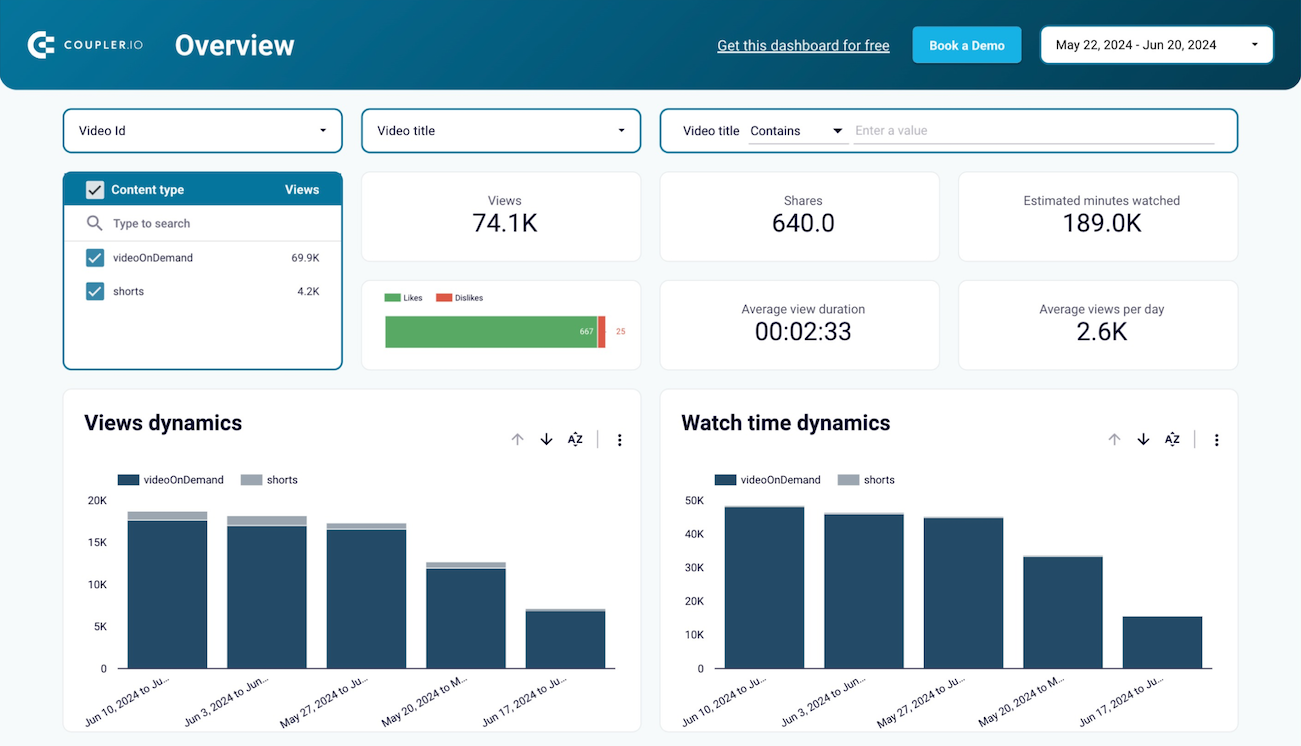
Assess your ad performance across key stages like impressions, link clicks, and leads, allowing you to increase conversion rates at each step of the funnel.

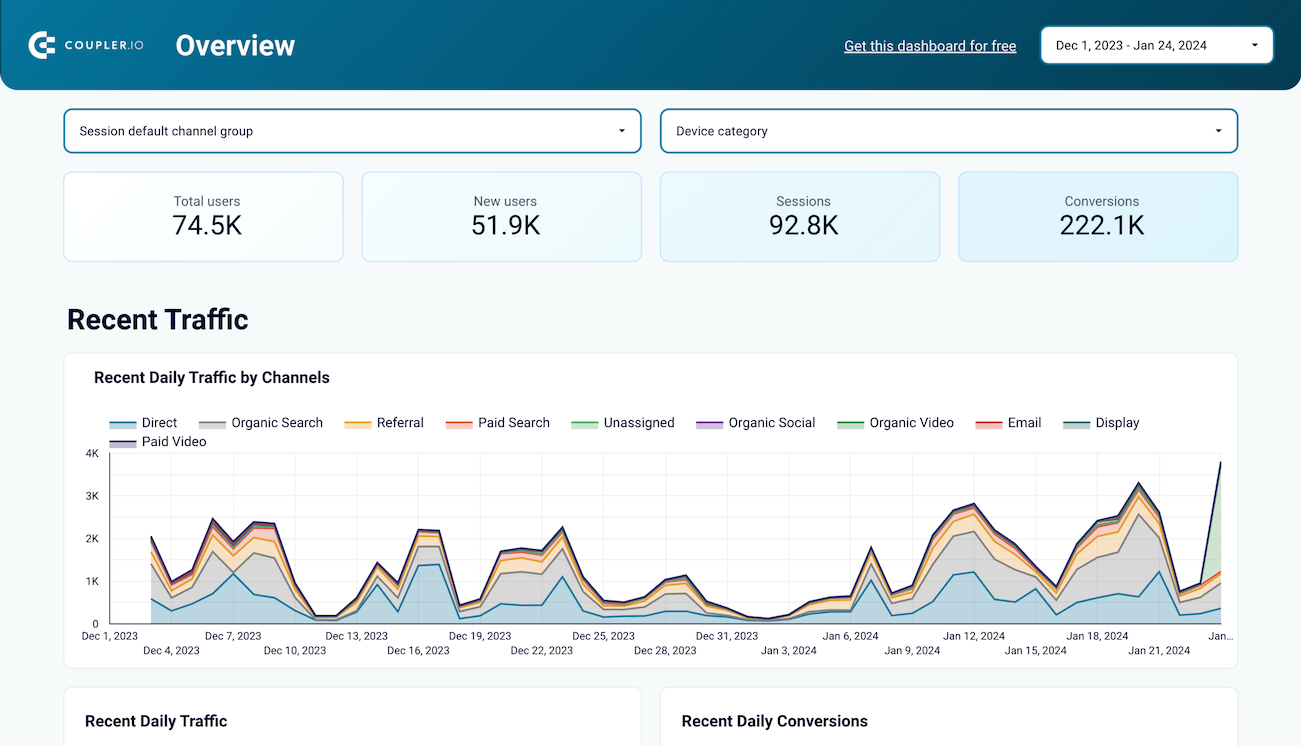
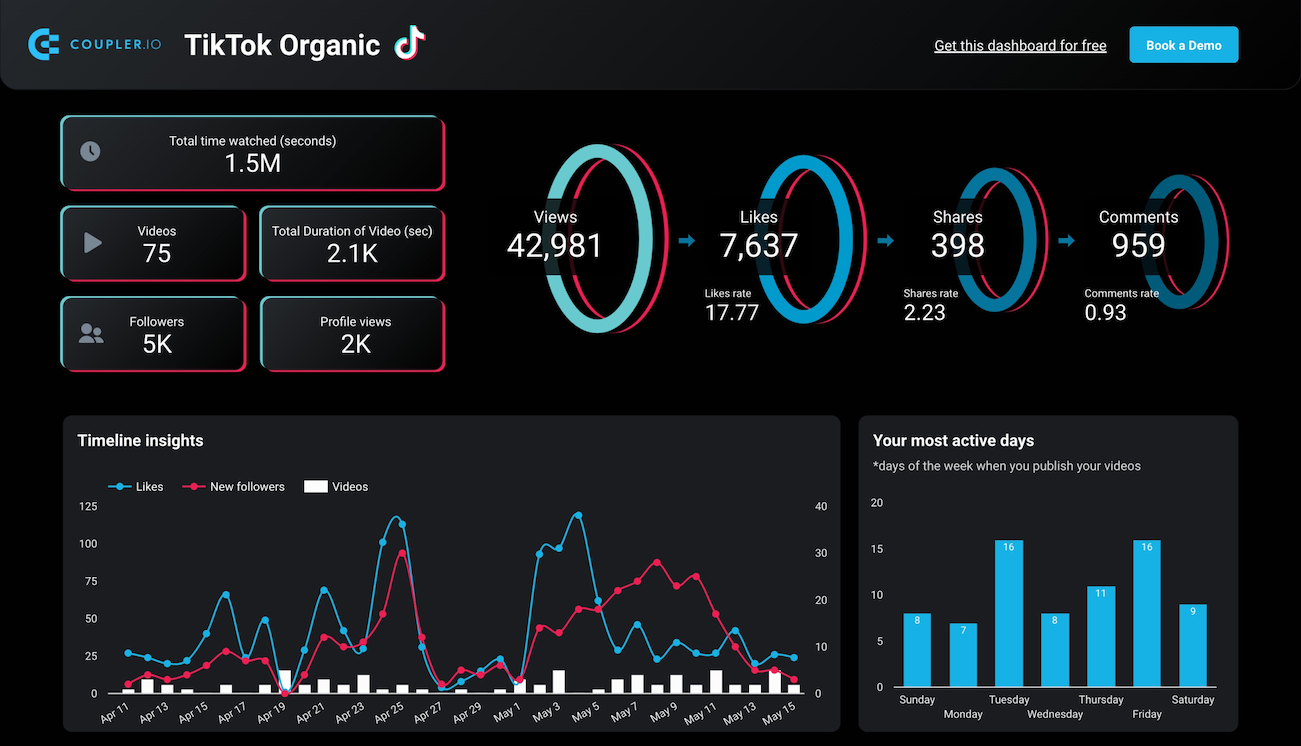
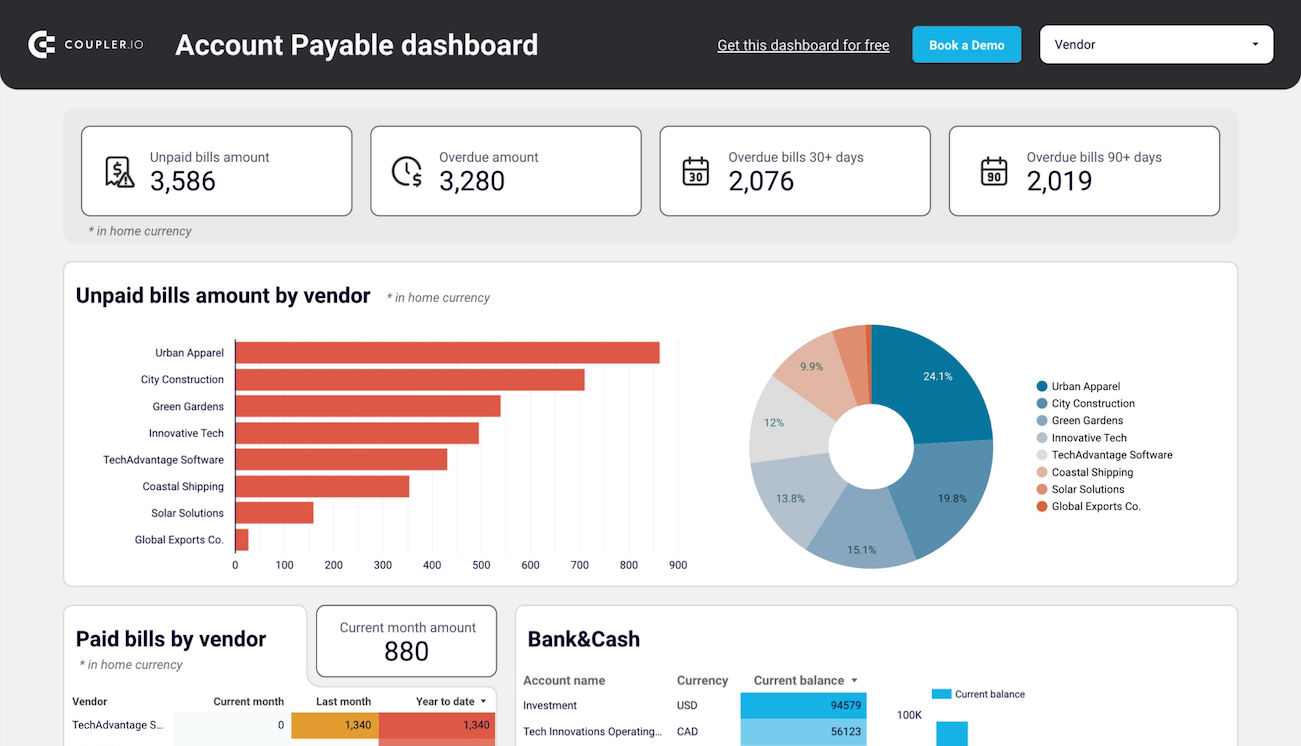
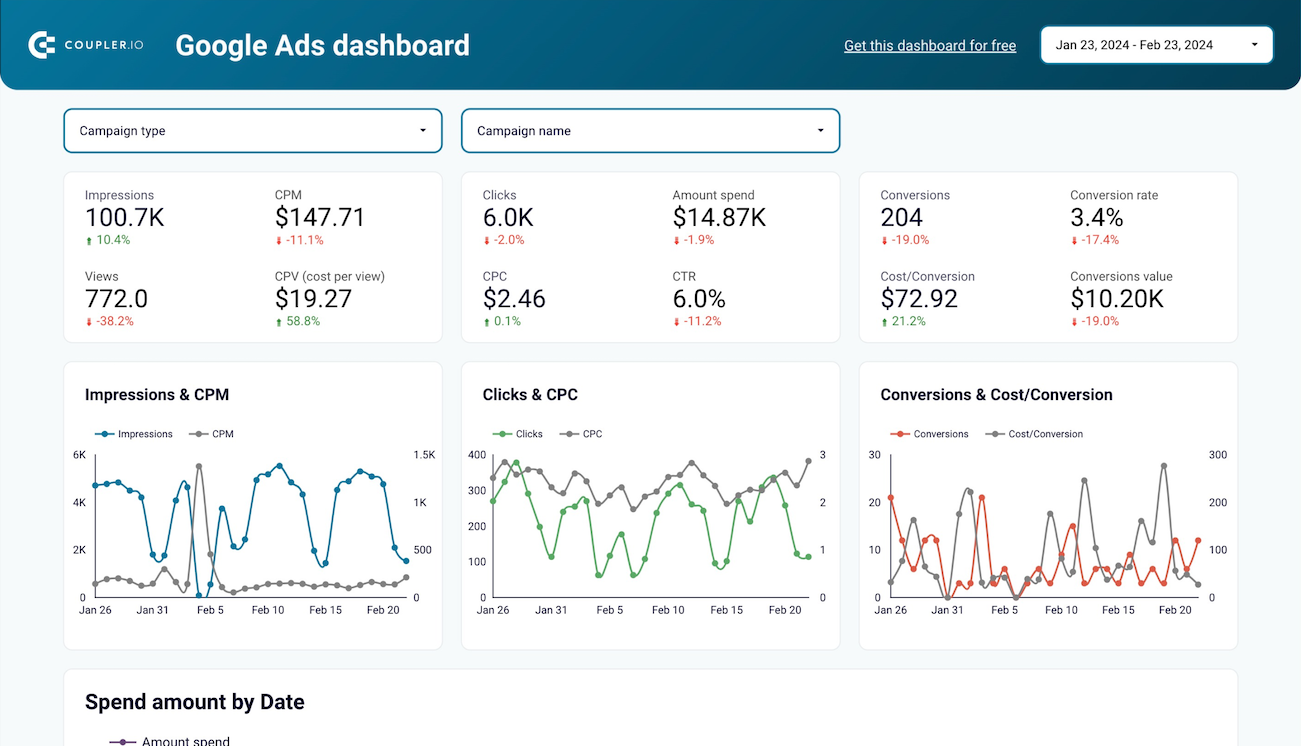
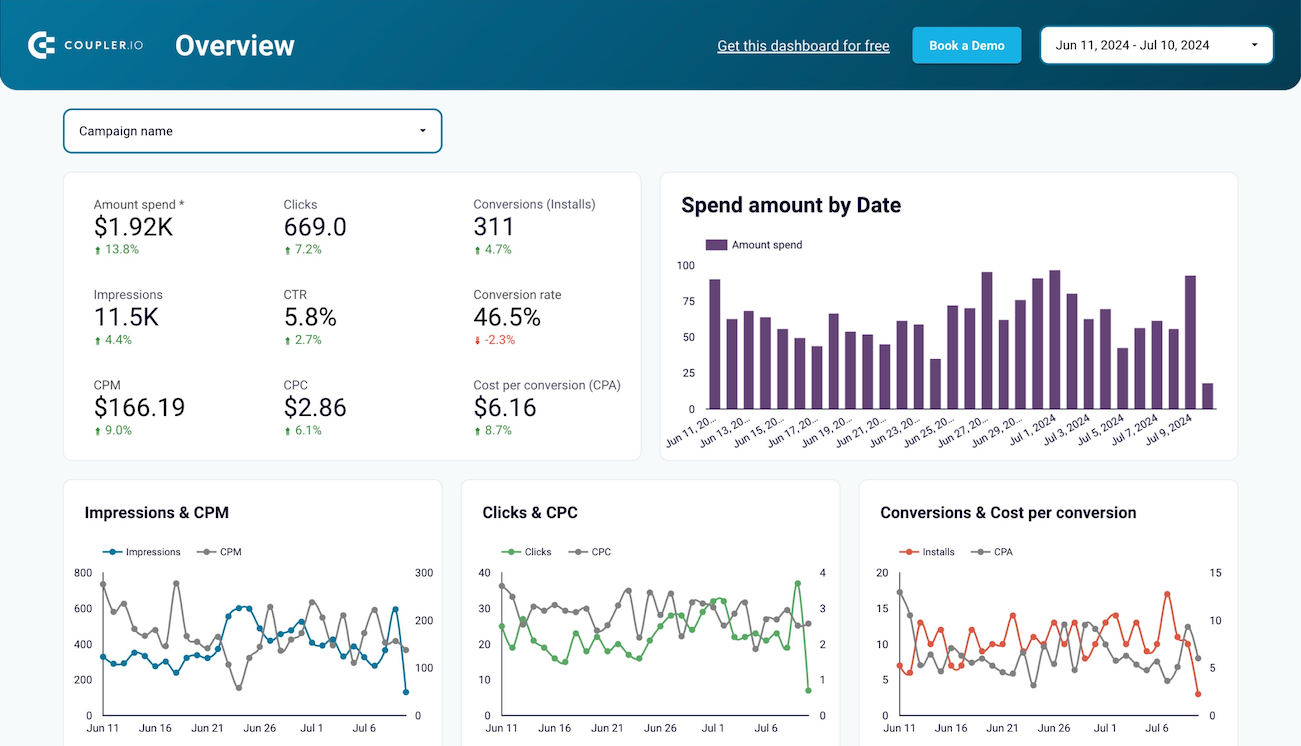
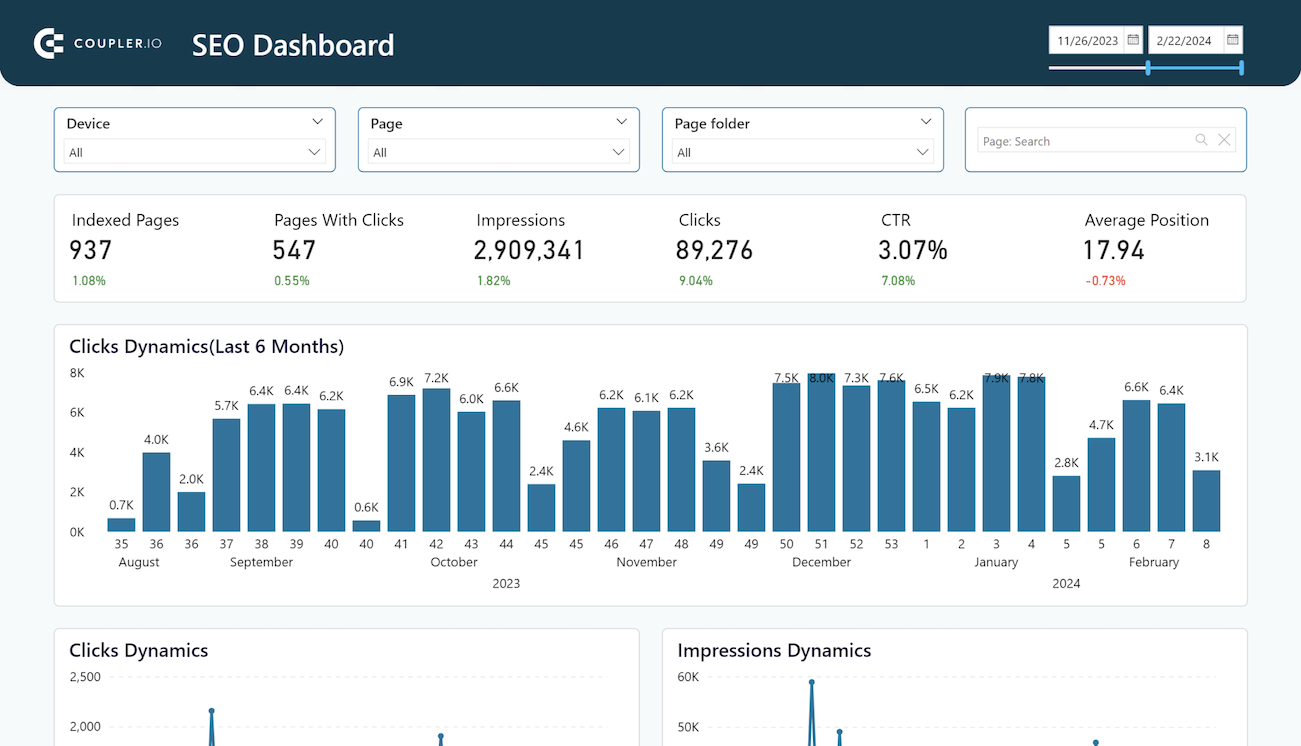
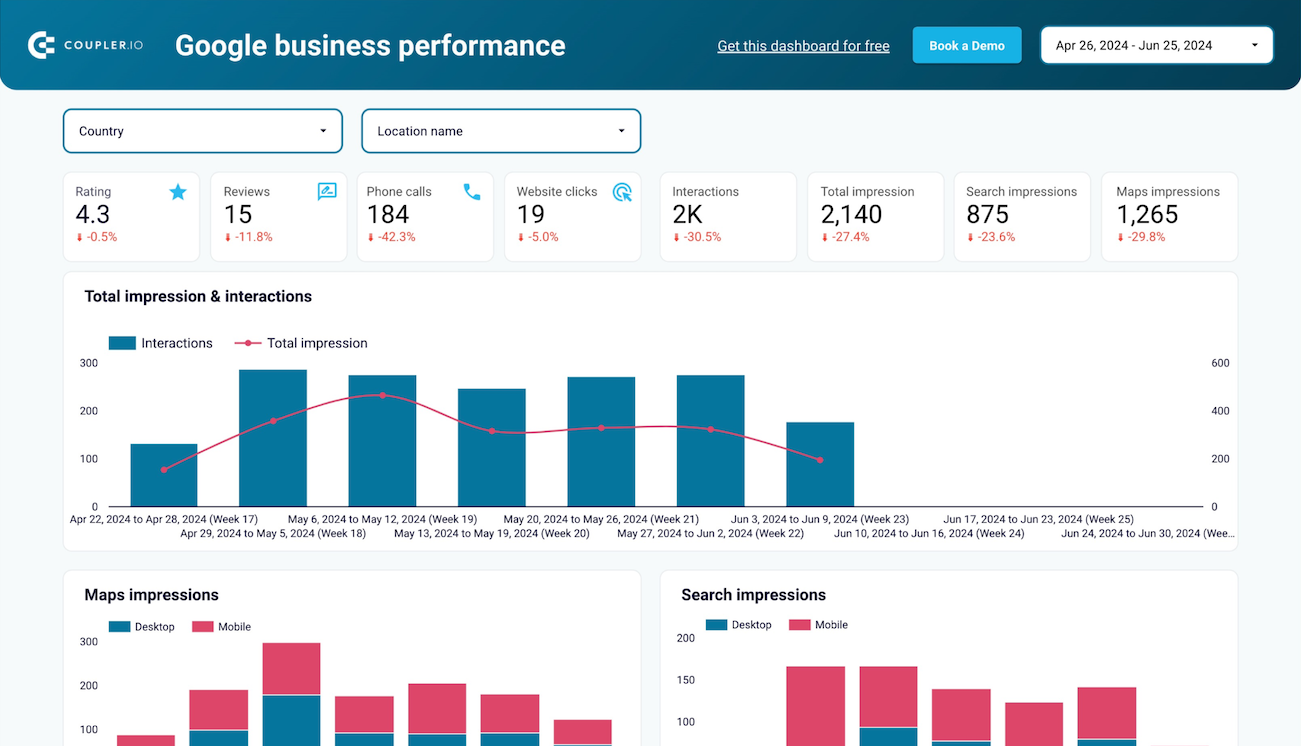
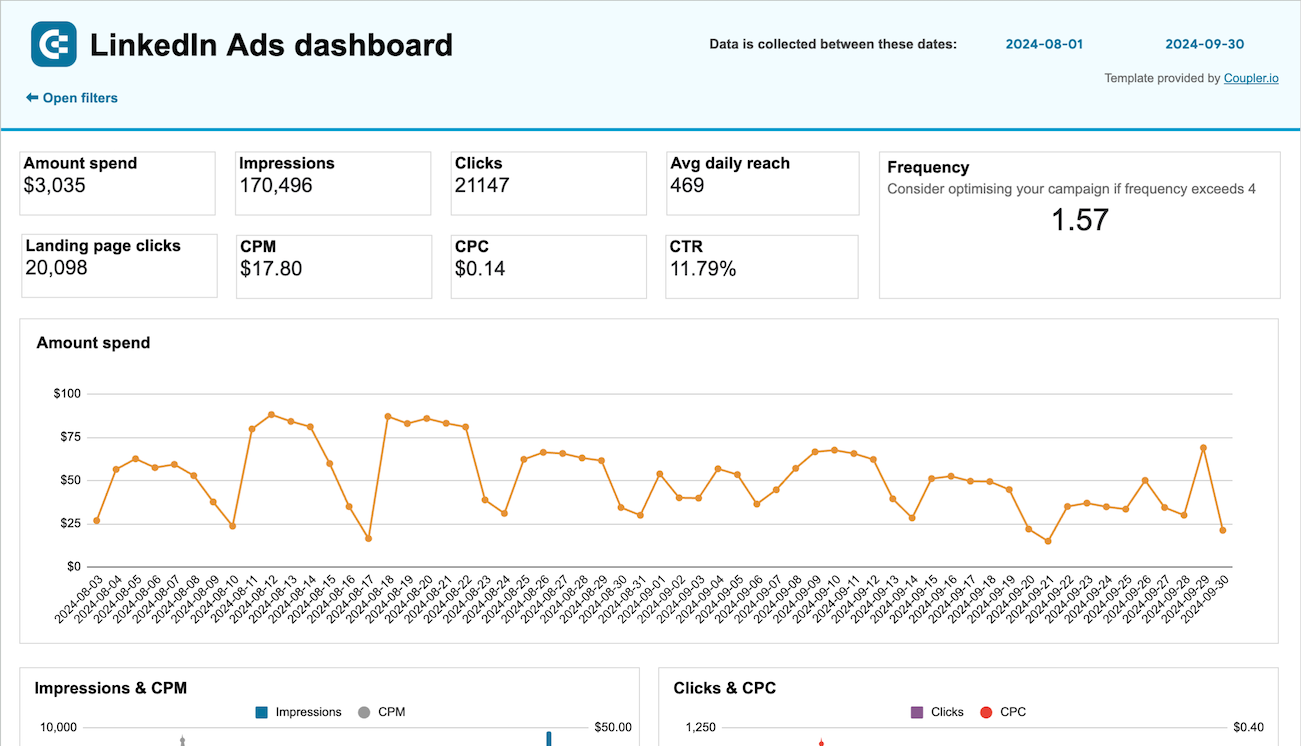
Review cost and performance metrics in a clear timeline to understand how your campaigns evolve, letting you make informed adjustments based on historical trends and real-time data.

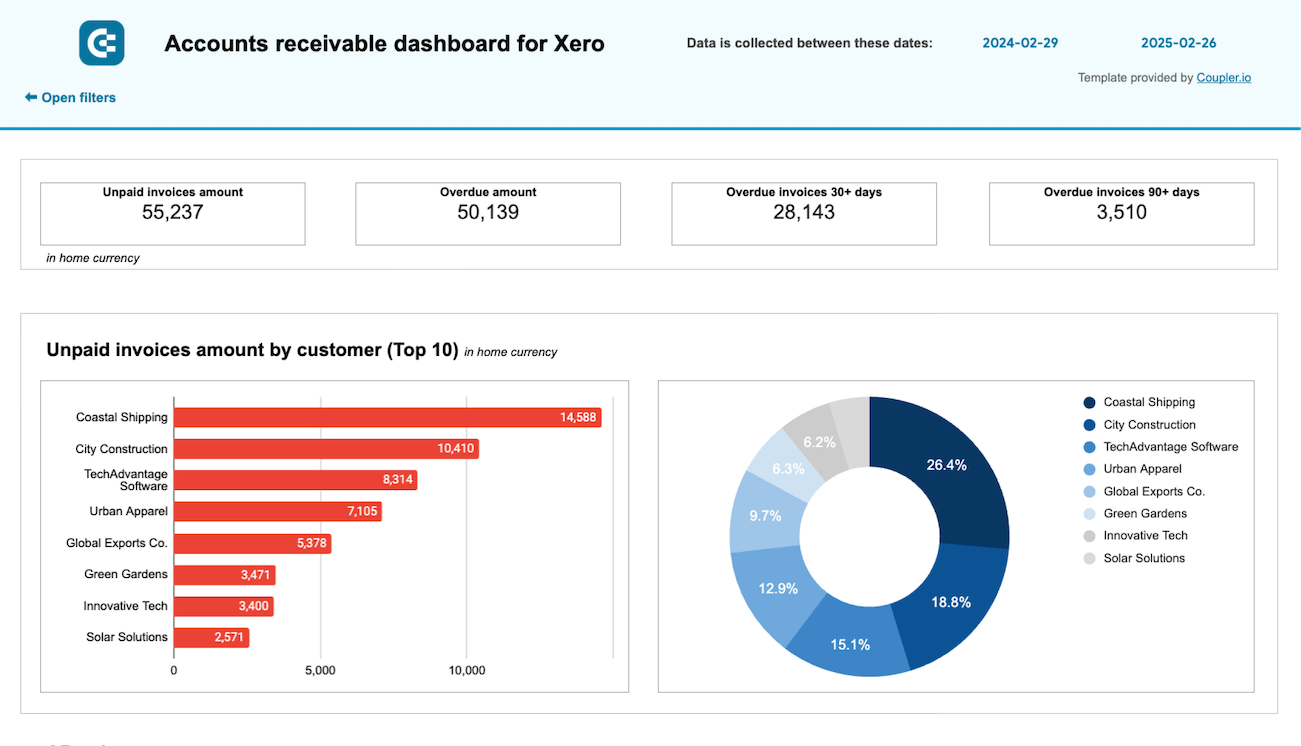
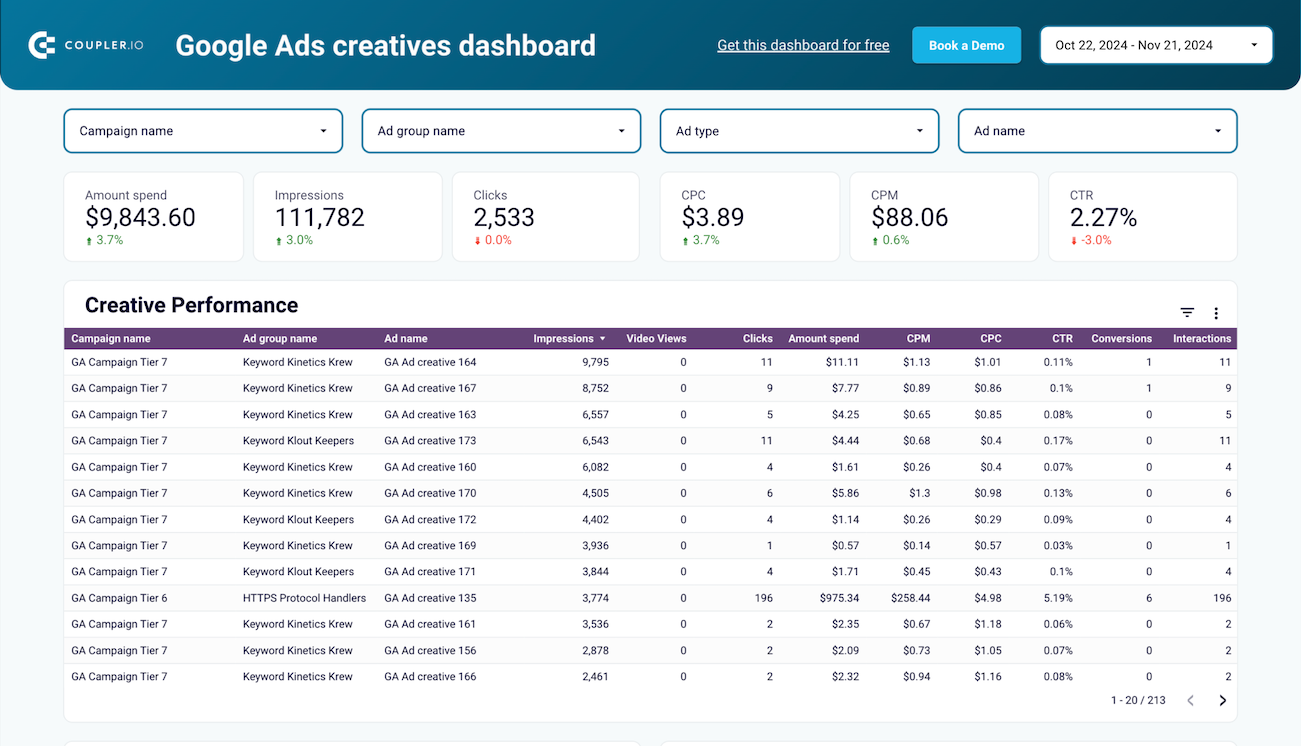
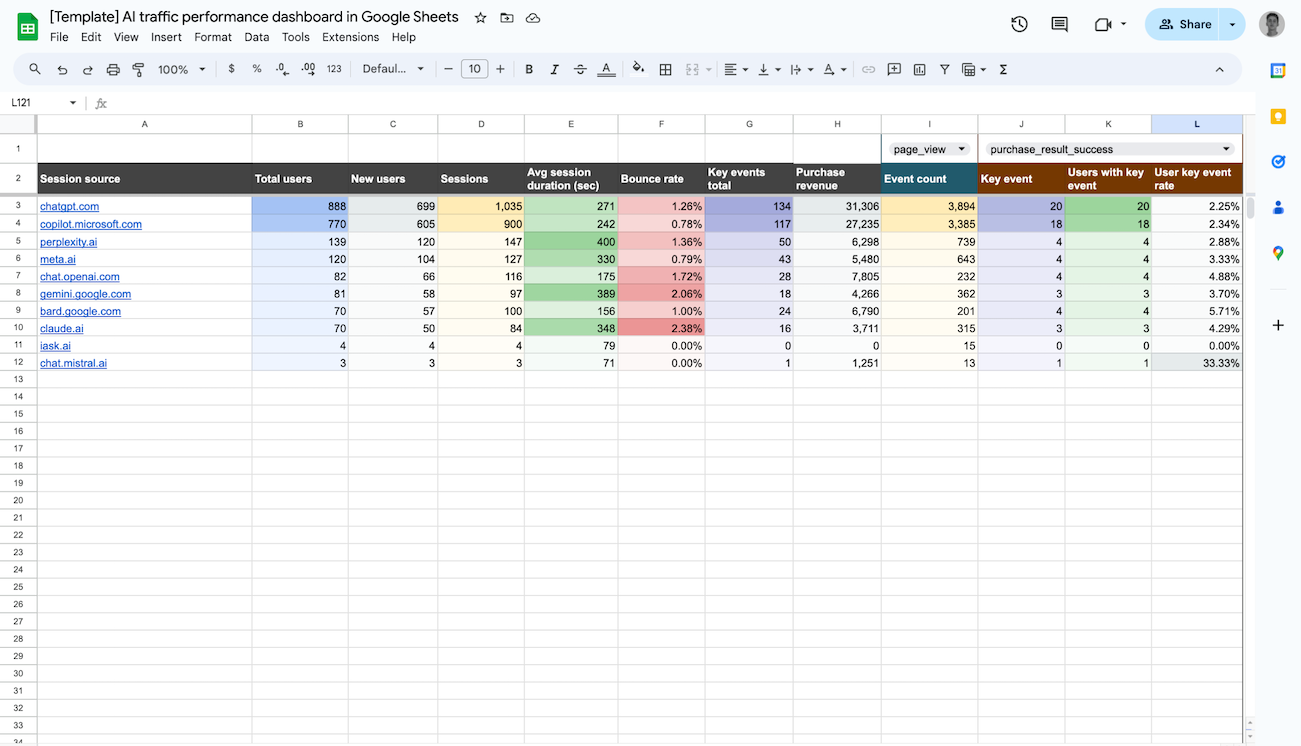
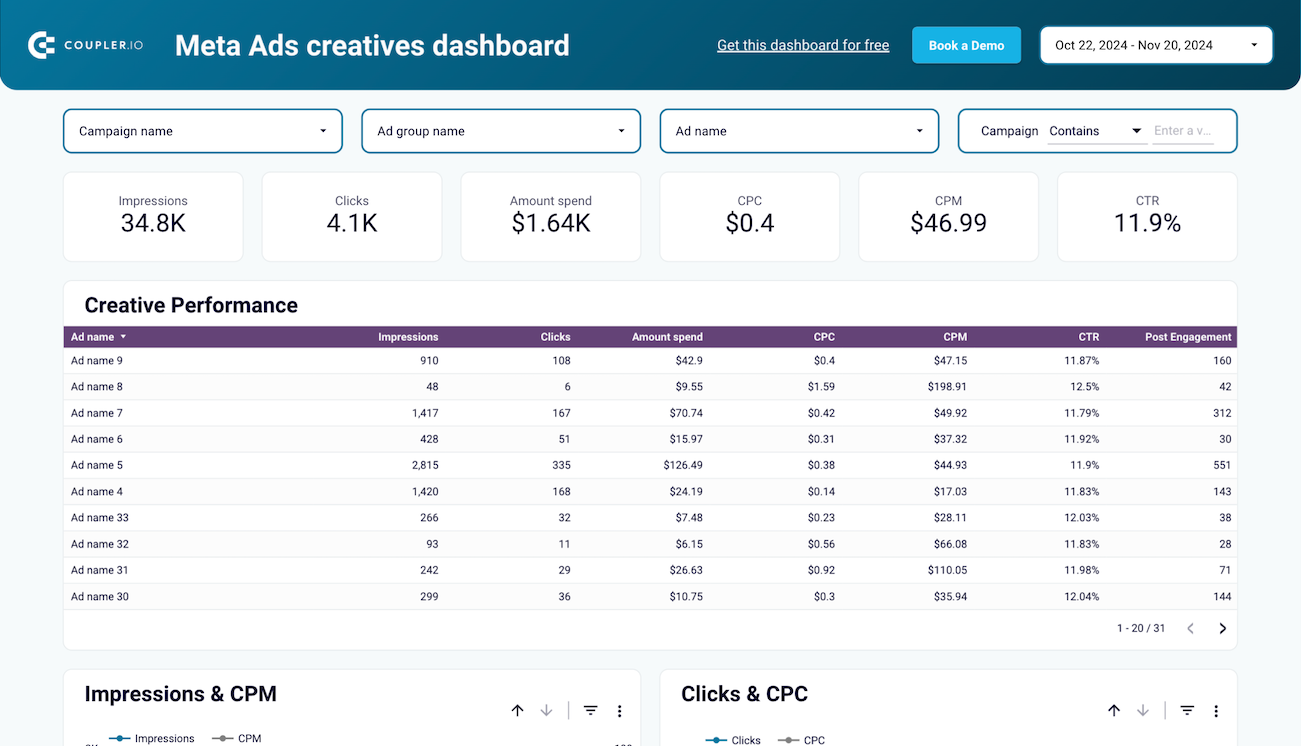
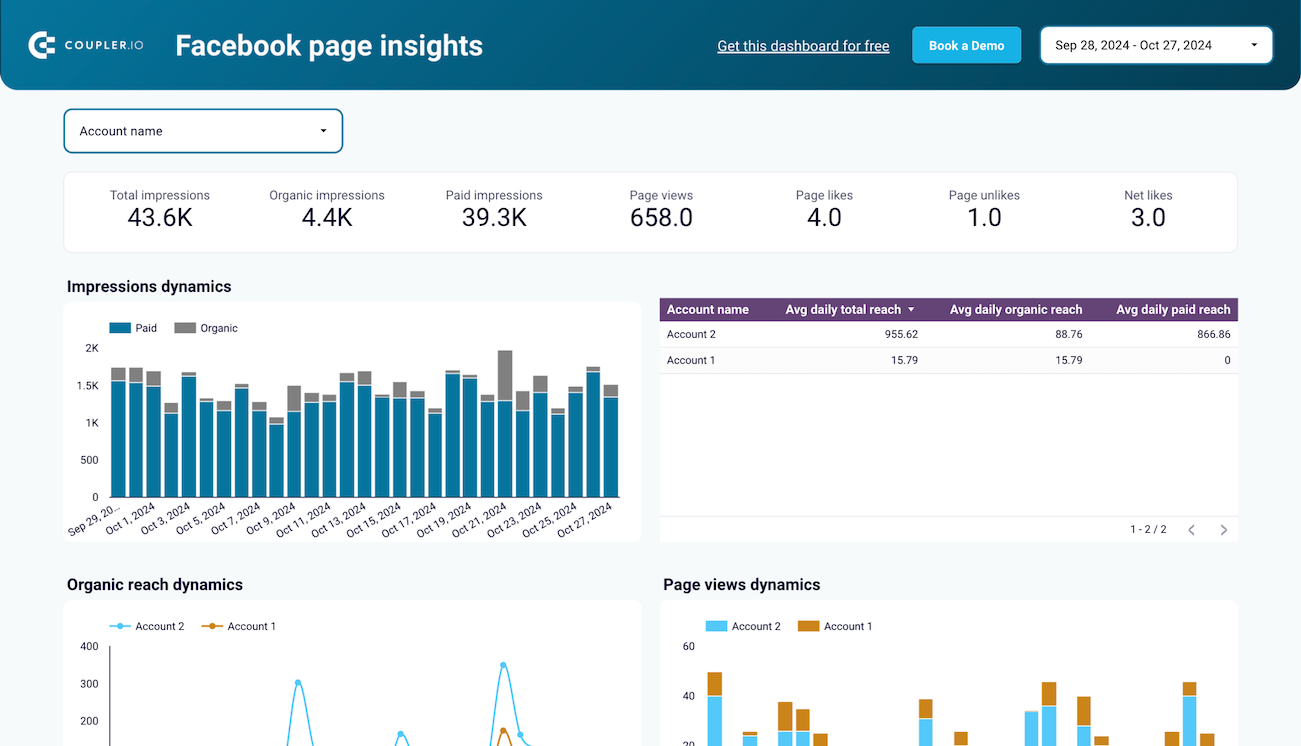
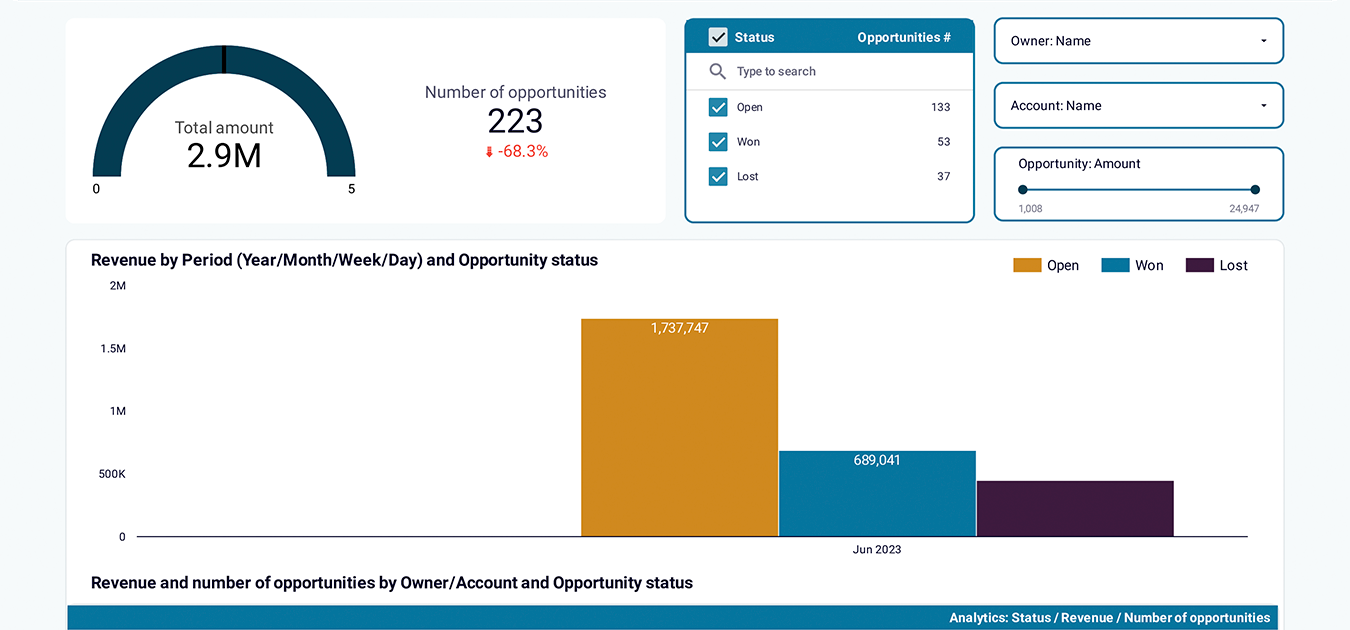
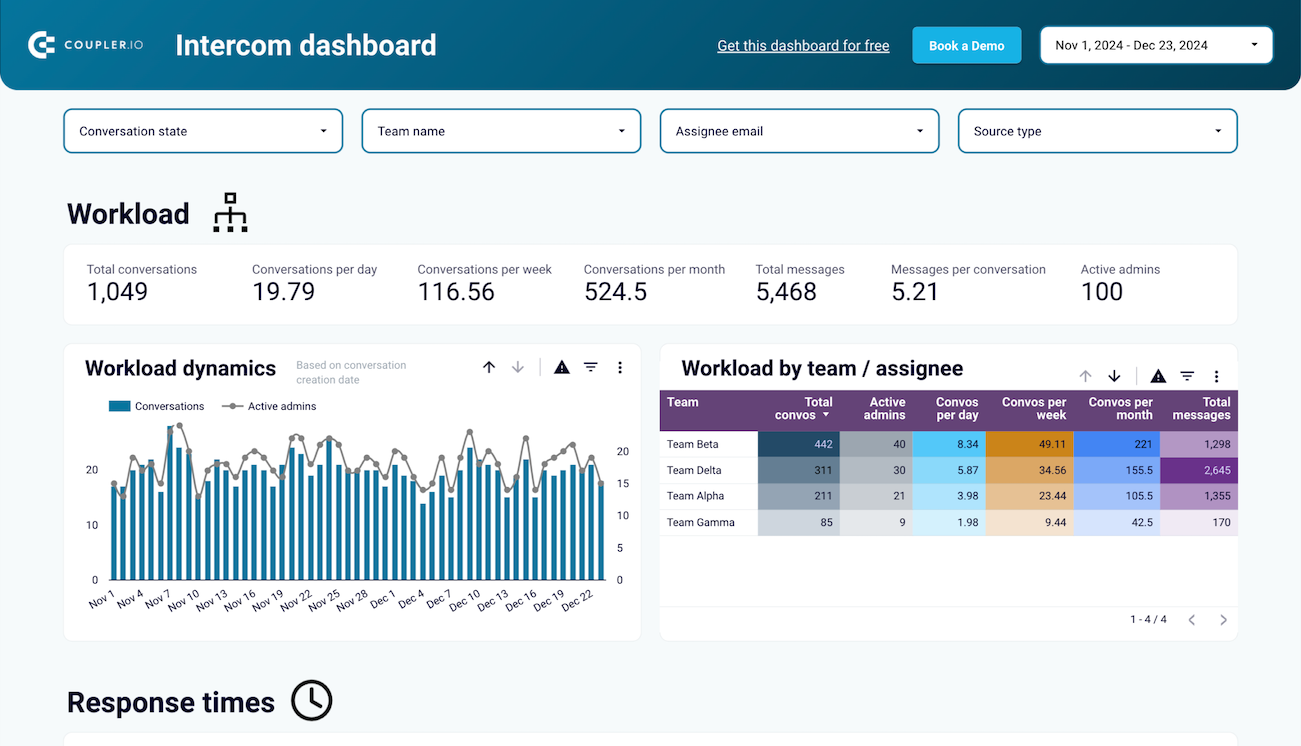
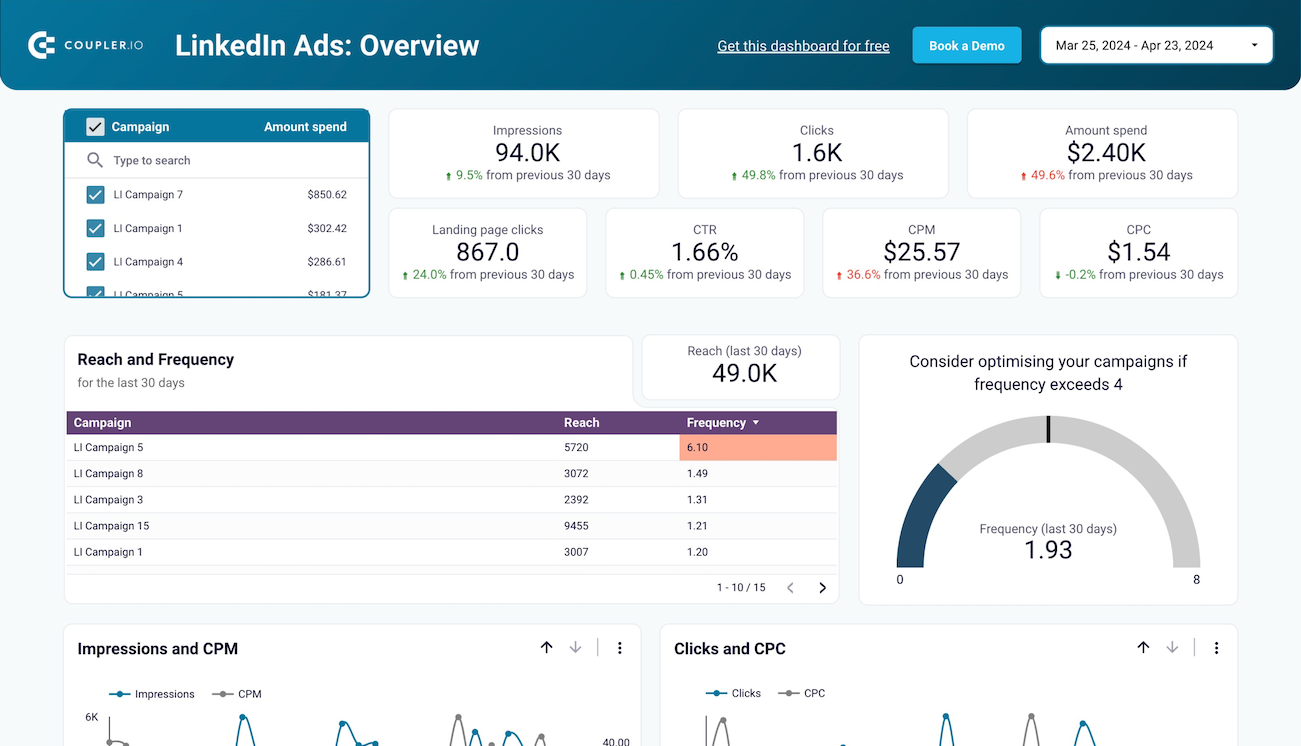
Analyze the performance of each ad campaign to understand which strategies deliver the best results. It may help you refine your approach to maximize engagement and lead generation.

Acquire peace of mind with the interactive Facebook Ads leads breakdown dashboard
Instant access to key insights
No complex setup is required. Simply connect your Facebook Ads data and instantly start tracking leads, ad spend, and performance metrics in a single, easy-to-use dashboard.
Effortless data updates
The dashboard automatically refreshes with your latest Facebook Ads data. Set your preferred refresh frequency, and rest assured your reports always reflect the most recent information.
Fully customizable reports
Adjust metrics, visuals, and layouts to tailor the dashboard to your needs. At the click of a button, share real-time lead performance insights with your team or stakeholders.
No need to build a Facebook Ads leads breakdown dashboard from scratch.
Use the fully automated template!
Check out the Coupler.io dashboard gallery


about your case. It doesn't cost you a penny 😉
Metrics you can track with the Facebook Ads leads breakdown dashboard

