

Export Facebook Ads data to Google Sheets
Use Coupler.io for hassle-free data export from Facebook Ads to Google Sheets without any coding. Organize your ads data in the form of insightful marketing reports to understand your ad performance and power your decisions with data.
Step 1
Set source basics

Step 2
Set destination

Setup data integration within seconds
Source application
Facebook Ads
View all available apps on Data sources page
Metrics & dimensions
Period
Destination application
Google Sheets
View all available apps on Data destinations page
Connect Facebook Ads to Google Sheets with Coupler.io to simplify marketing reporting
Get and prepare data effortlessly
Effortlessly collect, organize, and load your Facebook Ads data to Google Sheets without coding. Apply custom data filters, hide unnecessary columns, and join data from multiple sources all within a single Coupler.io interface. Experience the ease of organized data and A-level support.
Automate reporting tasks
Set a schedule to export Facebook Ads data to Google Sheets automatically eliminating manual work. Build comprehensive multi-channel reports with data from different ad platforms using one connector. Use our ready-to-go dashboard templates for a quick start or craft custom reports.
Stand out as a data-driven expert
Become a data-driven marketing expert who does not waste time on tasks that can be automated. Delegate your reporting routine to Coupler.io and allocate more time to impactful activities. Derive insights from your Facebook Ads data and share your self-updating reports with stakeholders for better collaboration.
Export data from Facebook Ads to alternative destinations


Quick start with PPC dashboard templates

Facebook Ads dashboard

PPC monthly budget by campaign group - dashboard


PPC monthly budget dashboard
No such template is available yet.
No worries. Our team will create a template that fits your needs, just tell us more
about your case. It doesn't cost you a penny 😉
Request a custom report
about your case. It doesn't cost you a penny 😉
Automate data exports from Facebook Ads to Google Sheets with just a few clicks.
Connect similar PPC apps and get data in minutes


Facebook Ads data to Google Sheets: what to export

Reports and Insights
Reports and insights can easily be exported from Facebook Ads to Google Sheets which gives a wide range of performance metrics for ads such as impressions, click-through rate, cost per click, and many others. With the integration, you will receive an analysis regarding ad effectiveness that facilitates the detection of trends, and strategy enhancement. This will let you improve future campaigns based on the existing data and insights of the audience.
List of Campaigns
Get information about all your Facebook Ads campaigns in a spreadsheet to closely follow each campaign's objectives, metrics, and budget allocations individually. This holistic view provides means for strategic adaptions and data-driven decision-making. The marketing efforts, in this regard, will be aligned with your business goals and will bring the desired results.
List of Ads
Export Facebook Ads data to Google Sheets for a thorough study of specific metrics of ad performance, including impressions, clicks, and conversion rates. This granular data allows marketers to optimize both their ad content and placement strategies by providing accurate data on what works best for their audience which, in turn, leads to maximum engagement and ROI.
List of Ad Sets
The minute-level insights into targeting options, budgeting, and scheduling for the ads are available for you when you automate exports of Facebook Ads data to Google Sheets. This data is very useful in understanding the demand generated by different ad set configurations that lead to enhanced reach, engagement, and conversions which are major KPIs. It makes targeted audience segmentation and budget planning efficient and hence contributes positively to campaigns’ results.
How to export Facebook Ads data to Google Sheets
Step 1. Connect your Facebook Ads account and choose a data entity to export
Step 2. Organize and transform data before loading it to Google Sheets
Step 3. Connect your Google Sheets account and specify where to load your data
Step 4. Schedule data refresh to automate data flow from Facebook Ads to Google Sheets
Pricing plans
- Monthly
- Annual (save 25%)
Keep your data safe
Coupler.io safeguards your shared information and data transfers from breaches, leaks, and unauthorized disclosures.


Don’t just take our word for it


How to export Facebook Ads data to Google Sheets (detailed guide)
With just a few clicks, you’ll get your Facebook Ads data in spreadsheets to track the performance of your advertising campaigns. Use the connection of Facebook Ads to Google Sheets to simplify your data analysis and reporting process.
Step 1: Collect data
Connect Coupler.io to your Facebook Ads account, the source application. Then you’ll need to select the data category to export:

Step 2: Organize & transform data
The next step is to organize and transform your data before loading it from Facebook Ads to Google Sheets. Coupler.io offers a range of tools to:

Step 3: Load data
The final step involves connecting to your Google Sheets account. Specify exactly where in Google Sheets you want your data to be loaded.

Once you’ve set up the destination parameters, click Run Importer, to launch the data flow. To set up this integration and automate the flow of Facebook Ads data to Google Sheets, you only need to take three steps.
You can also enable automatic data refresh to schedule data updates at a custom interval that ranges from every 15 minutes to every month.
Step 1: Collect data
Connect Coupler.io to your Facebook Ads account, the source application. Then you’ll need to select the data category to export:
- List of ads
- List of ad sets
- List of campaigns
- Reports and insights.
Step 2: Organize & transform data
The next step is to organize and transform your data before loading it from Facebook Ads to Google Sheets. Coupler.io offers a range of tools to:
- preview your data
- apply filters
- sort information
- rename columns or change their order.
Step 3: Load data
The final step involves connecting to your Google Sheets account. Specify exactly where in Google Sheets you want your data to be loaded.
Once you’ve set up the destination parameters, click Run Importer, to launch the data flow. To set up this integration and automate the flow of Facebook Ads data to Google Sheets, you only need to take three steps.
You can also enable automatic data refresh to schedule data updates at a custom interval that ranges from every 15 minutes to every month.
Export Facebook Ads data to Google Sheets on a schedule
Your decisions in digital advertising will be most effective if you make them on the basis of the recent data. Schedule the export of Facebook Ads data to Google Sheets to get a fully automated data flow to your report. Coupler.io allows you to achieve this with the help of the automatic data refresh feature. You can customize the refresh interval ranging from every 15 minutes to monthly updates.
Additionally, users can customize the scheduling specifics by selecting
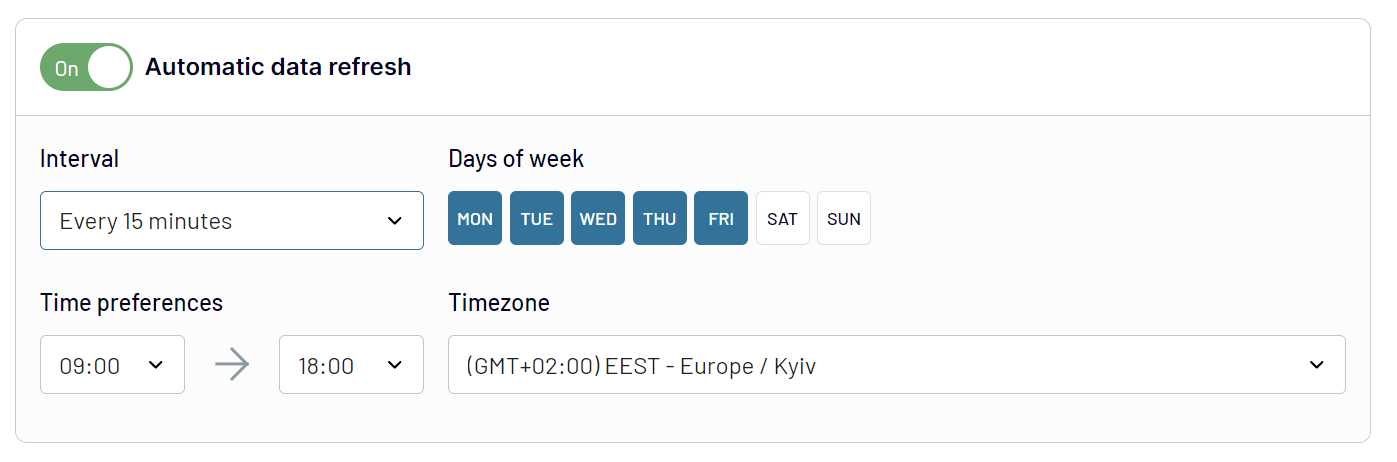
Additionally, users can customize the scheduling specifics by selecting
- Preferred days of the week
- The exact time for data refreshes
- The timezone according to their local time or the time zone most relevant to their data analysis.
What metrics can you export from Facebook Ads to Google Sheets with Coupler.io?
Amount Spent
This metric is the amount of your investment in advertising using Facebook Ads. It allows you to closely monitor your ad spend, carefully allocating your marketing budget. To achieve the greatest return on investment, it’s better to make a long-term expenditure analysis moving from one campaign to another.
Reach
Reach quantifies the number of unique users who saw your ads. It allows you to analyze your ad's visibility and audience penetration. Understanding reach about campaign objectives helps assess the effectiveness of targeting strategies. As a result, you can make adjustments to improve campaign performance.
Frequency
Frequency shows the average number of times each user sees your ad. When you import this Facebook Ads data to Google Sheets, you can evaluate the balance between ad exposure and audience saturation. Optimal frequency ensures that your message is seen enough to make an impact without causing ad fatigue.
Impressions
Impressions count the total views of your ads, including repeated views by the same user. This metric provides insight into the overall exposure of your campaigns. You can understand brand visibility, as well as the effectiveness of your ad placement and targeting strategies.
Clicks
This metric measures the total number of clicks on your ads. Exporting click data to Google Sheets facilitates user engagement and ad relevance analysis. Tracking clicks alongside other metrics can reveal the effectiveness of your ad creative. Based on the analysis results, you can optimize targeting to drive user action.
CPC (Cost Per Click)
CPC calculates the cost of each click on your ads, offering a direct measure of the financial efficiency of your ad spend. Analyzing CPC helps assess ad performance and optimize for cost-effectiveness. To maximize the ROAS, it’s essential to lower CPC while maintaining or increasing engagement.
CPM (Cost Per Thousand Impressions)
CPM determines the cost per each of one thousand viewable impressions. It is used to evaluate the profitability of ad viewability. CPM allows you to optimize your ad spend for maximal advert exposure. As a result, you can perfectly regulate the campaign strategy to achieve the best way to imprint your brand in the minds of the public.
CTR (Click-Through Rate)
CTR reflects how many impressions you achieve that lead to a click and shows if your ads can engage a target audience. This metric will help you understand more about your creative assets and user targeting.
Actions
Actions represent user responses to your ads, such as likes, shares, comments, or conversions. Export Facebook Ads data to Google Sheets to analyze ad effectiveness in driving desired outcomes.
CPA (Cost Per Action)
CPA assesses the cost of each action taken due to your ad, from clicks to conversions. This metric allows you to determine the financial efficiency of your campaigns. This is vital to enable targeted optimizations, reduce costs, and improve ROI.
Action Rate
Action Rate measures the frequency of actions taken against the number of impressions or clicks. This metric offers insights into ad effectiveness from the view of how compelling your ads are to your audience. Action rate can guide improvements in ad creative and targeting.
Conversions
Conversions track the number of desired actions completed from your ads. These actions can be sign-ups, purchases, form submissions, and others. This.
Purchases
It indicates the number of purchases made from clicking on your ads. By analyzing purchase data in Google Sheets, you can gauge the direct impact of your advertising efforts on sales. Understanding purchase trends helps refine targeting and messaging. As a result, you can boost revenue and achieve business objectives.
Import Facebook Ads data to Google Sheets and combine it with information from other sources
With Coupler.io, you can integrate multiple data sources directly into Google Sheets. To begin, click the Add one more source button and follow the setup process. It will look pretty much the same as you already did. This allows you to incorporate as many sources as necessary. You can blend data from different accounts of the same source, such as Facebook Ads.
Another option is aggregating data from disparate sources for comprehensive analytics. These could be CRM applications, analytics tools, marketing platforms, and other sources. As a result, you'll get a holistic view of your data landscape.
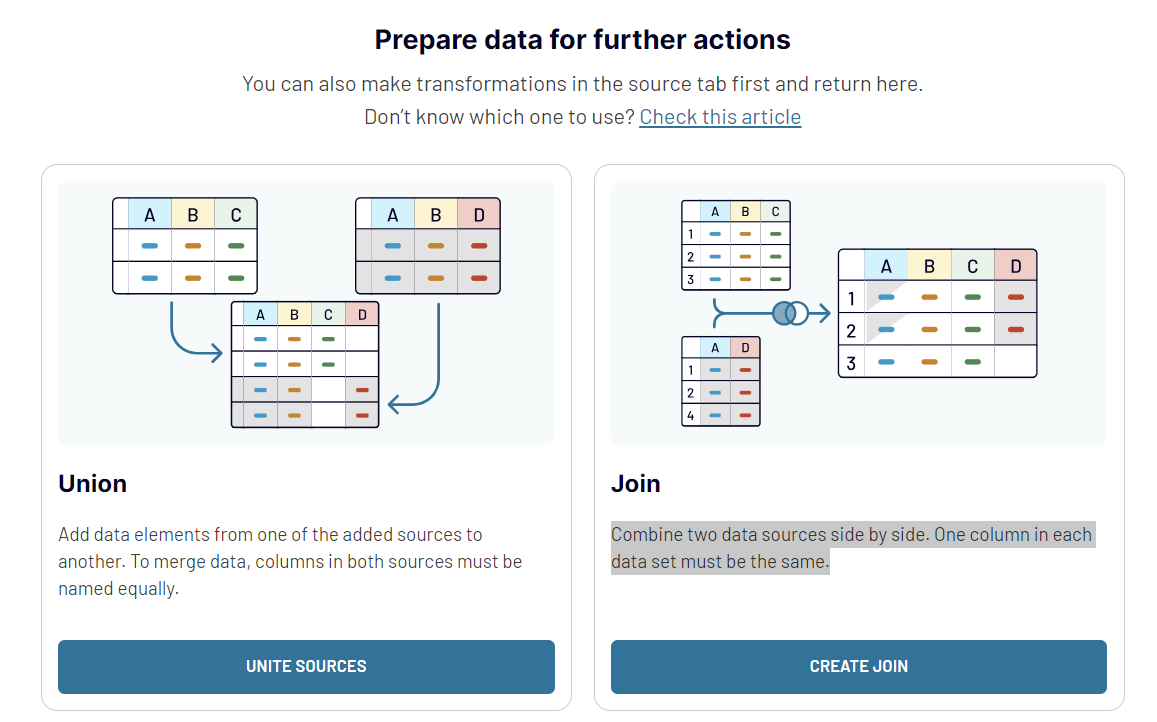
Coupler.io offers two distinct methods for data blending to suit your analysis needs:
You can select your preferred data blending option after linking all your data sources. Clicking Transform data to proceed
Another option is aggregating data from disparate sources for comprehensive analytics. These could be CRM applications, analytics tools, marketing platforms, and other sources. As a result, you'll get a holistic view of your data landscape.
Coupler.io offers two distinct methods for data blending to suit your analysis needs:
- Union data: This method allows you to append data elements from one added source to another. For a successful data merge, ensure that columns in both sources carry identical names. If they don't the data will be appended horizontally to the right.
- Join data: This option lets you combine two data sources for a comparative analysis. It necessitates at least one matching column in each data set to serve as the merge key.
You can select your preferred data blending option after linking all your data sources. Clicking Transform data to proceed
Export Facebook Ads data to Google Sheets or another destination
Diversifying your Facebook Ads data destinations can revolutionize your data analysis and reporting. Coupler.io understands this and offers flexibility in exporting your data. Besides Google Sheets, you can integrate Facebook Ads with many other platforms.
Instead of creating a new importer from scratch, you can easily copy your existing one and switch the destination to any supported application. These include:
Working across different platforms allows you to optimize data analysis and reporting consistency. Whether you're exploring data in a warehouse, creating detailed reports in a spreadsheet app, or visualizing trends in a BI tool, Coupler.io ensures that your Facebook Ads data is always available where you need it. Make your data management strategy more efficient. Give it a try and see for yourself!

Instead of creating a new importer from scratch, you can easily copy your existing one and switch the destination to any supported application. These include:
- Spreadsheet apps: Microsoft Excel, Google Sheets
- Data warehouses: BigQuery, PostgreSQL, Redshift
- BI tools: Looker Studio, Power BI, Tableau, and Qlik.
Working across different platforms allows you to optimize data analysis and reporting consistency. Whether you're exploring data in a warehouse, creating detailed reports in a spreadsheet app, or visualizing trends in a BI tool, Coupler.io ensures that your Facebook Ads data is always available where you need it. Make your data management strategy more efficient. Give it a try and see for yourself!