

Connect Facebook Ads to Looker Studio (Google Data Studio)
Connect Facebook Ads to Looker Studio using Coupler.io for a seamless, no-code experience. Streamline data workflow and have analysis-ready data to create interactive marketing dashboards for making data-driven business decisions.
Step 1
Set source basics

Step 2
Set destination

Setup data integration within seconds
Source application
Facebook Ads
View all available apps on Data sources page
Metrics & dimensions
Period
Destination application
Looker Studio
View all available apps on Data destinations page
Connect Facebook Ads to Looker Studio to simplify marketing reporting
Get and prepare data effortlessly
Connect Facebook Ads to Looker Studio to elevate your marketing reports with Coupler.io. Organize and transform marketing data from multiple sources. Create custom metrics, and automatically schedule data exports easily with no code.
Automate reporting tasks
Coupler.io streamlines your reporting by scheduling automatic updates from Facebook Ads to Looker Studio. This ensures your reports are always up-to-date. Plus, with our dashboard templates, you can quickly assemble digital marketing reports, saving time and effort.
Stand out as a data-driven expert
Turn Facebook Ads data into insightful reports easily with Coupler.io. Share these findings with clients and stakeholders. Automate the data flow from Facebook Ads to Looker Studio, freeing up time for tasks that add more value.
Export data from Facebook Ads to alternative destinations


Quick start with PPC dashboard templates
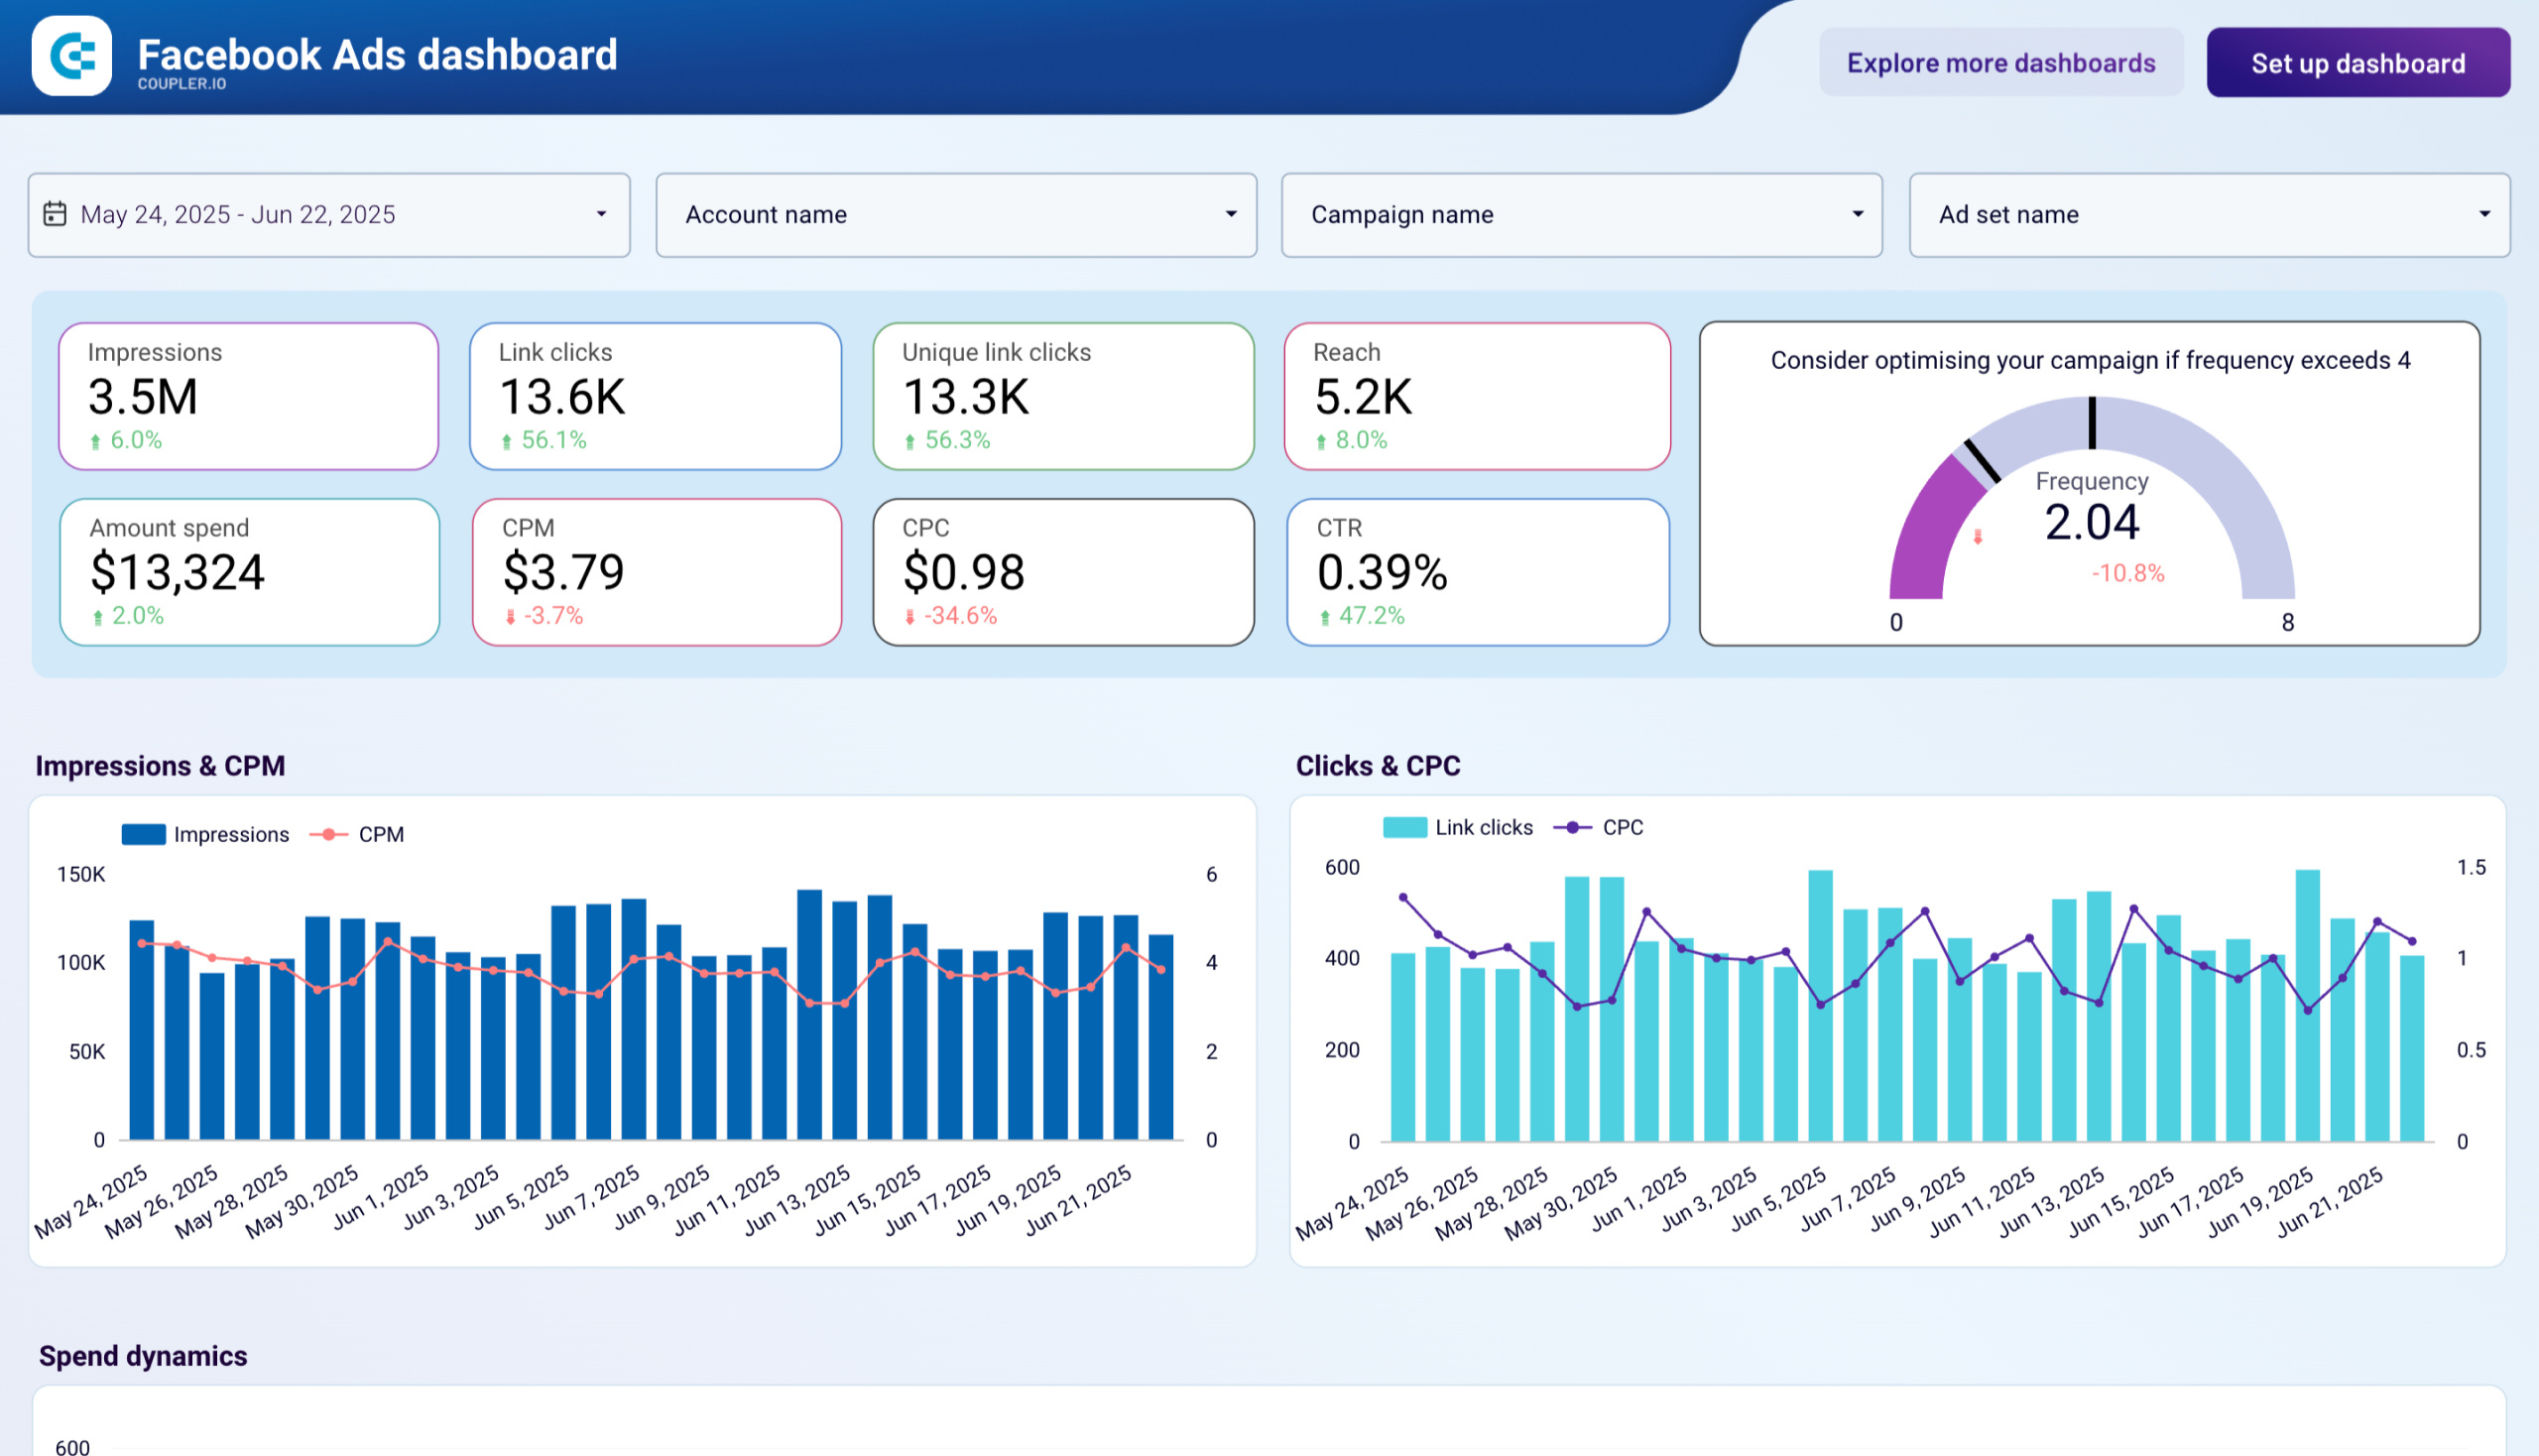
Facebook Ads dashboard

Facebook Ads & Brand awareness dashboard


Google Ads and Meta Ads campaign performance dashboard

No such template is available yet.
No worries. Our team will create a template that fits your needs, just tell us more
about your case. It doesn't cost you a penny 😉
Request a custom report
about your case. It doesn't cost you a penny 😉
Export data from Facebook Ads to alternative destinations
Connect similar PPC apps and get data in minutes


Facebook Ads data to Looker Studio: what to export

Reports and Insights
This category covers detailed analytics of ad performance. It includes KPIs like click-through rates, impressions, cost per action, and conversion rates. When you export these insights to Looker Studio, the visualization helps to spot trends. You can also measure how effective your campaigns are and optimize your strategies accordingly.
List of Ad Sets
By exporting the list of ad sets from Meta Ads, you get all the information about targeting criteria, budget, spending, and performance metrics on an ad set level. Using Looker Studio, marketers can assess the effectiveness of various targeting approaches and budget allocations on the overall success of their campaigns
List of Campaigns
The list of campaigns includes important data about each advertising campaign. This data covers campaign objectives, campaign name, total spend, duration, and performance outcomes. Exporting it to Looker Studio gives users a clear overview of each campaign's efficiency and ROI. This overview helps to plan strategically and make necessary budget adjustments.
List of Ads
This category contains specific details about each ad. It has creative elements, ad formats, engagement metrics, and performance statistics. You can conduct an in-depth analysis in Looker Studio to find the most effective ad variations. This analysis also helps to improve creative strategies and overall ad performance.
How to export Facebook Ads to Looker Studio
Step 1. Connect your Facebook Ads account and choose a data entity to export
Step 2. Organize and transform data before loading it to Looker Studio
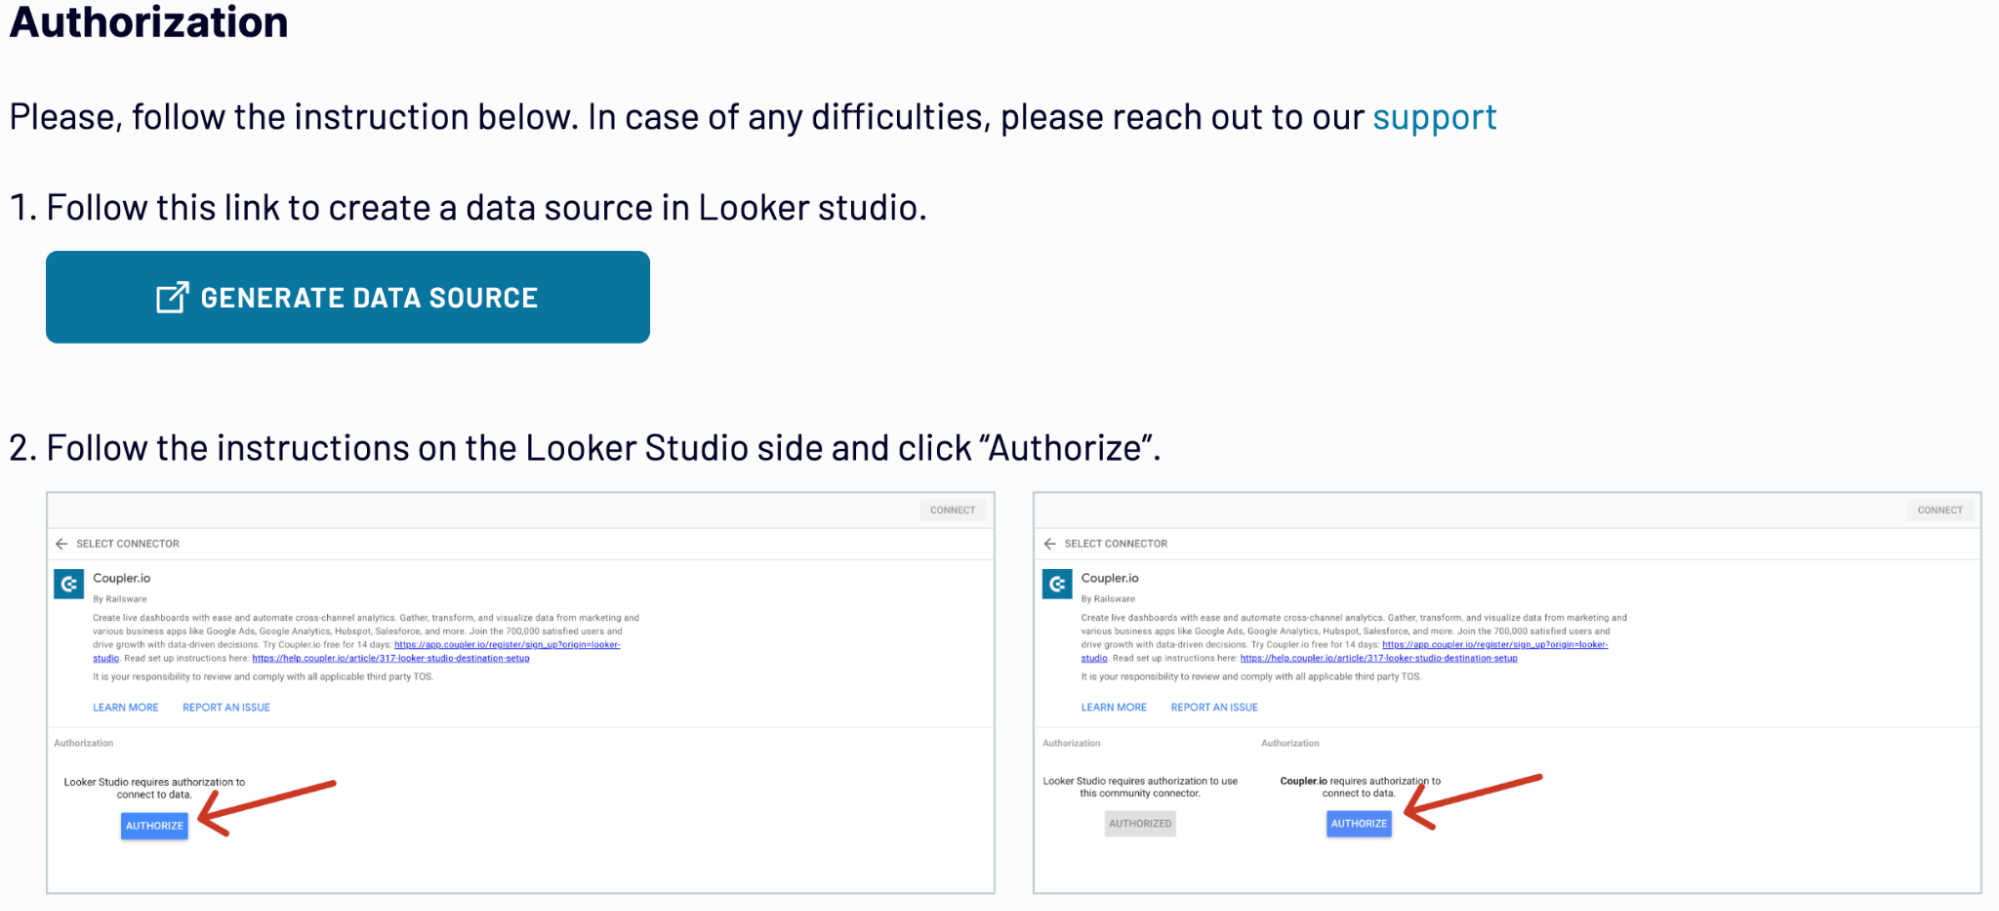
Step 3. Connect Looker Studio and create a data source with your Facebook Ads data
Step 4. Schedule data refresh to automate data flow from Facebook Ads to Looker Studio
Pricing plans
- Monthly
- Annual (save 25%)
Keep your data safe
Coupler.io safeguards your shared information and data transfers from breaches, leaks, and unauthorized disclosures.


Don’t just take our word for it


How to connect Facebook Ads to Looker Studio in more detail
Step 1: Collect data
The first step in integrating your Facebook Ads to Looker Studio is to connect Coupler.io with your Facebook Ads account. Once linked, you can choose from different data entities. If you select Reports and Insights, you must select metrics, dimensions, and report date range.
Once connected, select the specific data you wish to export. This could be anything from customer details to order information. Coupler.io provides a user-friendly interface, allowing you to choose exactly what data you need for your analytics in Looker Studio.

Step 2: Organize and transform data
After successfully connecting to your source, it is time to organize and refine data before loading it from Facebook Ads to Looker Studio. You can use Coupler.io’s data transformation features for this.

At this stage, you'll customize the data as required to make it analysis-ready.
Step 3: Load & automate
The final step to connect Facebook Ads to Looker Studio is loading the data in Looker Studio. Follow the in-app instructions in Coupler.io.
Click on Create Report to visualize the Facebook ads data in Looker Studio.

Create a schedule to refresh your data automatically. You can choose the frequency from 15 minutes to monthly. Run the importer to start the data flow from Facebook Ads to Looker Studio. This automated connection saves time and helps you make informed decisions with the most current data available.
The first step in integrating your Facebook Ads to Looker Studio is to connect Coupler.io with your Facebook Ads account. Once linked, you can choose from different data entities. If you select Reports and Insights, you must select metrics, dimensions, and report date range.
Once connected, select the specific data you wish to export. This could be anything from customer details to order information. Coupler.io provides a user-friendly interface, allowing you to choose exactly what data you need for your analytics in Looker Studio.
Step 2: Organize and transform data
After successfully connecting to your source, it is time to organize and refine data before loading it from Facebook Ads to Looker Studio. You can use Coupler.io’s data transformation features for this.
- Filter and sort the data to focus on the most relevant information.
- Rename columns and adjust their order to suit your reporting structure.
- Add custom columns using formulas to tailor the data further to your analysis needs.
At this stage, you'll customize the data as required to make it analysis-ready.
Step 3: Load & automate
The final step to connect Facebook Ads to Looker Studio is loading the data in Looker Studio. Follow the in-app instructions in Coupler.io.
Click on Create Report to visualize the Facebook ads data in Looker Studio.
Create a schedule to refresh your data automatically. You can choose the frequency from 15 minutes to monthly. Run the importer to start the data flow from Facebook Ads to Looker Studio. This automated connection saves time and helps you make informed decisions with the most current data available.
Export Facebook Ads data to Looker Studio on a schedule
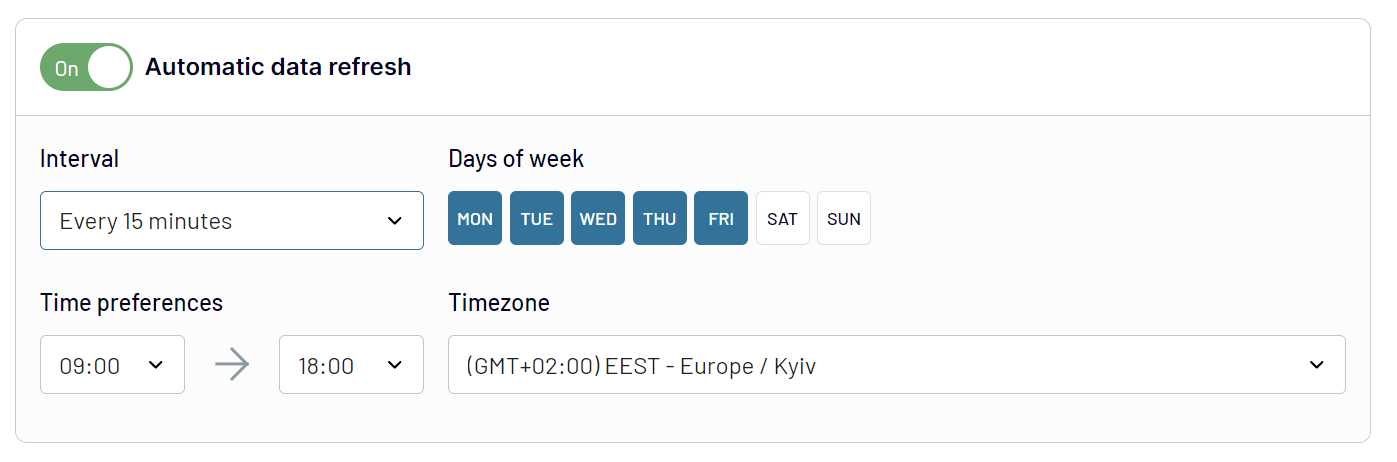
Automating the export of Facebook Ads data to Looker Studio changes how you report and analyze your marketing efforts. With Coupler.io's automatic data refresh feature, you ensure the data is always up-to-date. It gives the latest insights without any manual effort.
Set your data to refresh at intervals that suit your needs - from as frequently as every 15 minutes to just once a month. It also comes with additional flexibility options like:
This level of customization keeps your Looker Studio reports fresh with near real-time data in Looker Studio. By staying on top of your data effortlessly, you’ll have enough time to focus on optimizing your Facebook Ads strategy for the best results.
Set your data to refresh at intervals that suit your needs - from as frequently as every 15 minutes to just once a month. It also comes with additional flexibility options like:
- Users can choose the specific days of the week and preferred times for updates.
- You can set the timezone that matches your location and time preferences to export Facebook Ads to Looker Studio.
This level of customization keeps your Looker Studio reports fresh with near real-time data in Looker Studio. By staying on top of your data effortlessly, you’ll have enough time to focus on optimizing your Facebook Ads strategy for the best results.
What metrics can you export from Facebook Ads to Looker Studio?
Impressions
Counts how often your ad is displayed to users, regardless of clicks. You can estimate the scope of your ad's visibility, campaign reach, and frequency with impressions. It is useful for optimizing ad frequency and budget allocation.
Reach
Measures the number of unique viewers who see your ad. It is identified by counting each individual user who sees your ad, ensuring no duplicates. This metric helps marketers understand the breadth of their campaign's audience. Reach helps to build strategies that maximize the diversity of ad exposure among potential customers.
Clicks
The total number of actions where users have interacted with the ad by clicking. Clicks can be used to evaluate the direct engagement level of the audience with your ad. It is useful to understand the ad's attractiveness and the effectiveness of its call to action (CTA).
Click-Through Rate (CTR)
A ratio showing how often people who see your ad end up clicking it. Calculated by dividing the total clicks by impressions and multiplying by 100. It offers insights into how compelling your ad is to the audience.
Cost Per Click (CPC)
Measures the average cost for each click on your ad. It is calculated by dividing the total cost of clicks by the total number of clicks. CPC is used for budget management. It helps to evaluate the cost-effectiveness of your ad spend based on user engagement.
Cost Per Impression (CPM)
The cost for every thousand impressions of your ad. It is determined by dividing the total ad spend by the total number of impressions, then multiplying by 1,000. You can understand the cost efficiency of ad visibility. Also, guide budget allocation strategies for brand awareness campaigns.
Conversions
It is the number of times ad interactions lead to a desired action, like a purchase. This is counted by setting specific conversion goals. Conversions measure the direct impact of ads on business objectives. They provide a clear picture of campaign effectiveness beyond initial engagement.
Conversion Rate
It is the percentage of clicks that result in a conversion. You can calculate by dividing conversions by total clicks and multiplying by 100. It highlights the effectiveness of your ad in optimizing ad content and targeting for higher performance.
Cost Per Conversion
It evaluates the average cost of acquiring a conversion through your ad. Determined by dividing the total ad spend by the number of conversions. It assesses the financial efficiency of your ad campaign to make budget adjustments to improve ROI.
Video Views
Video Views count how often your video ad has been watched, typically for at least 3 seconds. You can understand the effectiveness of video content and optimize it to capture and retain viewer attention more effectively.
Export Facebook Ads data to Looker Studio or another destination
With Coupler.io, exporting your Facebook Ads data is not just limited to Google Looker Studio. Users can easily duplicate the importers and select a new destination from an extensive list.

This flexibility streamlines your data workflows. It lets you use the best tools for analyzing and visualizing your Facebook Ads data.
- You can export Facebook Ads data to popular spreadsheet apps, including Google Sheets and Microsoft Excel.
- If you need data warehousing, options like BigQuery, PostgreSQL, and Redshift are available.
- For advanced analytics, you can choose BI tools such as Power BI, Tableau, Monday.com, and Qlik.
This flexibility streamlines your data workflows. It lets you use the best tools for analyzing and visualizing your Facebook Ads data.
Combine data from Facebook Ads with data from other sources in Looker Studio
Coupler.io makes it easy to combine Facebook Ads data with information from other sources for advanced reporting in Looker Studio. You can pull data from other ad platforms like Google Ads, LinkedIn Ads, and Instagram Ads, or even from CRM apps, website analytics tools like Google Analytics 4, and social media platforms. This gives you a full picture of your marketing efforts.
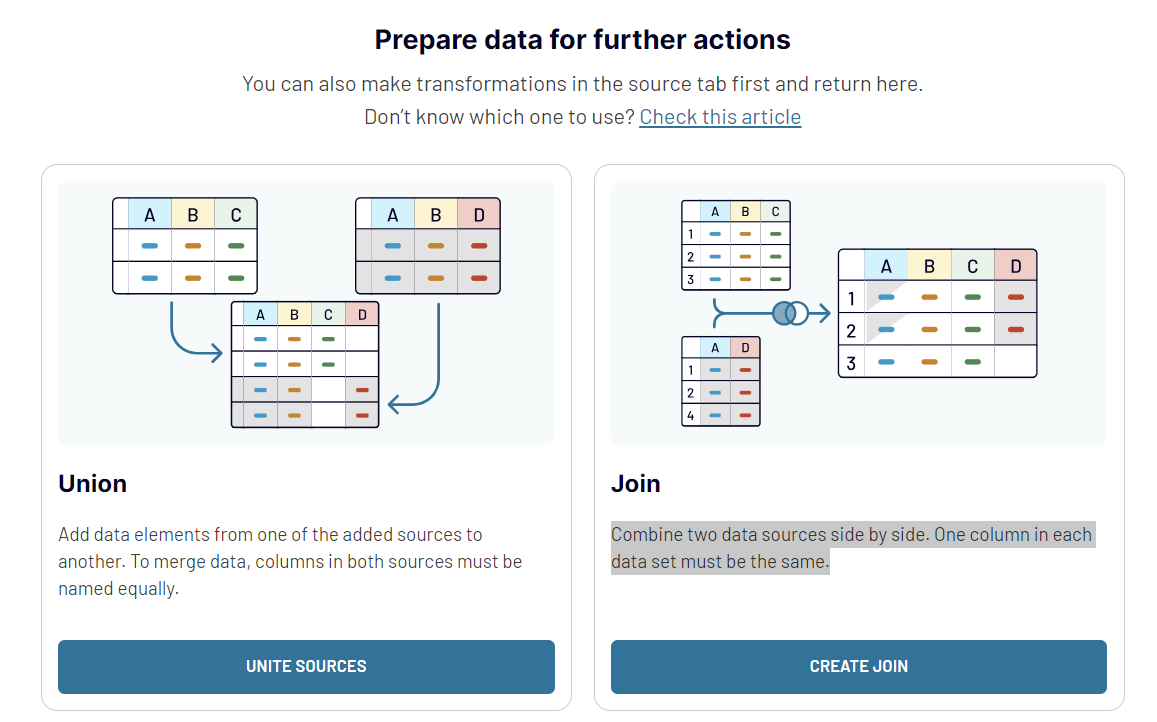
For merging data, Coupler.io offers two methods: union and join.
In Coupler.io, to combine data from different sources, simply click Add one more source and set up the connection like you normally would. You can merge as many sources as you like, whether they're different accounts from the same source or completely different applications.
These options open up new analysis possibilities. You see a complete view of your advertising across PPC channels or dive deep into how different data sets relate to each other.
For merging data, Coupler.io offers two methods: union and join.
- With Union, you can layer data from different sources, ensuring columns in both sets have the same names for a smooth merge.
- The Join method places data from two sources next to each other, requiring at least one matching column in each set for comparison.
In Coupler.io, to combine data from different sources, simply click Add one more source and set up the connection like you normally would. You can merge as many sources as you like, whether they're different accounts from the same source or completely different applications.
These options open up new analysis possibilities. You see a complete view of your advertising across PPC channels or dive deep into how different data sets relate to each other.