What data you can export from Aircall
-
CallsCommunication event data optimized for time-based visualizations, enabling interactive charts showing call volume trends, duration analysis, and outcome tracking across different periods and team segments.
-
CompaniesBusiness account information structured for relationship visualizations, supporting interactive charts displaying account engagement patterns, communication frequency analysis, and business relationship mapping.
-
ContactsCustomer interaction profiles formatted for engagement visualizations, enabling interactive displays of communication history, contact scoring, and relationship development tracking.
-
NumbersTelephony performance data organized for infrastructure visualizations, supporting interactive charts showing call routing efficiency, number utilization patterns, and system performance metrics.
-
TagsClassification data structured for categorical visualizations, enabling interactive filtering and dynamic content organization within communication performance dashboards and analytical reports.
-
User availabilitiesScheduling information formatted for capacity visualizations, supporting interactive displays of team availability patterns, utilization rates, and resource allocation optimization.
-
UsersTeam member data organized for performance visualizations, enabling interactive charts displaying individual metrics, comparative analysis, and team member contribution tracking.
-
TeamsGroup performance data structured for hierarchical visualizations, supporting interactive organizational charts and comparative team performance displays within communication analytics.
-
WebhooksIntegration activity data formatted for system visualizations, enabling interactive monitoring displays and workflow performance tracking within communication system dashboards.
All-in-one tool for Aircall data exports and analytics
Import communication analytics, call records, and performance data from Aircall, blending with sales metrics, customer data, and operational information to create comprehensive visual narratives in Looker Studio.
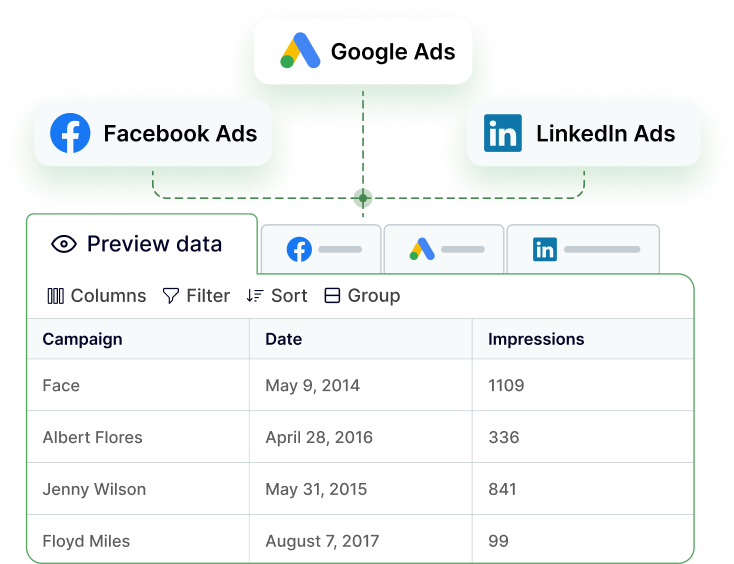
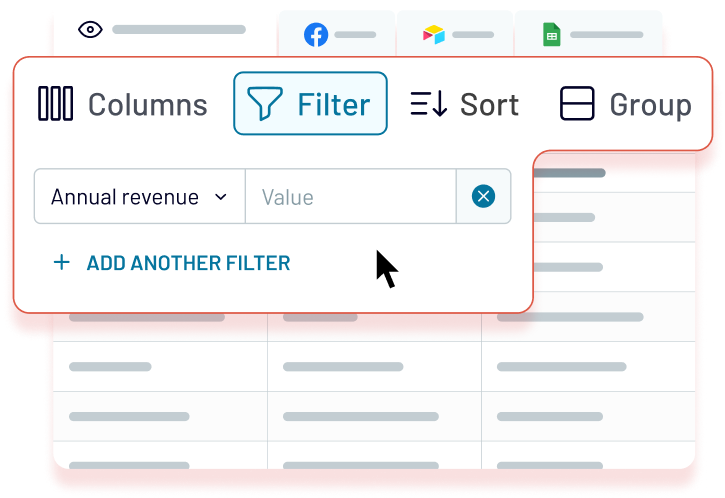
Format communication data for optimal visualization performance with properly structured dimensions and metrics that enable interactive filtering, drilling capabilities, and dynamic dashboard functionality within Looker Studio.
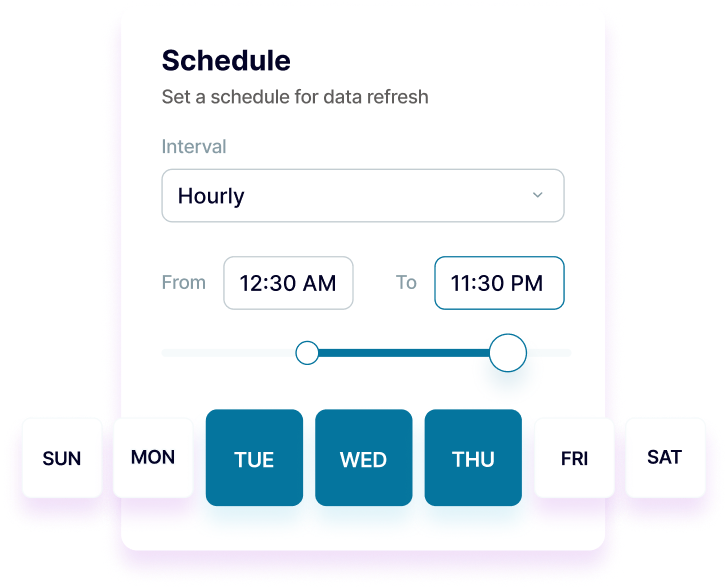
Keep visual dashboards up-to-date with automated data updates from monthly to 15-minute frequencies. Ensure stakeholders view the latest communication performance through real-time visualizations and interactive reporting.
Enhance communication insights with Coupler.io AI integrations, enabling natural language exploration of call patterns and performance trends that complement your visual storytelling capabilities.



Why export Aircall to Looker Studio - real life cases
Executive communication dashboards
Customer service performance visualization
Sales communication analytics
Team performance comparison and benchmarking
How to export Aircall to Looker Studio
Automate data exports with the no-code Aircall Looker Studio integration
Connect similar Sales apps and get data in minutes
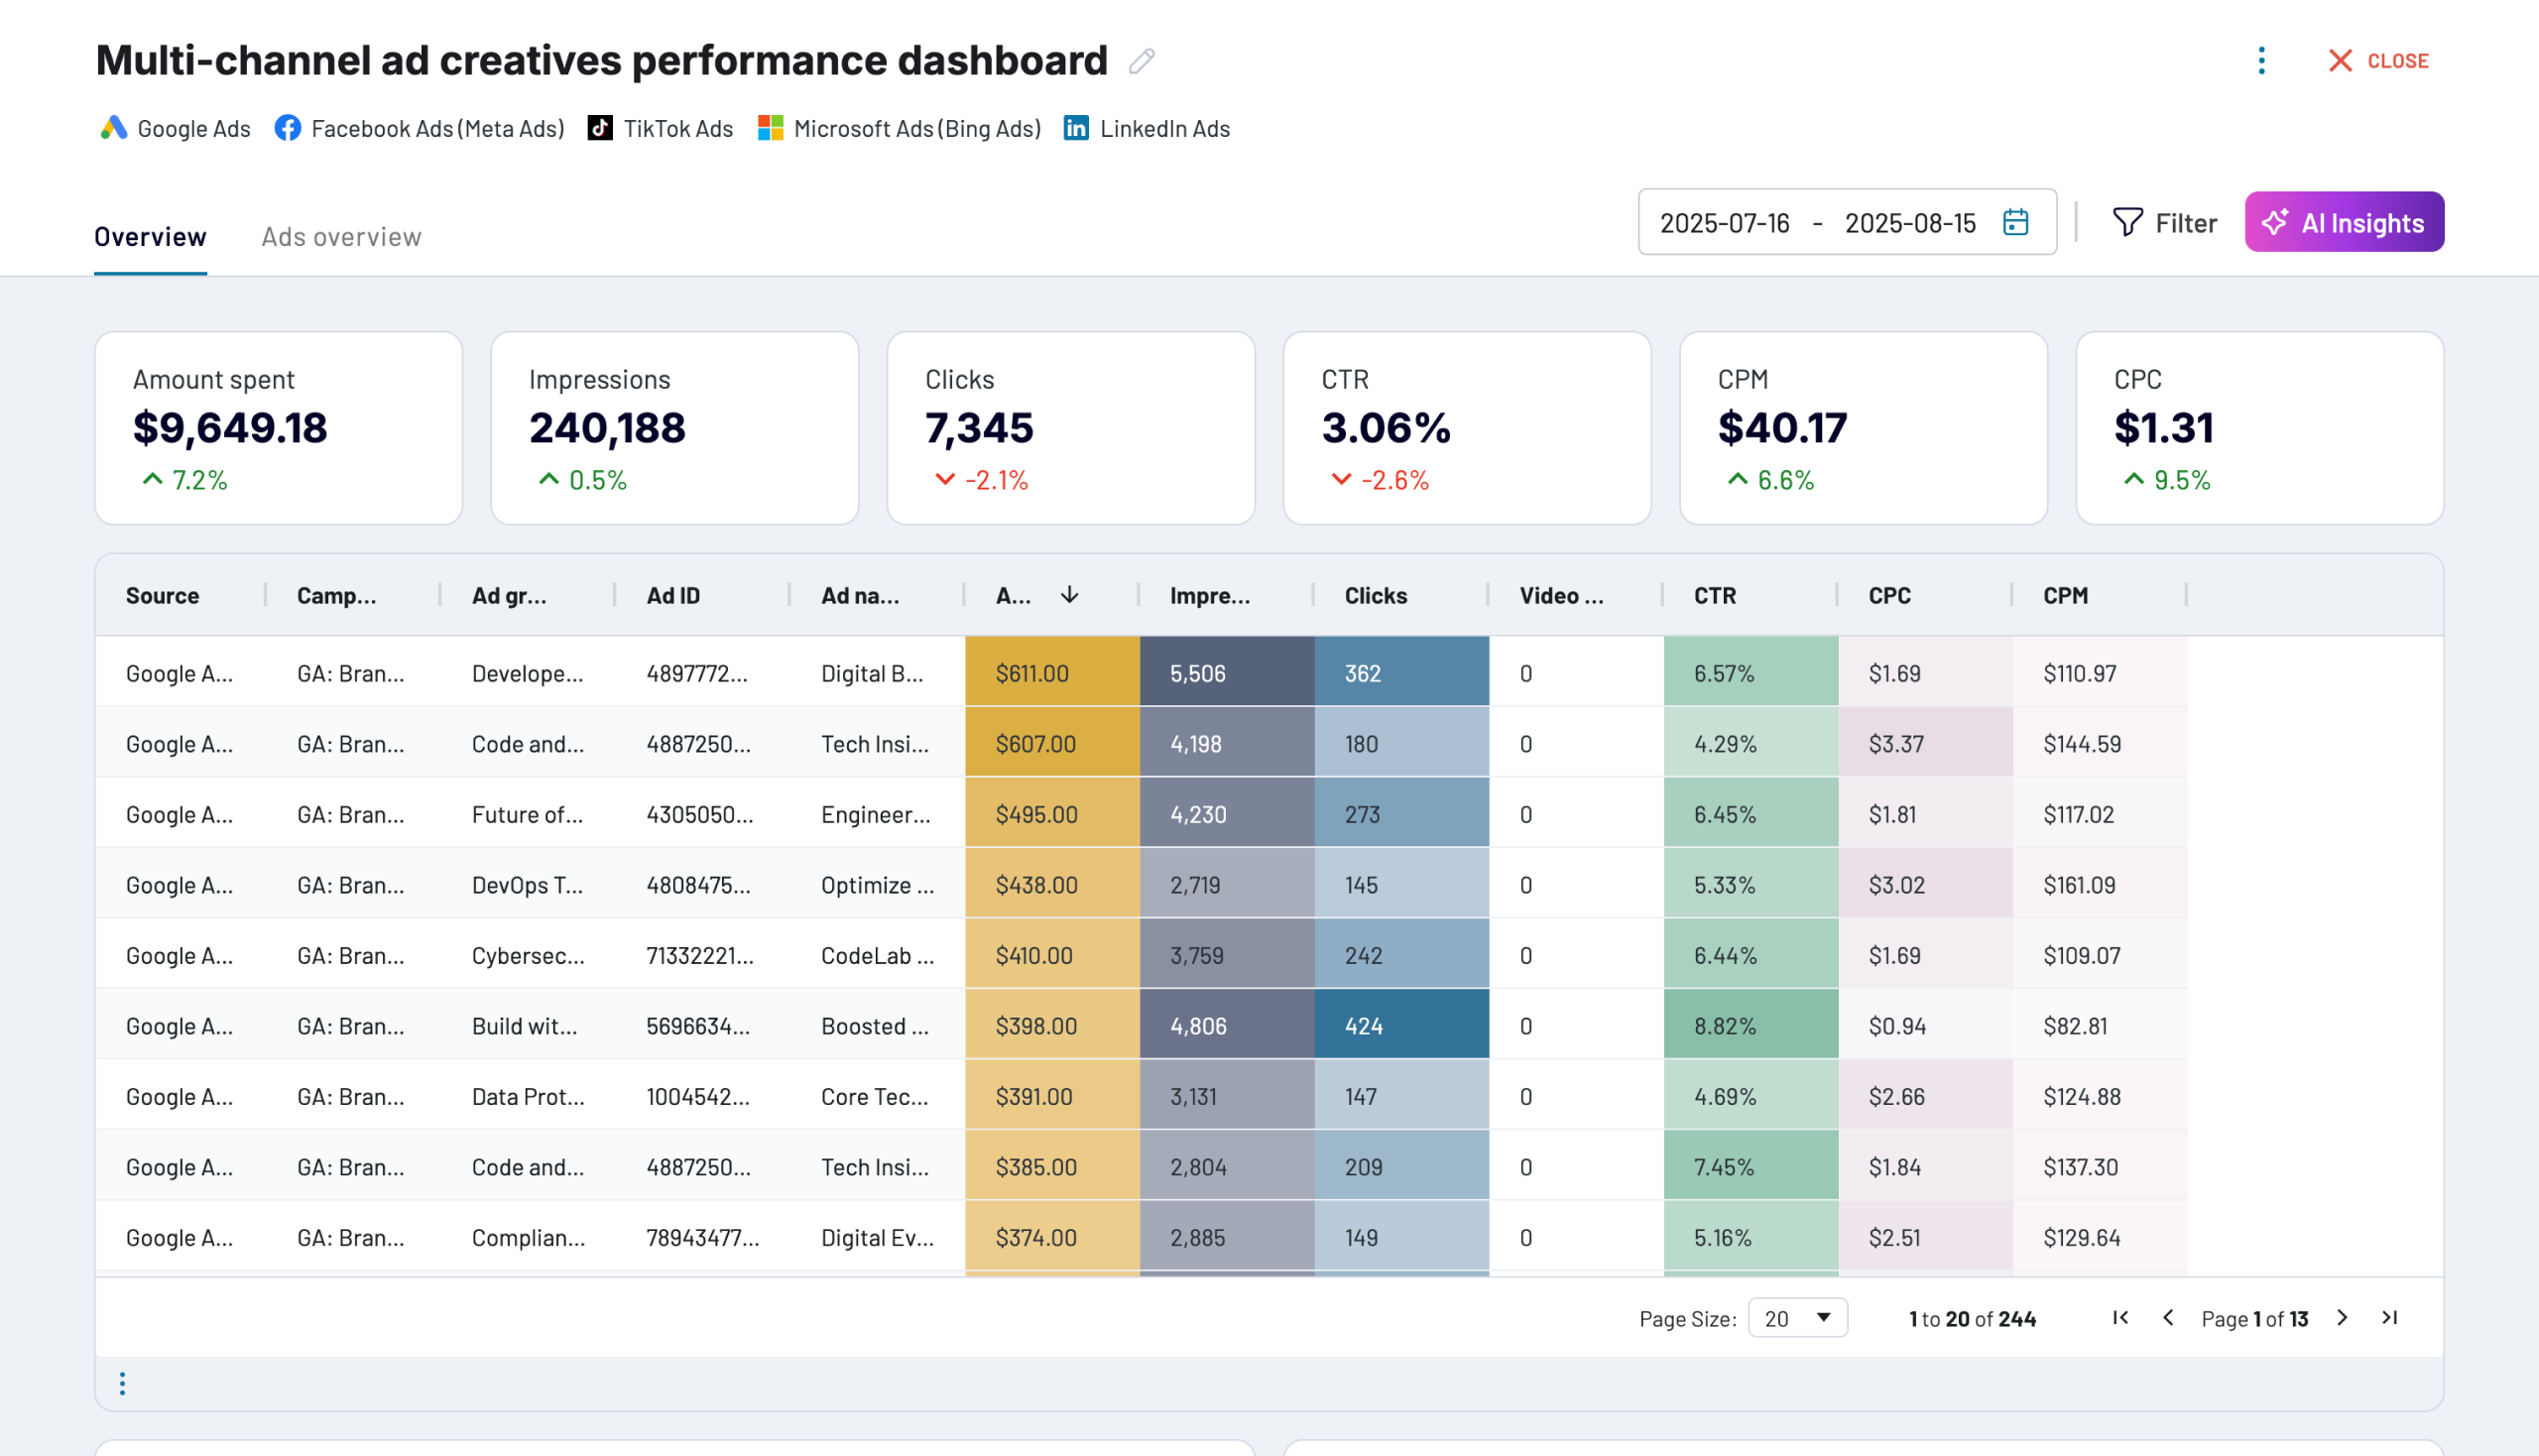
Quick start with dashboard templates




about your case. It doesn't cost you a penny 😉
Talk to AI about your Aircall data
Examples of questions you can ask about Aircall data:
- "Create visualizations showing seasonal patterns in our communication volume and team performance"
- "What are the most effective visual formats for presenting call success rates to different stakeholders?"
- "Which communication metrics should be highlighted in this month's executive dashboard?"
- "Identify visual patterns that indicate optimal team performance and suggest dashboard enhancements"


Keep your data safe
Coupler.io safeguards your shared information and data transfers from breaches, leaks, and unauthorized disclosures.


