

Salesforce to Google Sheets Integration
Benefit from Coupler.io's Salesforce to Google Sheets integration to import data automatically and have it refreshed on a chosen schedule. Extract sales data and fine-tune it according to your analytics preferences to turn it into ready-to-use reports.
Use Coupler.io's Salesforce to Google Sheets integration to simplify reporting
Get and prepare data effortlessly
Import data from Salesforce to Google Sheets even if you've never tried coding. Coupler.io enables you to arrange data as you wish, make adjustments to it, have your reports regularly auto-updated, and pull valuable records from numerous sources.
Automate reporting tasks
Take a few simple steps to connect Salesforce to Google Sheets. Minimize repetitive reporting tasks thanks to Coupler.io's automation, build reports on data from diverse applications, and enjoy visual analytics with our free interactive dashboard templates.
Stand out as a data-driven expert
Demonstrate your expertise to clients and stakeholders using straightforward, up-to-date reports made possible by automated data flow. Now, you'll be able to prioritize impactful tasks instead of spending excessive time on reporting duties.
Export data from Salesforce to alternative destinations


Quick start with CRM dashboard templates

Salesforce CRM dashboard

Sales team performance dashboard for Salesforce

CRM dashboard for Salesforce

No such template is available yet.
No worries. Our team will create a template that fits your needs, just tell us more
about your case. It doesn't cost you a penny 😉
Request a custom report
about your case. It doesn't cost you a penny 😉
Connect Salesforce to Google Sheets automatically with just a few clicks.
Connect similar CRM apps and get data in minutes


What to export from Salesforce to Google Sheets

Contacts
Export contacts from Salesforce to Google Sheets to gain insights into your client base. It includes details such as contact names, email addresses, phone numbers, and associated accounts. This data allows you to manage and nurture client relationships, track communication history, and personalize interactions based on client preferences.
New accounts report
Another reason to connect Salesforce to Google Sheets is the new accounts report, which entails information on recently created accounts: account names, account types, creation dates, and assigned account owners. Monitor business expansion, identify target markets, and allocate resources efficiently to nurture new account relationships.
New contacts & accounts report
This report combines newly added contacts and associated accounts in Salesforce. It covers contact details such as names, email addresses, and account affiliations. By loading this data into Google Sheets, you'll be able to see the growth of your client network and ensure proper alignment between contacts and their respective accounts.
New opportunities with products report
The new opportunities with products report comprises information on recently created opportunities, along with associated products. Use it to analyze data such as opportunity names, stages, close dates, and product details. It will let you track sales pipeline activity, evaluate product performance, and prioritize sales efforts.
New test account report
Have a look at Salesforce data, such as account names, account types, and creation dates specifically designated for testing purposes. By exporting this information for analysis, you'll get the opportunity to manage test environments efficiently, ensure data integrity, and optimize troubleshooting and validation processes.
PL new opportunities report
Take advantage of Salesforce to Google Sheets integration to import data on new sales opportunities originating from partner leads. It will enable the assessment of partner-driven sales initiatives, optimization of partner engagement, efficient resource allocation, and revenue maximization through strategic partnerships.
Orchestration runs
Orchestration runs refer to the execution of automated processes or workflows within Salesforce. It informs you about workflow execution status, timestamps, and any associated errors or exceptions. Using this data, you'll be able to monitor system automation, troubleshoot issues promptly, and ensure smooth workflow operations.
Orchestration work items
This kind of data represents individual tasks or actions within automated workflows. It offers an overview of task assignments, statuses, and completion details. With this information in mind, you'll track progress, allocate resources efficiently, and ensure the timely execution of automated processes for optimal business efficiency.
How do you use Salesforce to Google Sheets integration?
Step 1. Connect your Salesforce account and choose the data entity to export
Step 2. Organize and transform data before loading it into Google Sheets
Step 3. Connect your Google Sheets account and specify where to load the data
Step 4. Schedule refreshes to automate data flow from Salesforce to Google Sheets
Pricing plans
- Monthly
- Annual (save 25%)
Keep your data safe
Coupler.io safeguards your shared information and data transfers from breaches, leaks, and unauthorized disclosures.


Don’t just take our word for it


How to integrate Salesforce to Google Sheets (detailed guide)
Follow the steps below to connect Salesforce to Google Sheets:
Step 1: Collect data
To begin with, connect your Salesforce account. Then, select the specific Data type you'll export. Depending on the chosen Data type, adjust the other mandatory settings if there are any.

Once you're done with the source settings, proceed to the next step.
Step 2: Organize and transform
Before importing data from Salesforce to Google Sheets, verify whether it's correct. If you need to, apply various transformations to it:
This ensures that your data at the destination will be just as you want it to be.

When you're ready, go to destination settings.
Step 3: Load and automate
To begin with, authorize your Google Sheets account. Next, you must select the exact destination to import data: spreadsheet and sheet. You can also create a new sheet by typing in its name in the respective field.
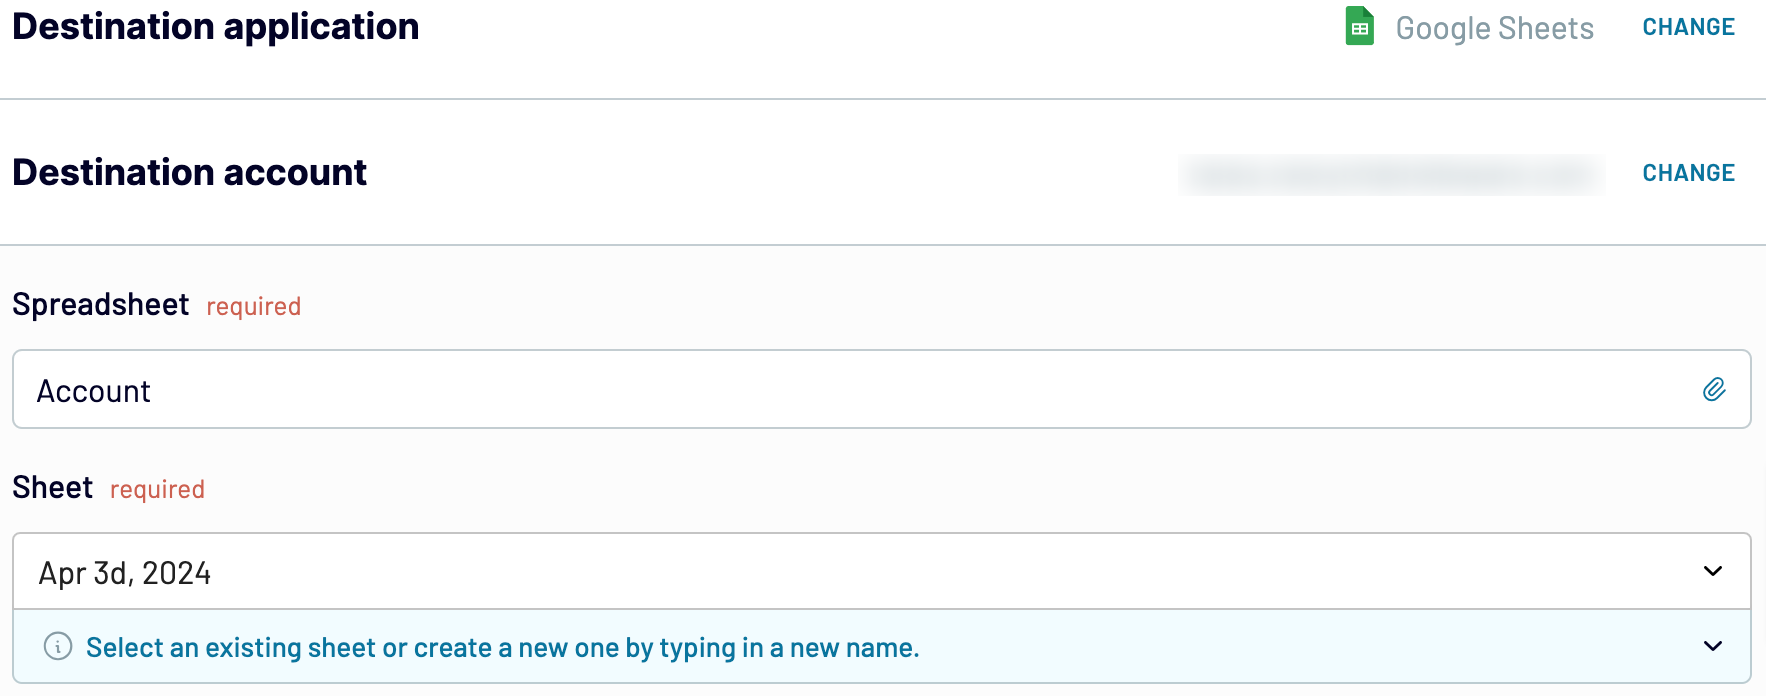
After that, activate Automatic data refresh and select the preferred interval in the corresponding dropdown field. Then, save and run the importer to make data import happen.
Step 1: Collect data
To begin with, connect your Salesforce account. Then, select the specific Data type you'll export. Depending on the chosen Data type, adjust the other mandatory settings if there are any.
Once you're done with the source settings, proceed to the next step.
Step 2: Organize and transform
Before importing data from Salesforce to Google Sheets, verify whether it's correct. If you need to, apply various transformations to it:
- Edit, rearrange, hide, or add columns.
- Apply filters and sort data in the desired order.
- Create new columns with custom formulas.
- Combine data from different accounts or apps.
This ensures that your data at the destination will be just as you want it to be.
When you're ready, go to destination settings.
Step 3: Load and automate
To begin with, authorize your Google Sheets account. Next, you must select the exact destination to import data: spreadsheet and sheet. You can also create a new sheet by typing in its name in the respective field.
After that, activate Automatic data refresh and select the preferred interval in the corresponding dropdown field. Then, save and run the importer to make data import happen.
Connect Salesforce to Google Sheets and automate data exports on schedule
Set up automatic report updates to keep imported data constantly refreshed. Tailor the frequency to your liking, whether it's monthly, daily, hourly, or even every 30 or 15 minutes. Additionally, you can choose specific days of the week, hours, and the time zone.
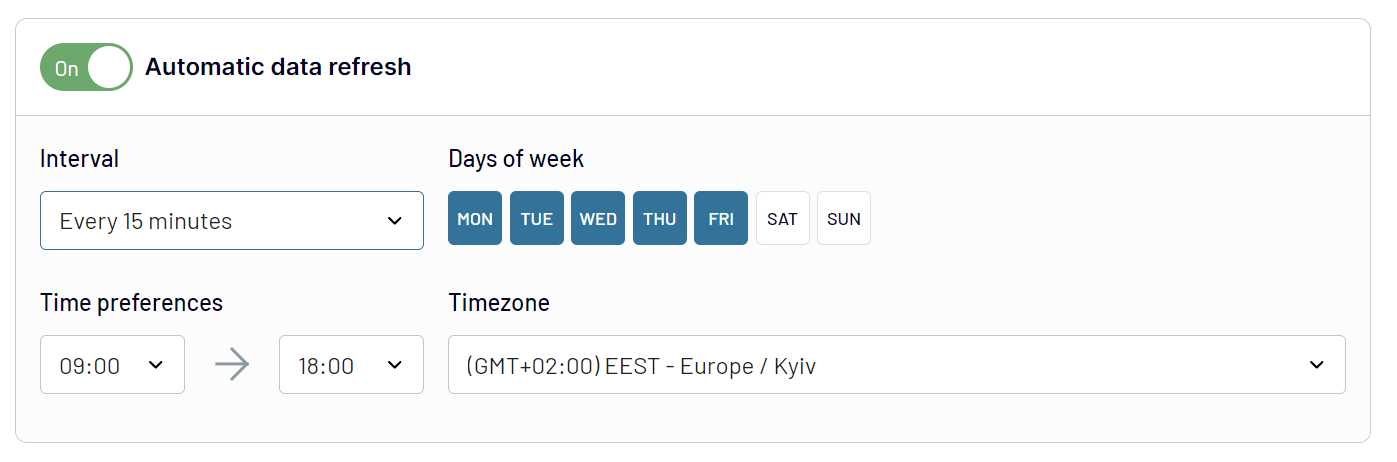
With Coupler.io's Salesforce to Google Sheets integration, you'll have access to the most recent data for analysis, aligned with dynamic source records.
With Coupler.io's Salesforce to Google Sheets integration, you'll have access to the most recent data for analysis, aligned with dynamic source records.
What key metrics can you export from Salesforce to Google Sheets?
Total sales
Description: Total sales represent the sum of revenue generated from successful transactions within a specified period.
How to calculate: To obtain the total sales, sum up the value of all successful orders, excluding taxes, shipping fees, and discounts.
Win rate
Description: Win rate measures the percentage of opportunities that result in a successful sale.
How to calculate: Divide the number of won opportunities by the total number of opportunities, then multiply by 100 to get the win rate percentage.
Close rate
Description: Close rate reflects the percentage of deals successfully closed compared to the total number of deals pursued.
How to calculate: Divide the number of closed deals by the total number of deals pursued, then multiply by 100 to get the close rate percentage.
Average days to close
Description: The average days to close represents the mean duration it takes to finalize a deal from the moment it's opened.
How to calculate: Calculate the time elapsed between opening and closing deals, then find the average duration across all closed deals.
Pipeline value
Description: Pipeline value refers to the total worth of all open opportunities in the sales pipeline.
How to calculate: Sum up the value of all open opportunities in the sales pipeline.
Open deals
Description: Open deals represent the number of ongoing opportunities or deals that have not yet been finalized.
How to calculate: Count the number of opportunities or deals that are still in progress or have not been closed.
Expected revenue
Description: Expected revenue predicts the total income anticipated from open opportunities in the sales pipeline.
How to calculate: Multiply the value of each open opportunity by its probability of closing, then sum up these values to obtain the expected revenue.
Average open deal age
Description: Average open deal age signifies the mean duration that ongoing deals have been in the pipeline.
How to calculate: Calculate the time elapsed since each open deal was created, then find the average age across all open deals.
Import data from Salesforce to Google Sheets or another destination
Coupler.io doesn't only offer Salesforce to Google Sheets integration, but it also gives you the possibility to replicate importers to load data into other destinations:

You can bring in Salesforce data into these applications using the flow previously outlined for Google Sheets.
- Microsoft Excel – another spreadsheet application.
- Data warehouses: BigQuery, PostgreSQL, Redshift.
- Business intelligence (BI) tools: Looker Studio, Tableau, Power BI, and Qlik Sense.
You can bring in Salesforce data into these applications using the flow previously outlined for Google Sheets.