What data you can export from ChartMogul
-
CustomersExport detailed customer profiles including subscription status, revenue metrics, and demographic information. Analyze customer lifecycle stages, segment high-value accounts, and track subscription health across your customer base for retention strategies.
-
ActivitiesAccess comprehensive customer activity logs capturing subscription events, billing interactions, and engagement touchpoints. Monitor user behavior patterns, identify usage trends, and track critical subscription milestones for customer success initiatives.
-
Customer daily countsRetrieve daily customer metrics including new acquisitions, cancellations, and net customer changes. Track short-term subscription trends, identify daily performance patterns, and monitor the immediate impact of marketing campaigns or product changes.
-
Customer weekly countsAnalyze weekly customer data aggregations showing subscription growth patterns and weekly trend analysis. Perfect for identifying weekly seasonality in customer acquisition, measuring campaign performance, and tracking subscription momentum over time.
-
Customer monthly countsAccess monthly customer aggregations for long-term trend analysis and strategic planning. Essential for board reporting, quarterly business reviews, and understanding subscription business seasonality and growth trajectories.
All-in-one tool for ChartMogul data exports and analytics
Merge ChartMogul subscription metrics with CRM data, marketing campaigns, and financial records to build complete customer intelligence dashboards for data-driven decisions. Connect multiple data sources seamlessly within your collaborative workspace for holistic business analysis.
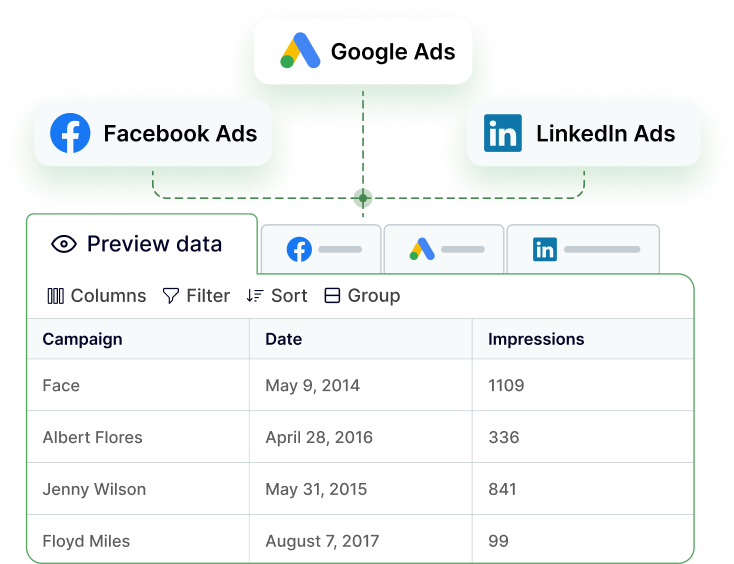
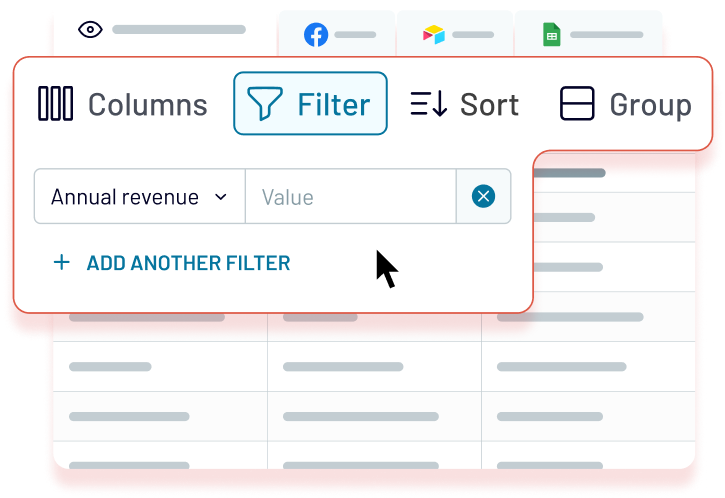
Transform complex subscription analytics into structured Google Sheets formats with automated customer segmentation, activity tracking, and periodic count summaries for immediate analysis. Pre-configured templates and formulas ensure instant productivity for your team.
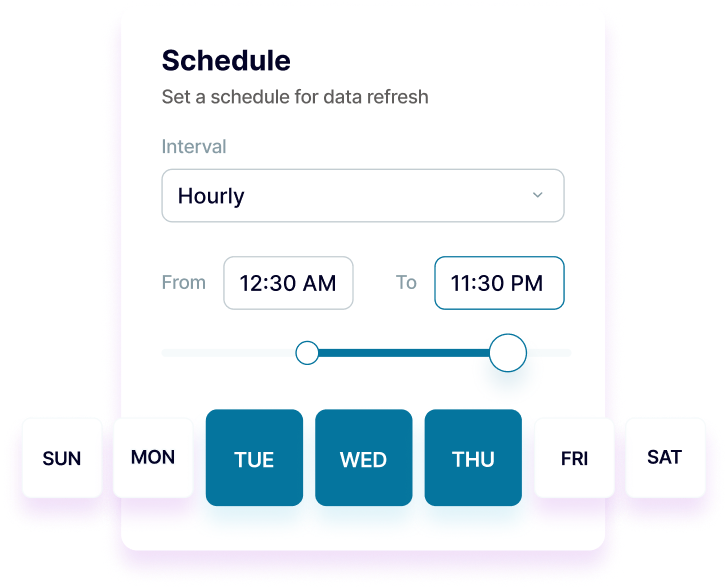
Keep your export subscription metrics updated automatically with scheduled exports from monthly to every 15-minute intervals. Ensure teams have access to fresh data without manual intervention.
Enable AI-powered analysis of customer behavior, subscription patterns, and revenue trends through intuitive conversational queries for actionable business insights. Ask questions in plain English and receive intelligent responses about your subscription data.



Why export ChartMogul to Google Sheets - real life cases
Collaborative revenue analysis
Customer success tracking
Subscription performance reporting
Executive dashboard creation
How to export ChartMogul to Google Sheets
Automate data exports with the no-code ChartMogul Google Sheets integration
Connect similar Finance & Accounting apps and get data in minutes
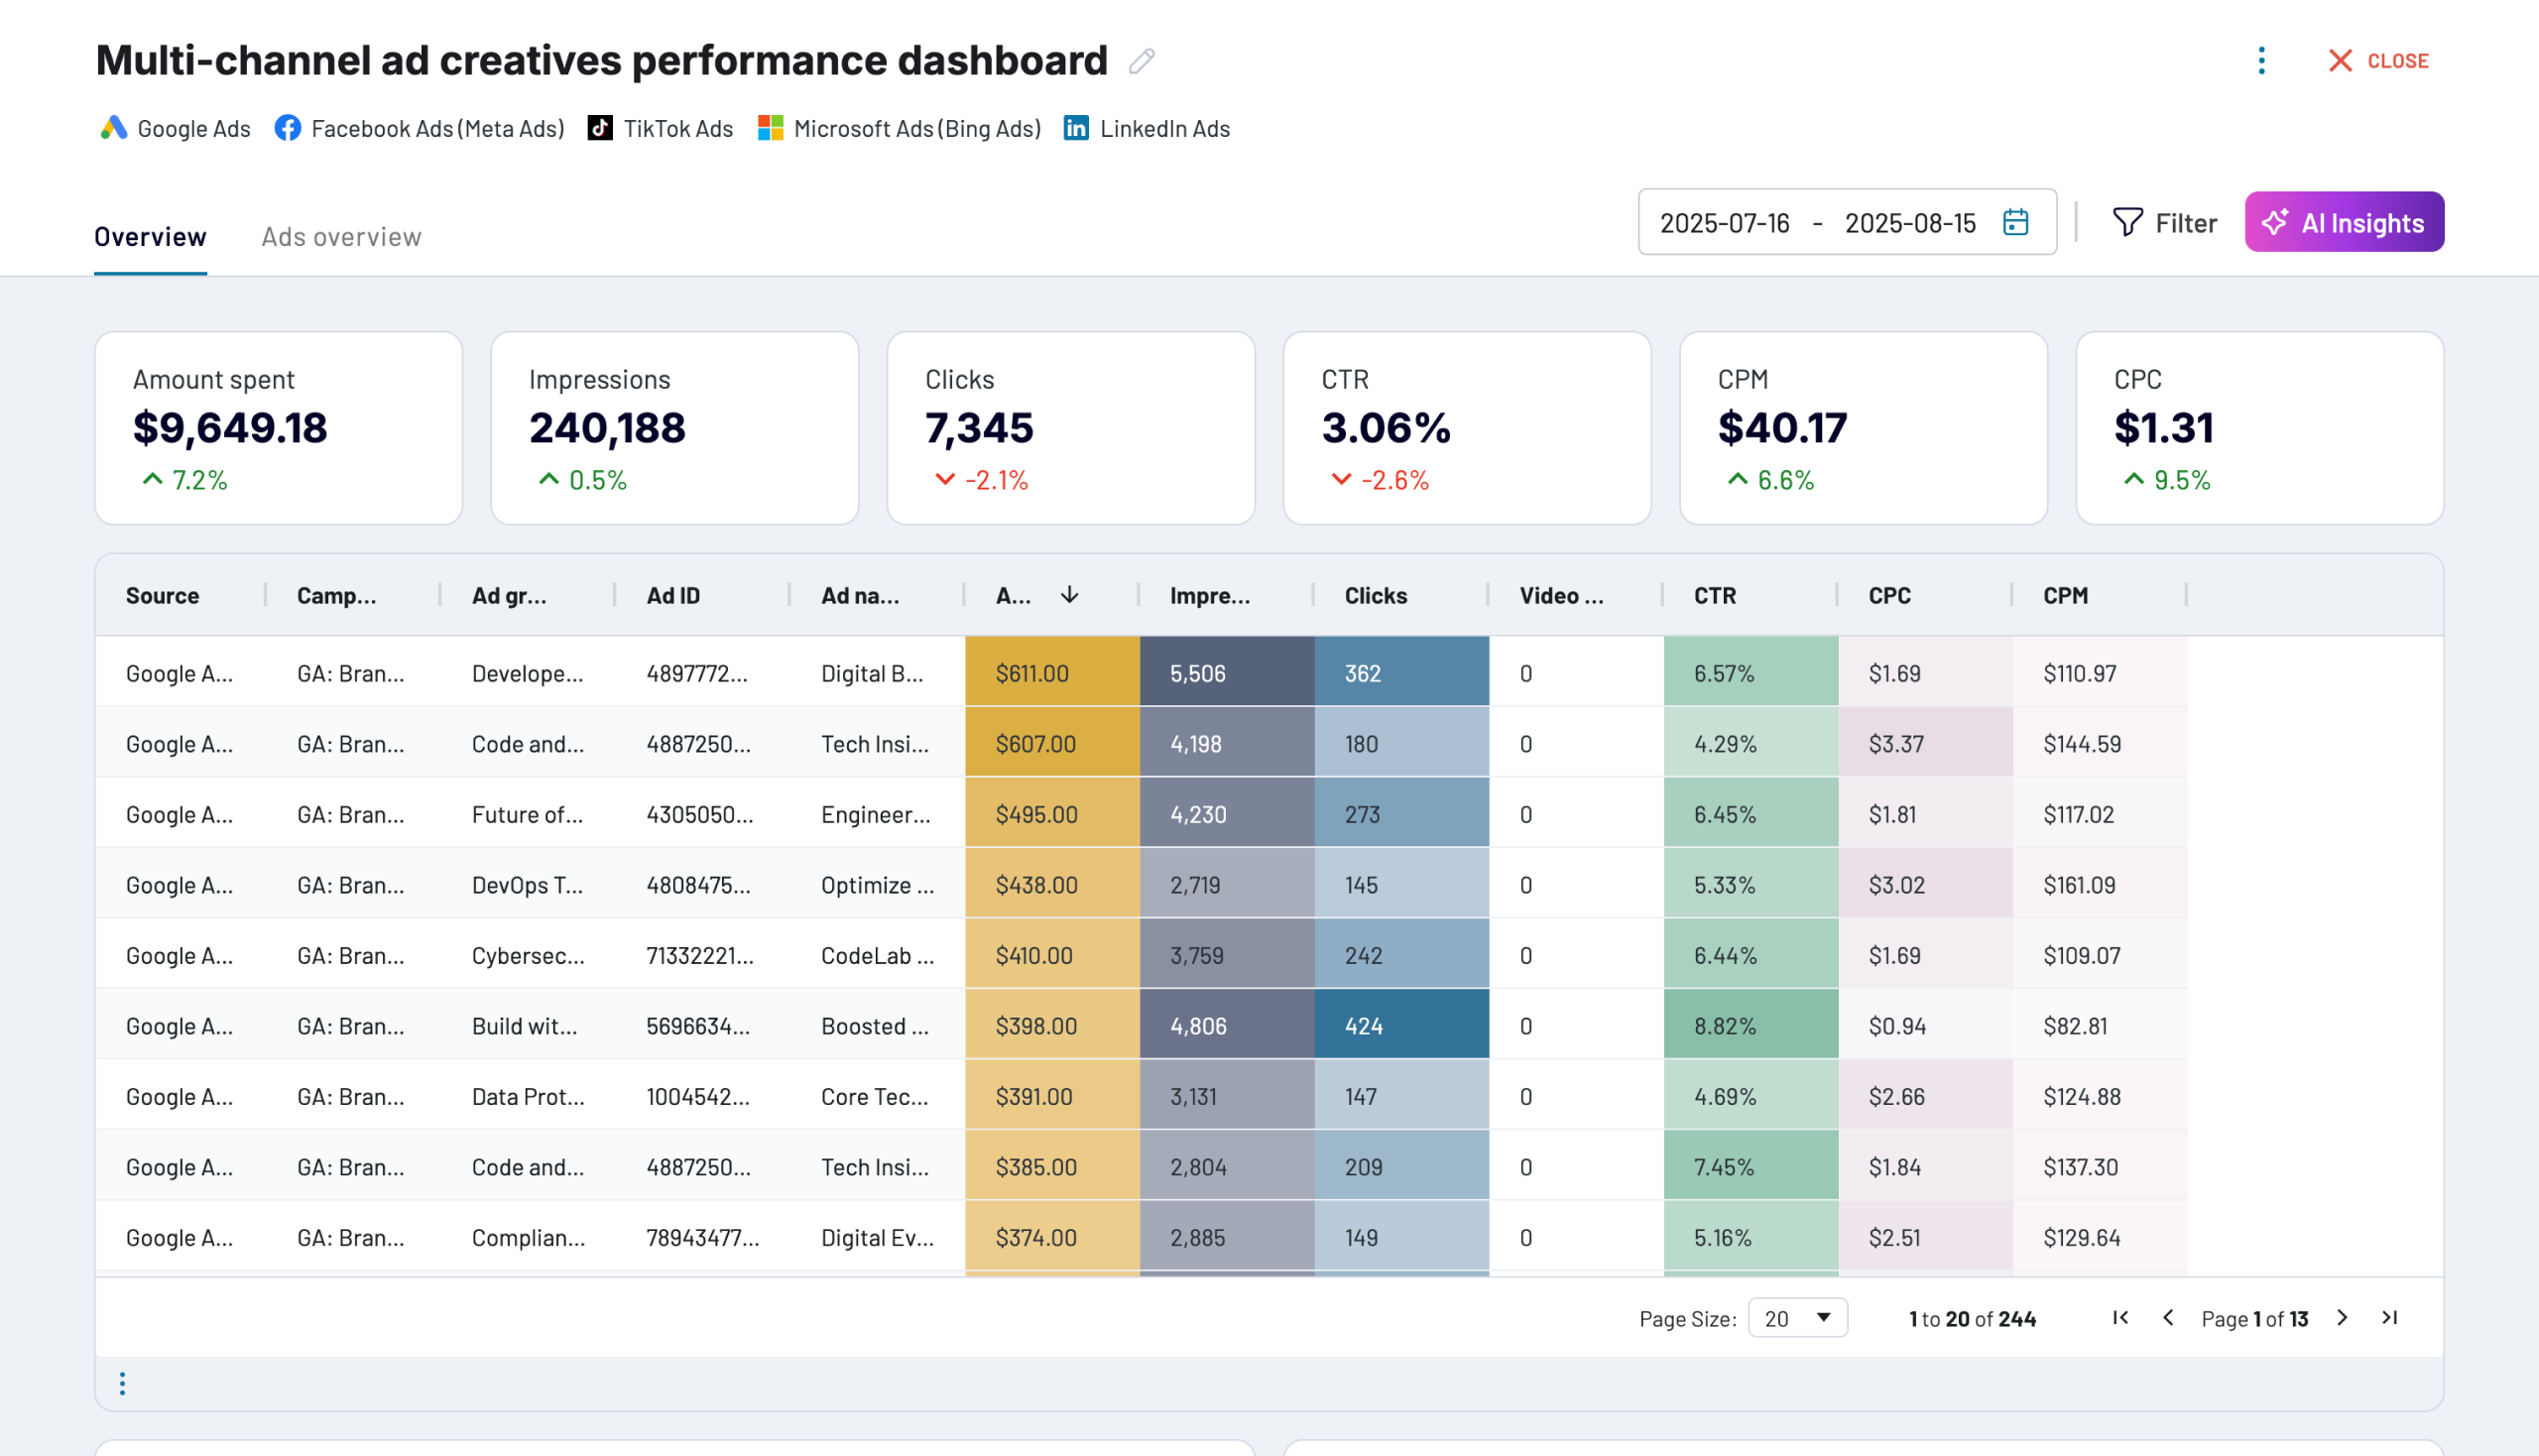
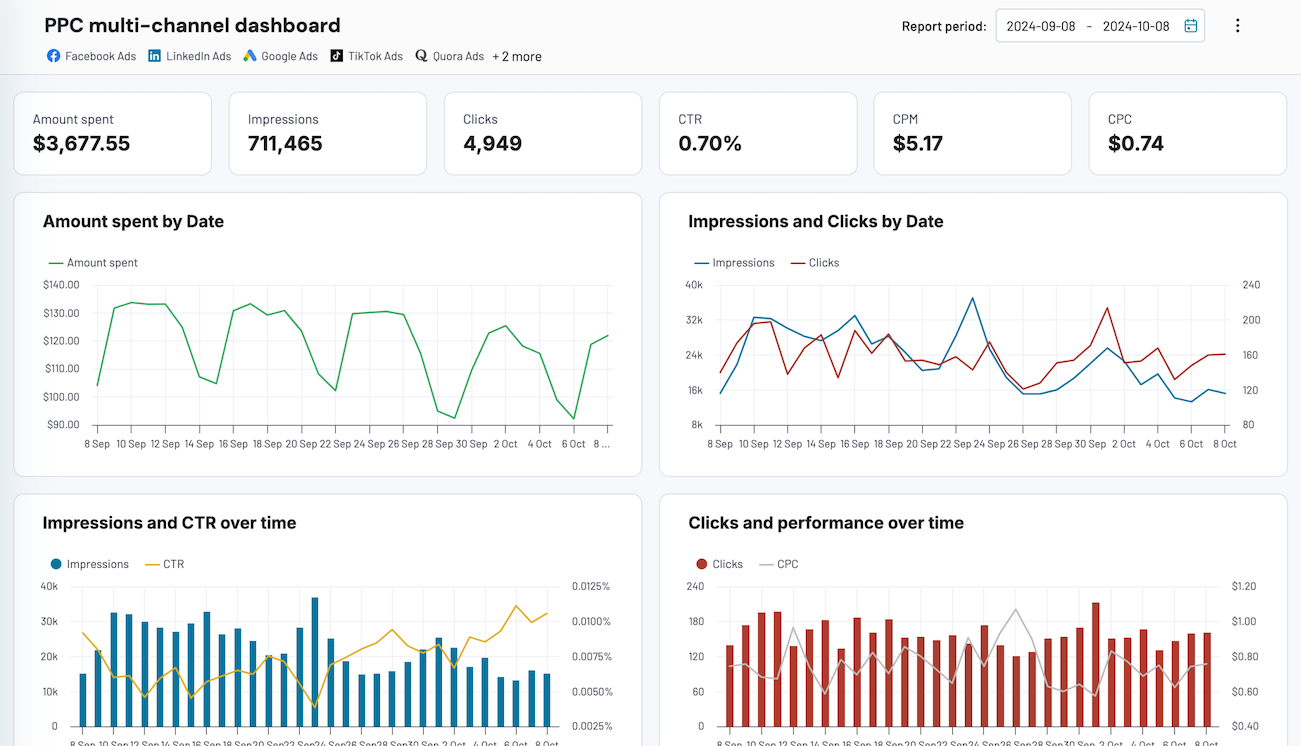
Quick start with dashboard templates




about your case. It doesn't cost you a penny 😉
Talk to AI about your Chartmogul data
Examples of questions you can ask about ChartMogul data:
- "What's our monthly customer churn rate trend over the last quarter?"
- "Which customer segments show the highest activity levels this month?"
- "How many customers did we acquire versus lose in the past week?"
- "What's the average subscription lifecycle length for our enterprise customers?"


Keep your data safe
Coupler.io safeguards your shared information and data transfers from breaches, leaks, and unauthorized disclosures.


