PPC multichannel dashboard template
A PPC multichannel dashboard template that supports data from the most common advertising platforms. This report is available in the most popular BI tools. Follow the instructions inside the template to make a copy of it and synchronize it with the required data sources.


Get the answers you need with PPC multi-channel dashboard
 Looker studio

 Power BI
 Tableau
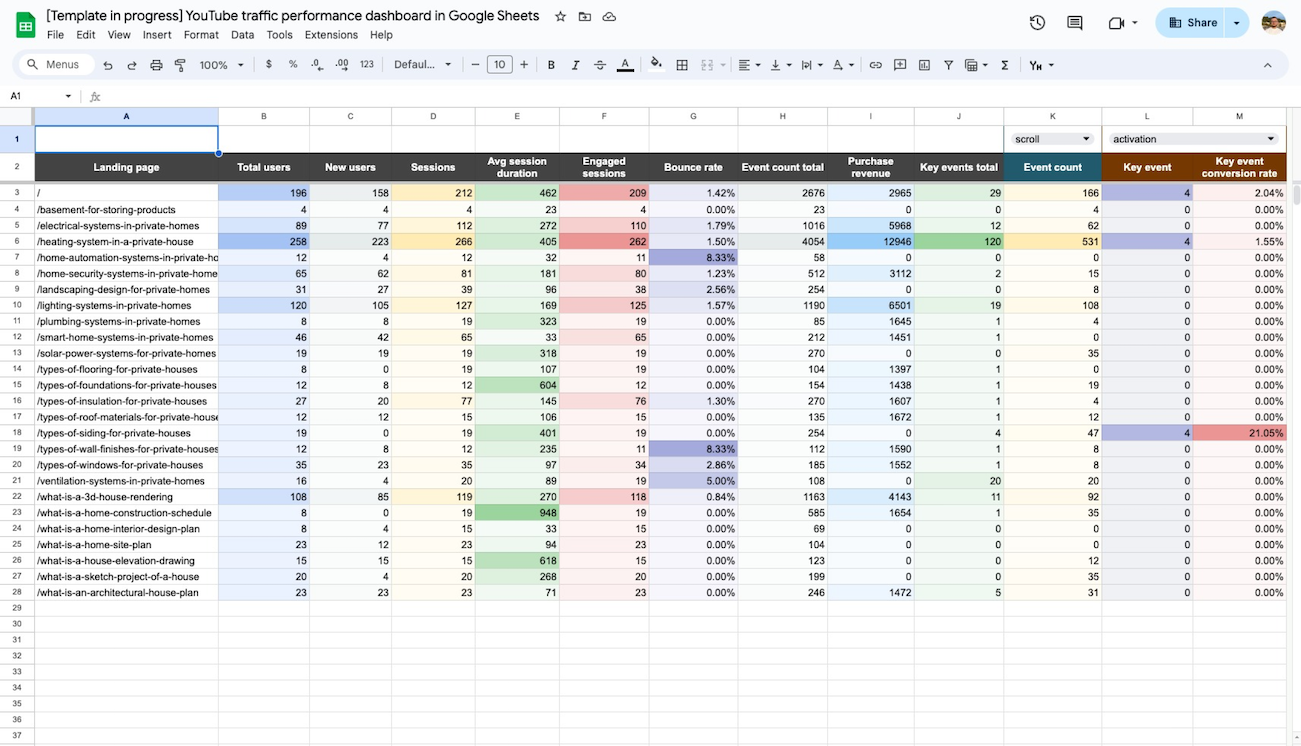
 Google Sheets


Acquire peace of mind with the interactive PPC multichannel dashboard
Ready-to-use analytical tool
Start tracking key metrics without any complex setups. Connect the dashboard to your ad accounts with just a few clicks following the instructions inside.
Automated data refresh
With Coupler.io under the hood, get the charts populated with the latest data from your PPC accounts. Set up the desired refresh frequency, up to every 15 minutes.
White-label template
Customize the template to fit your needs by adjusting metrics, visuals, etc. Easily share PPC campaign insights with stakeholders at the click of a button.
Metrics you can track with the PPC reporting dashboard

No need to build a PPC multichannel dashboard from scratch.
Use our fully automated template!
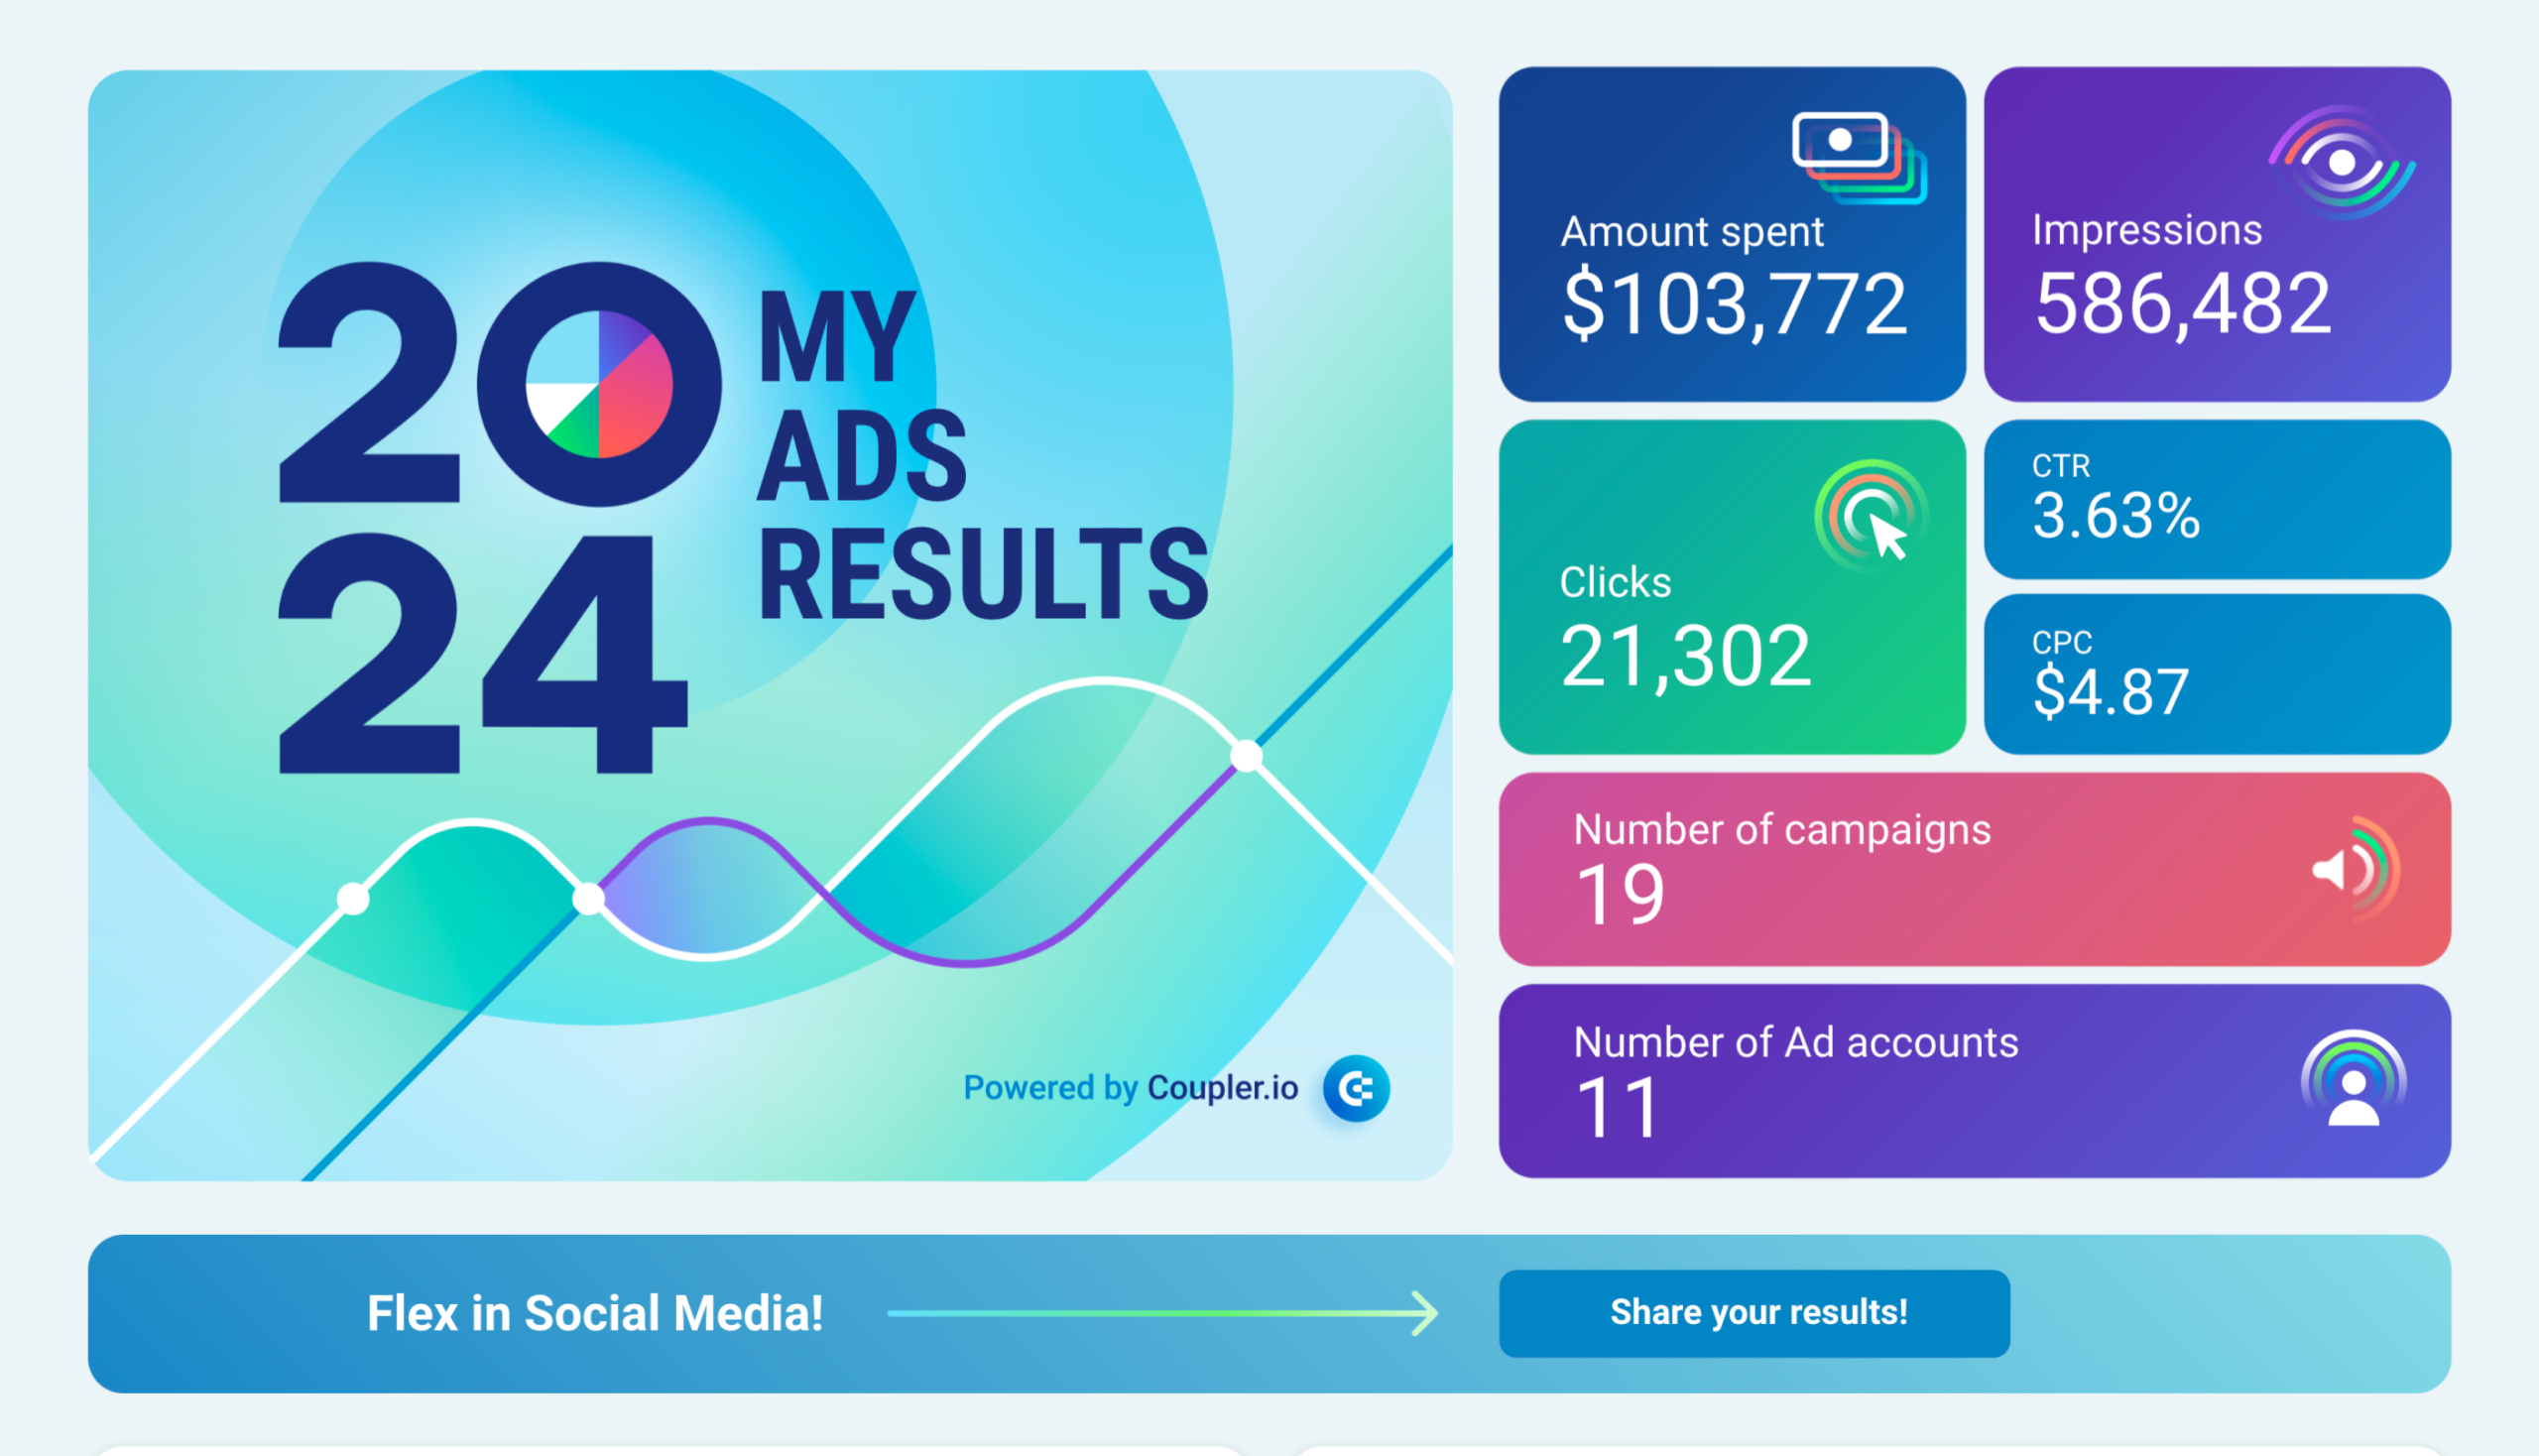
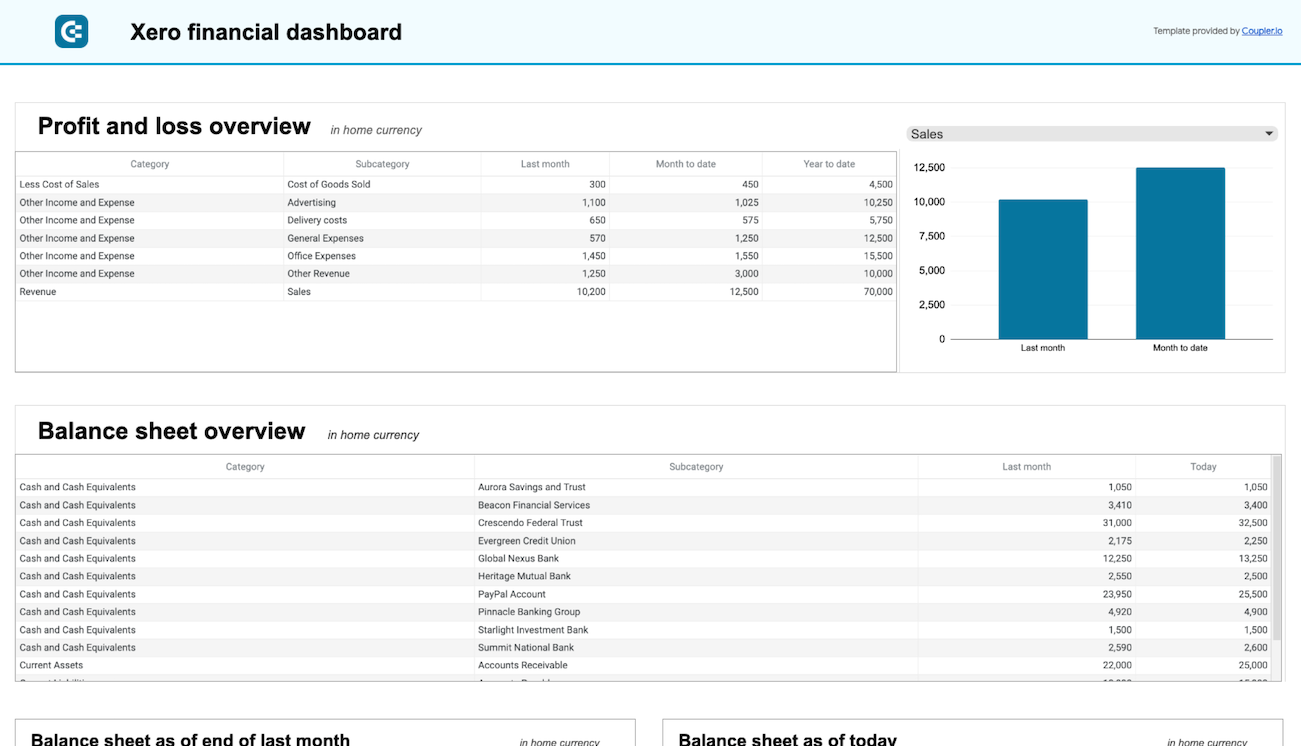
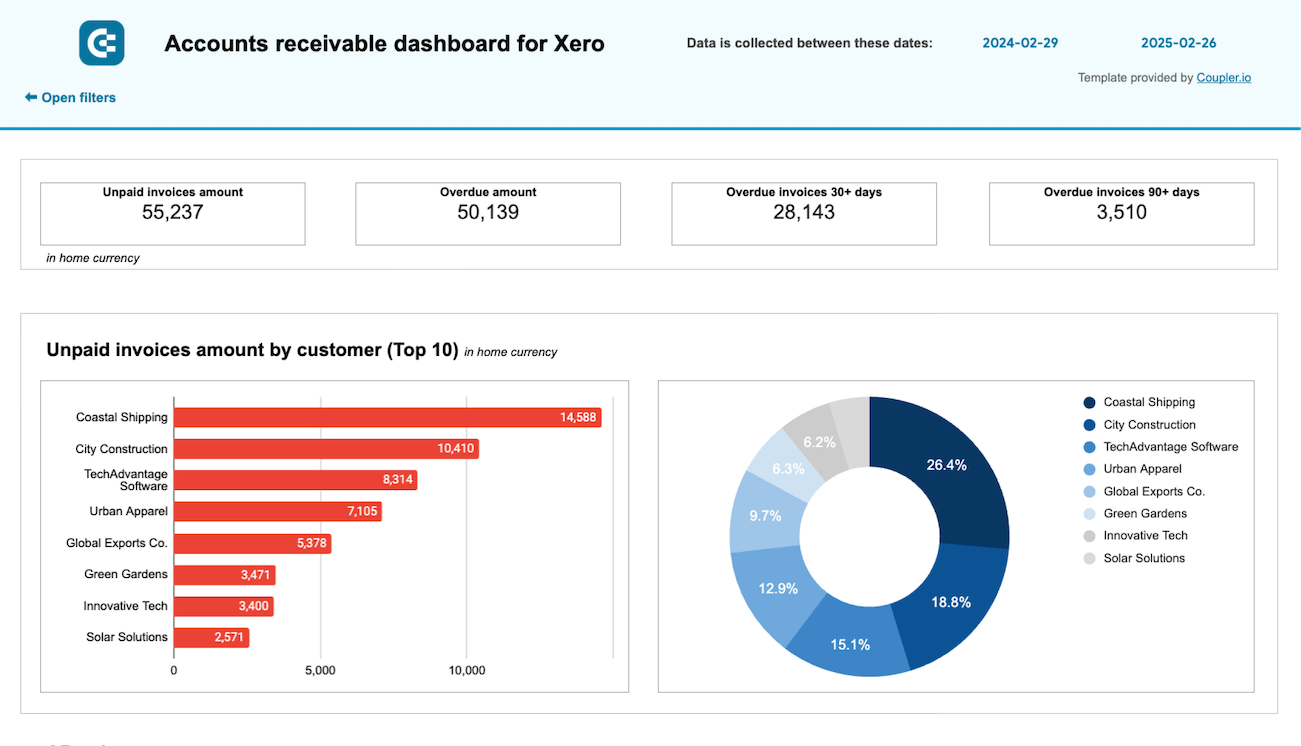
Examples of dashboards for every need


about your case. It doesn't cost you a penny 😉
- Automation - you save time on reporting since you won’t have to manually collect and organize data for the report. The dashboard connects to the selected ad platforms and refreshes automatically according to the set schedule. You can have it enabled as frequently as every 15 minutes.
- One connector to multiple channels - you don't have to use different solutions to load data to the dashboard. The template is equipped with a single connector by Coupler.io. It supports multiple advertising channels. With only one solution, you automate data flow from Google Ads, Facebook Ads, LinkedIn Ads, and other sources.
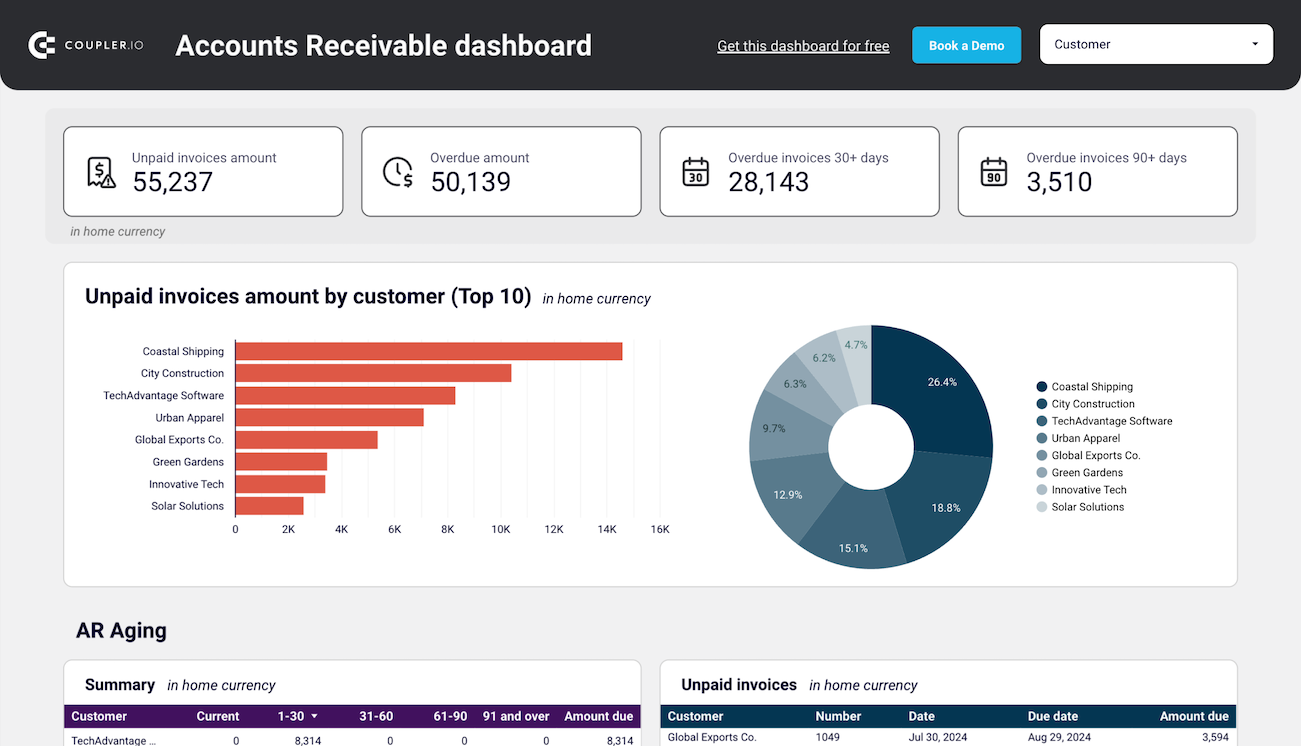
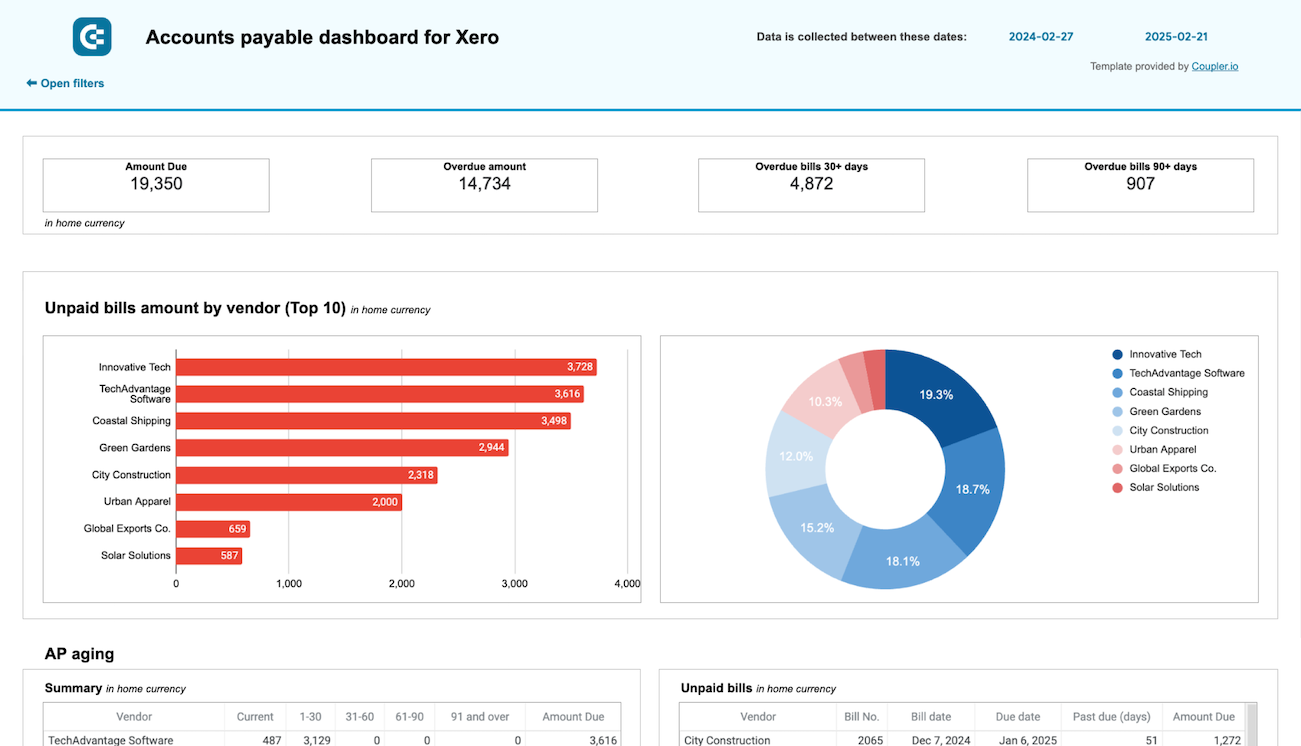
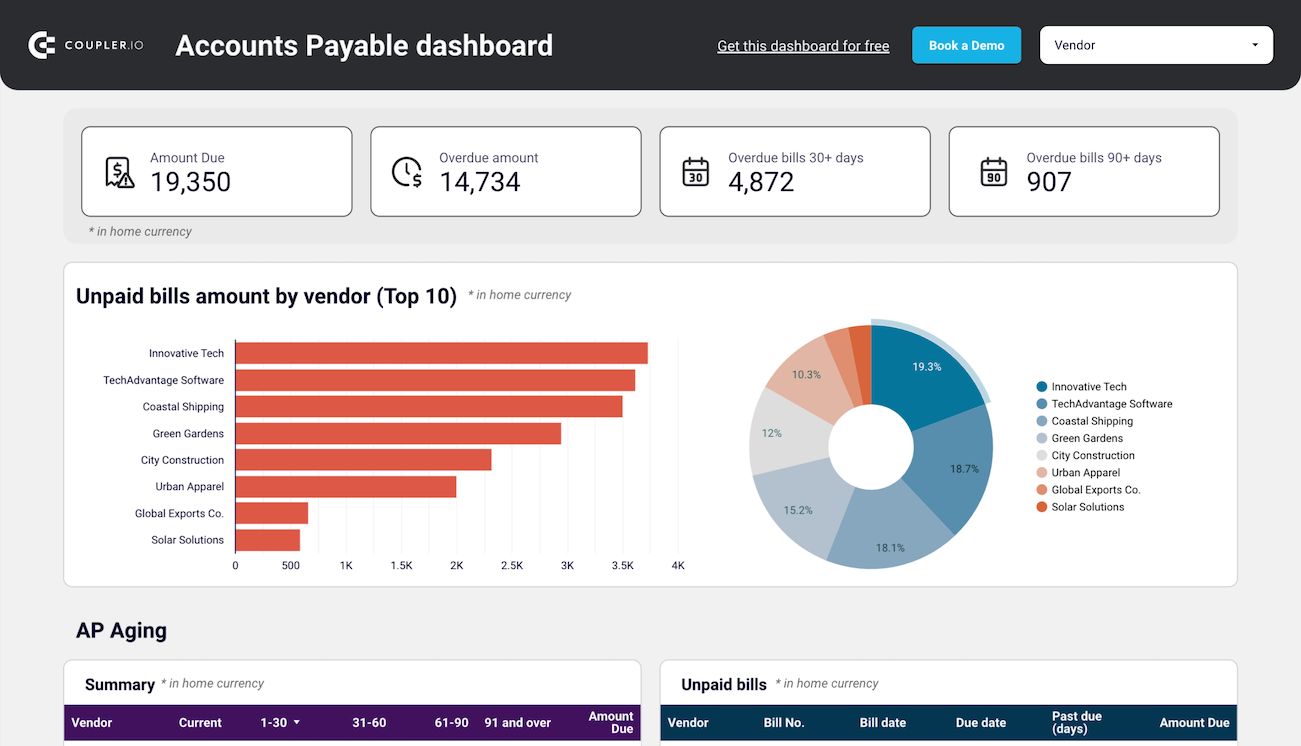
- Insights into your ad campaigns - you get your data organized in a digestible form. The dashboard provides you with insights to detect bottlenecks and weak points of your PPC marketing.
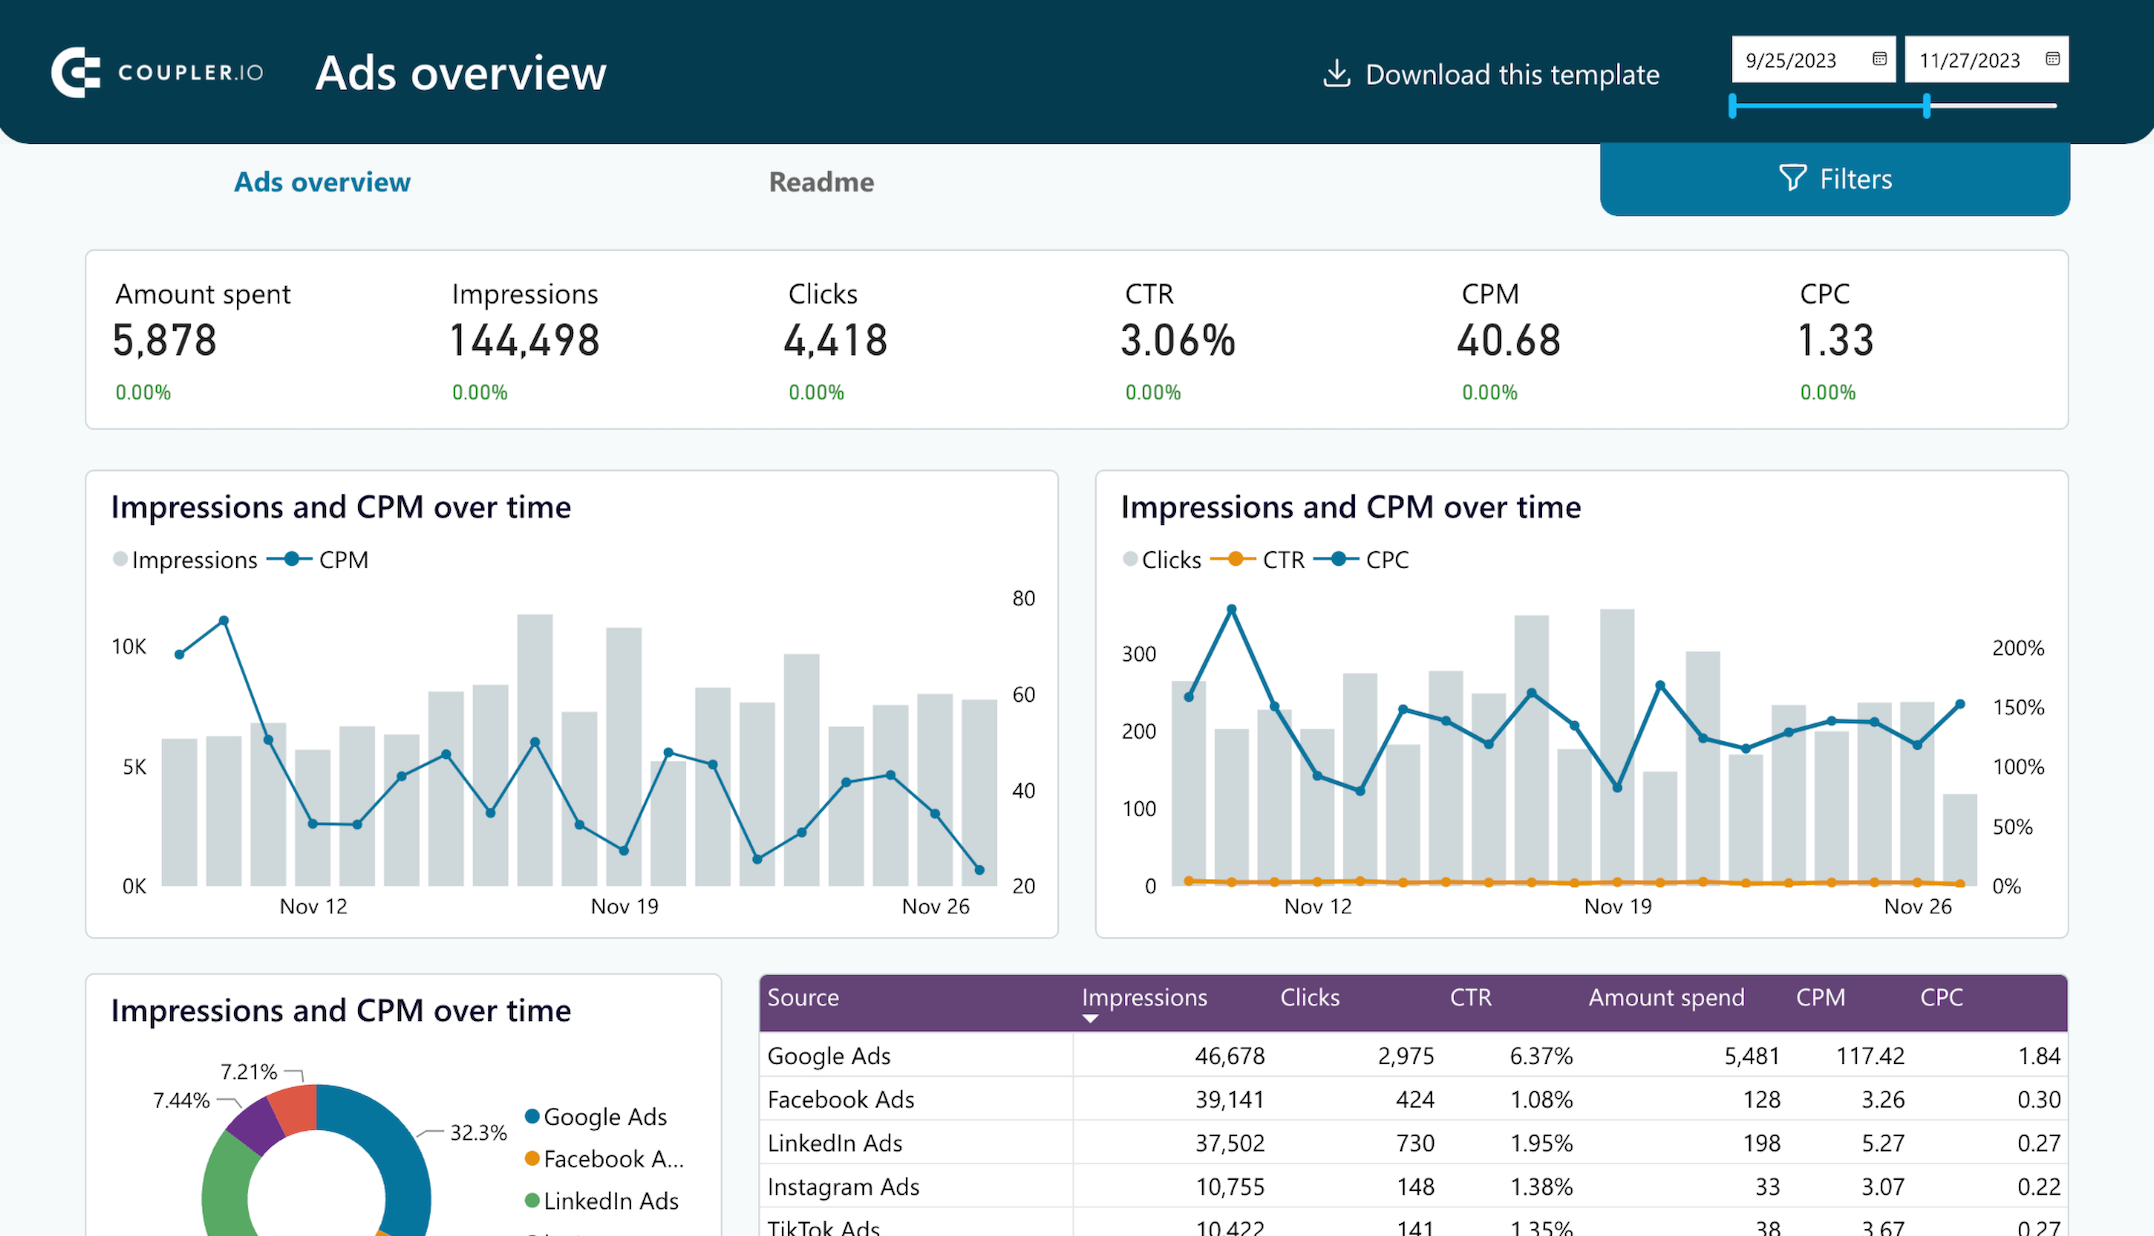
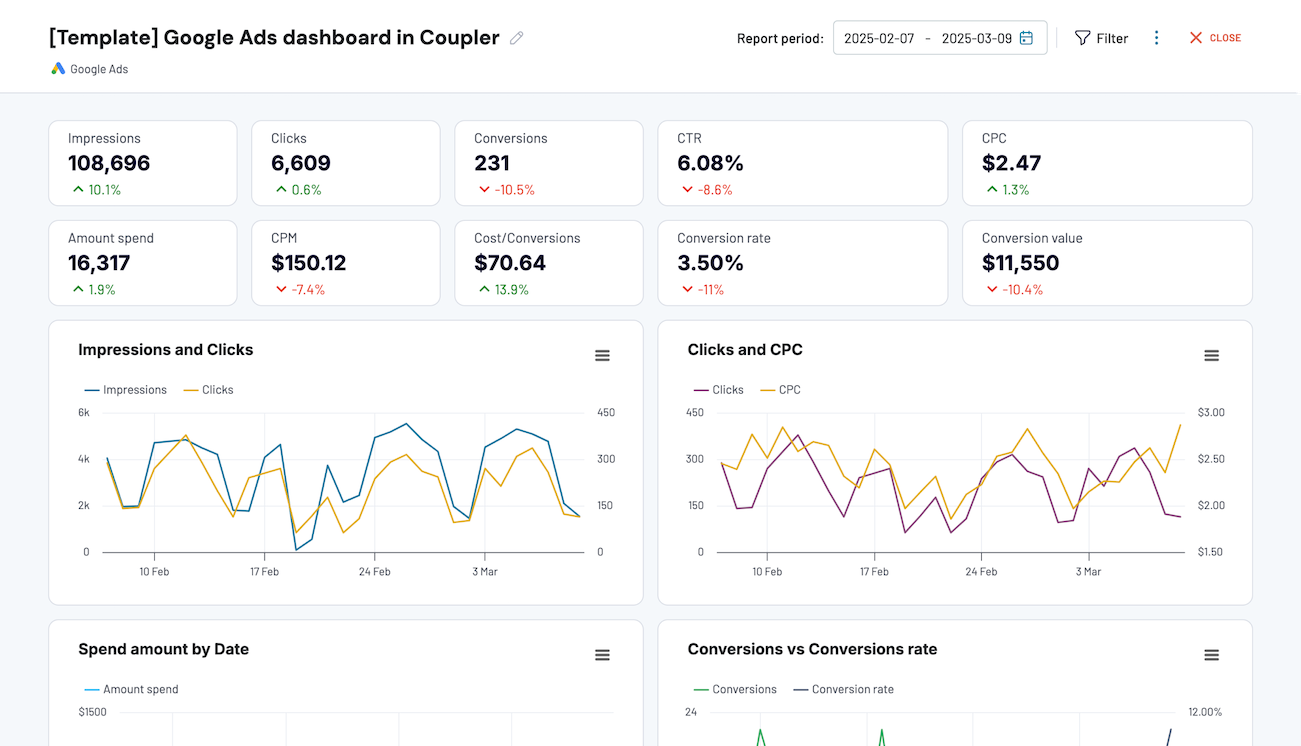
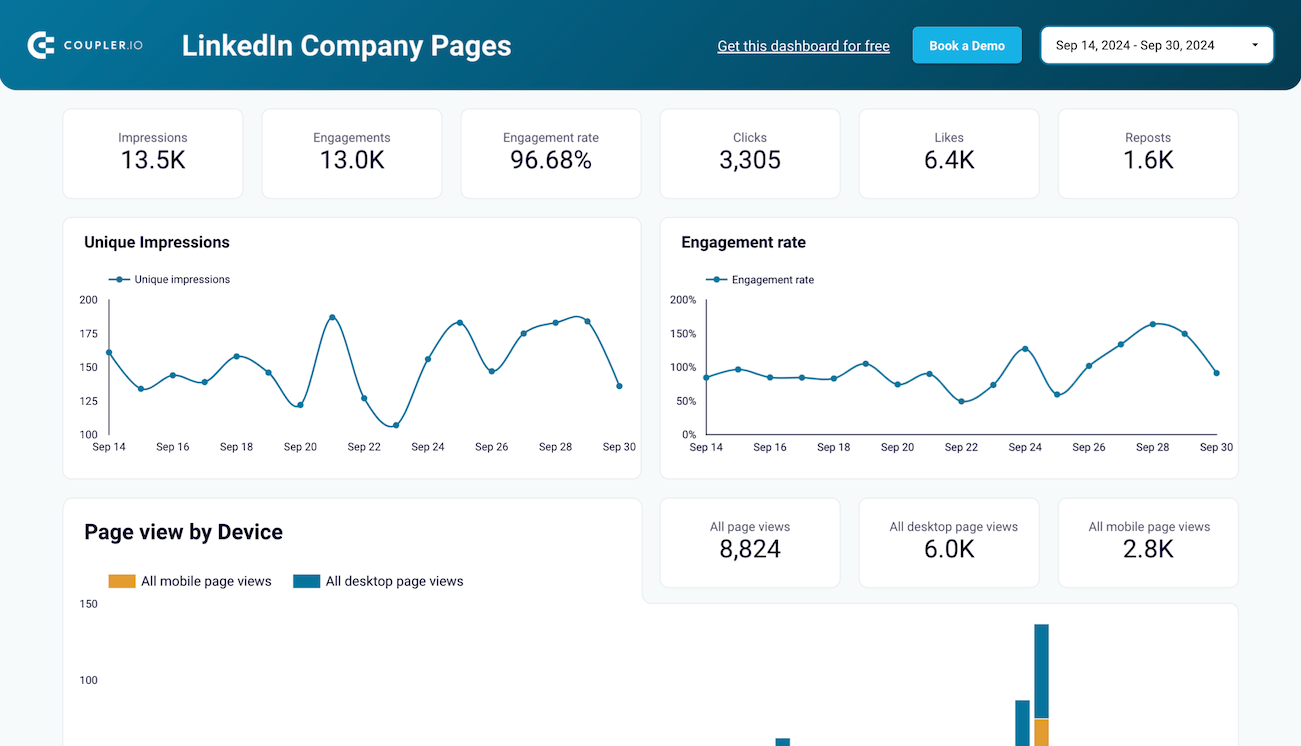
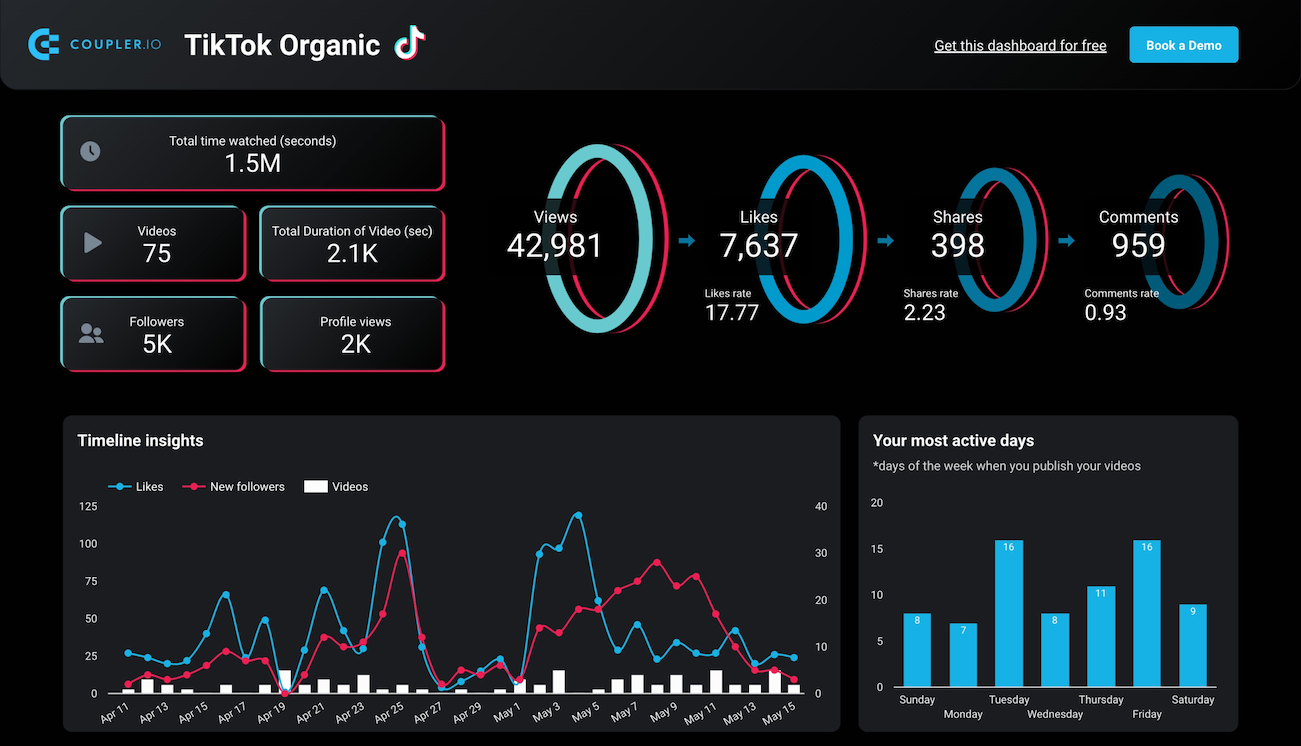
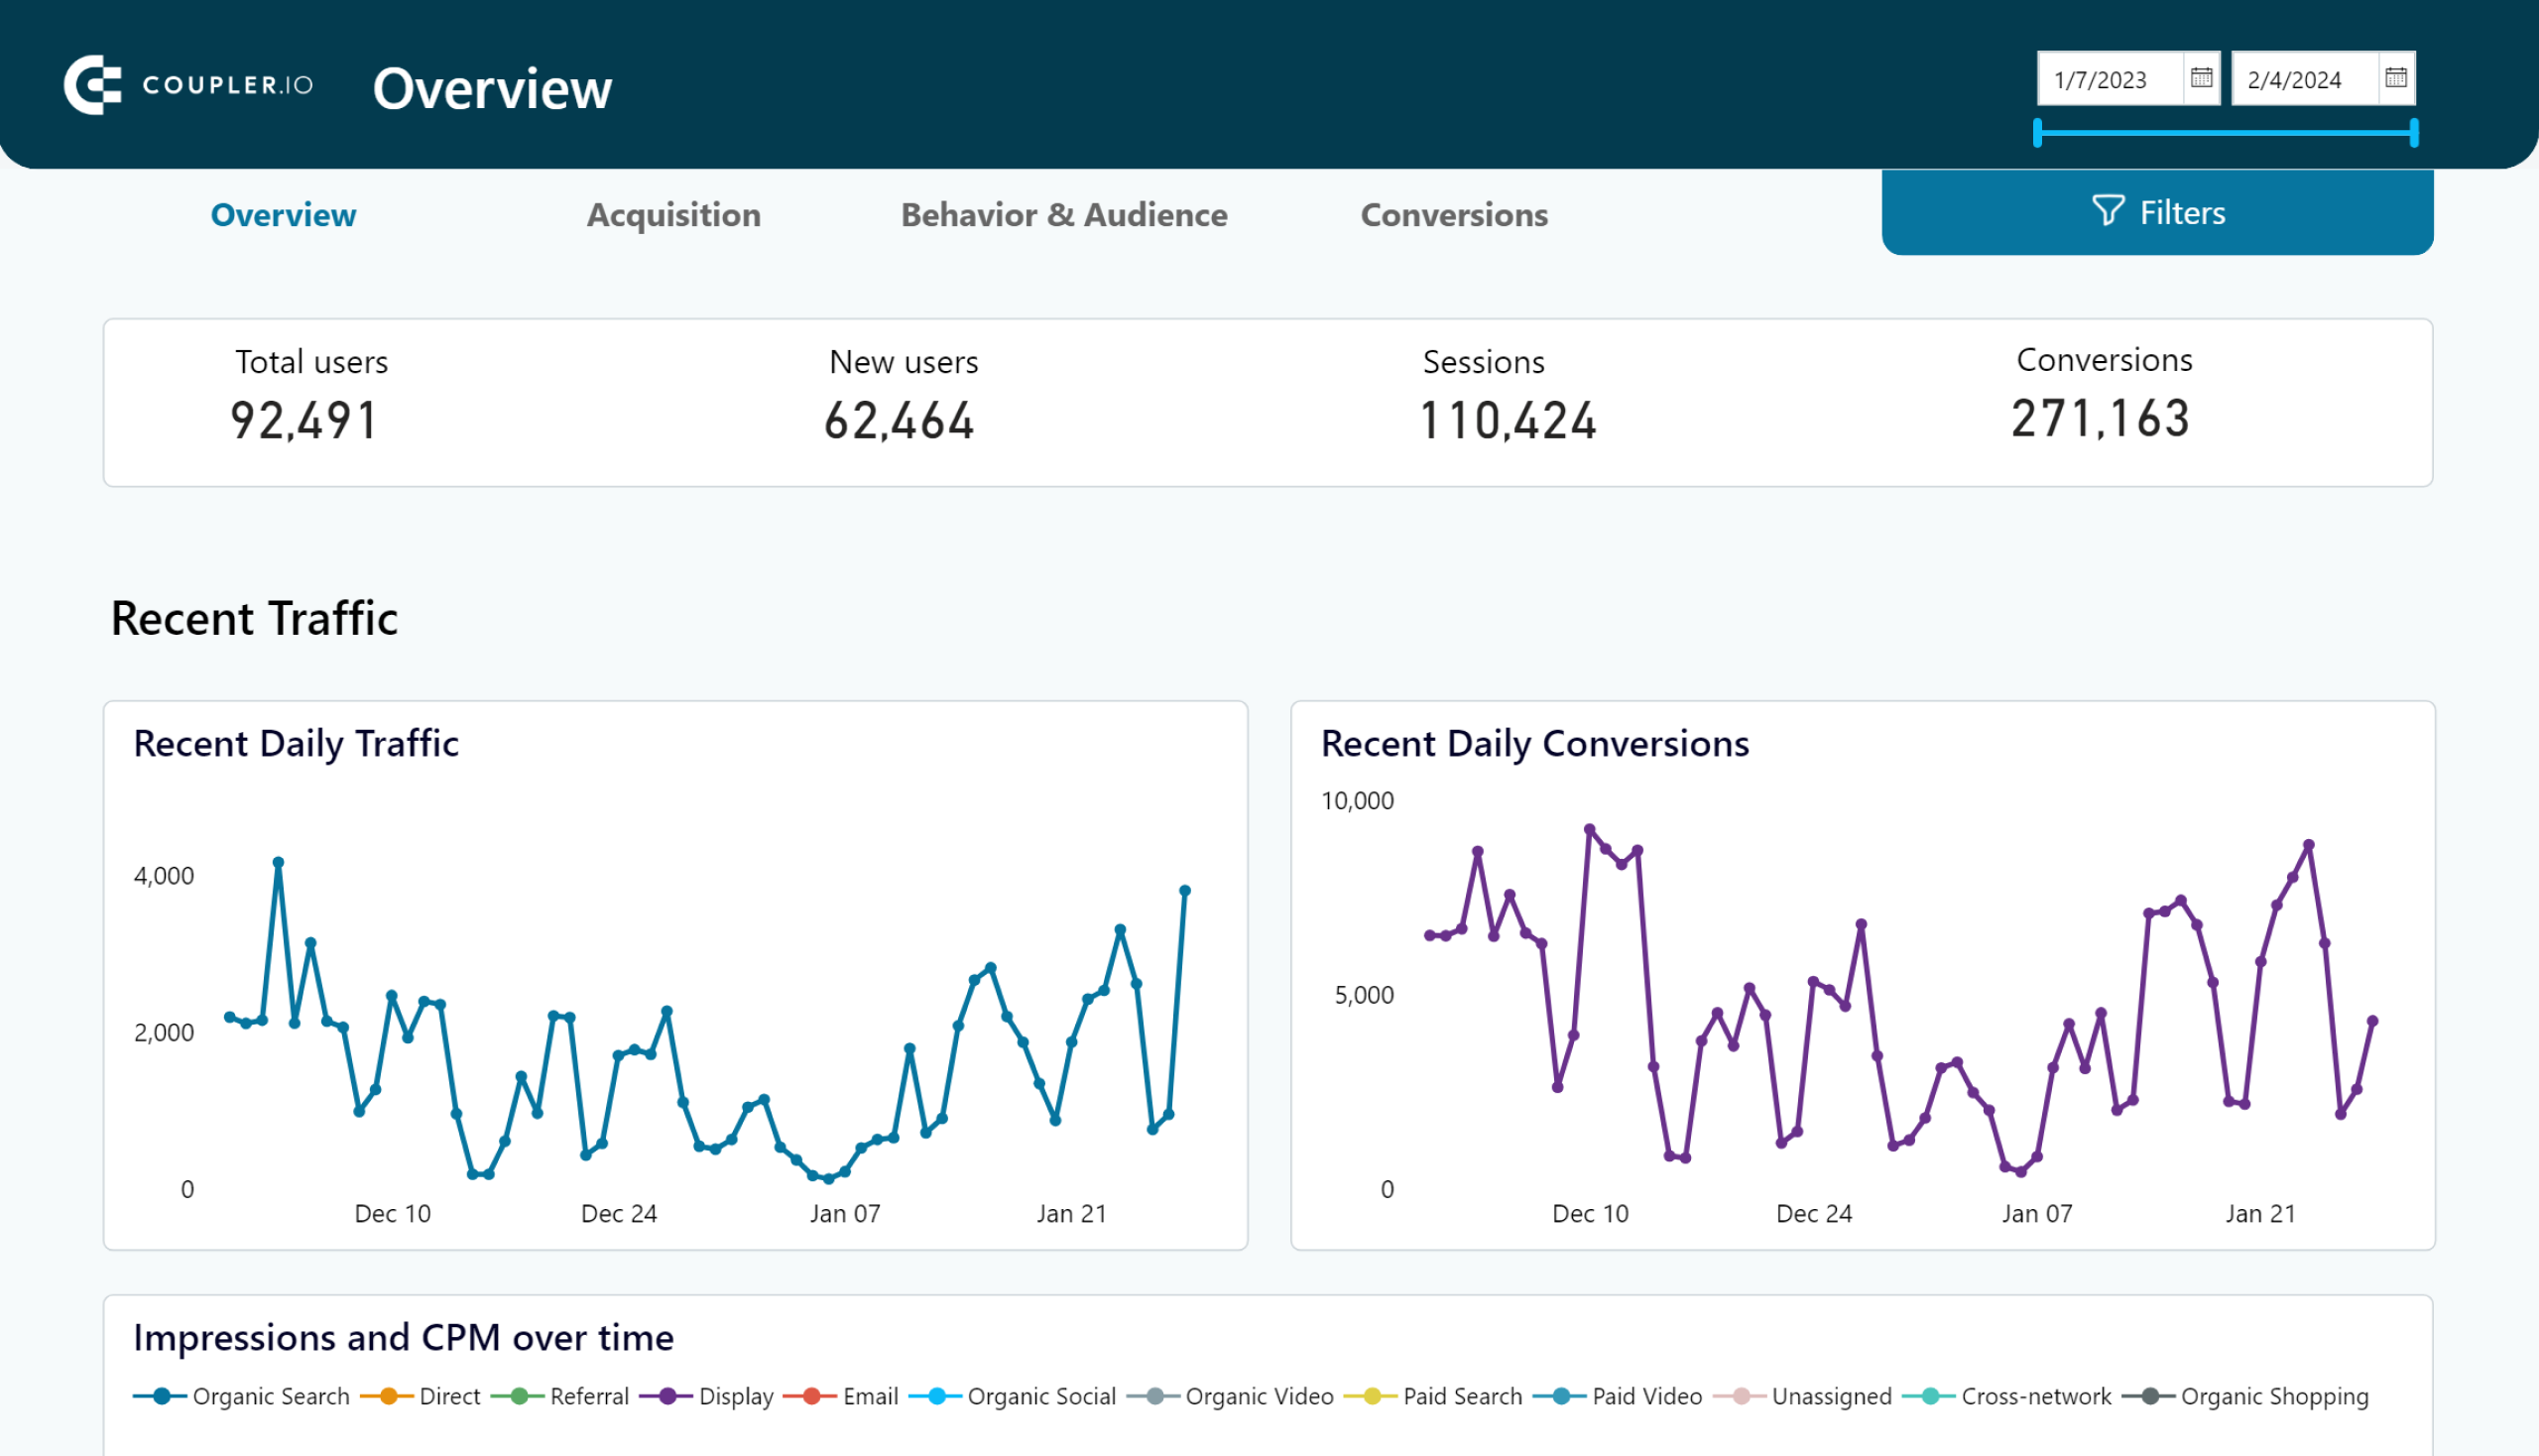
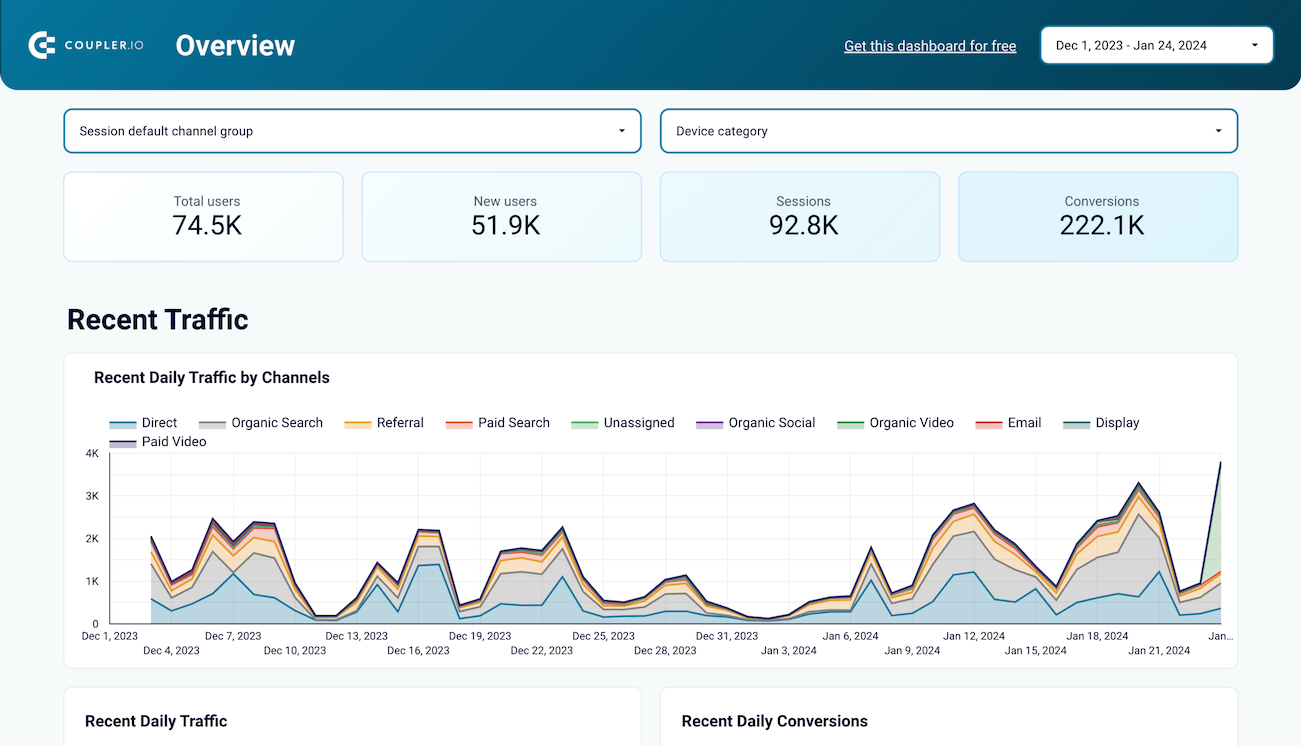
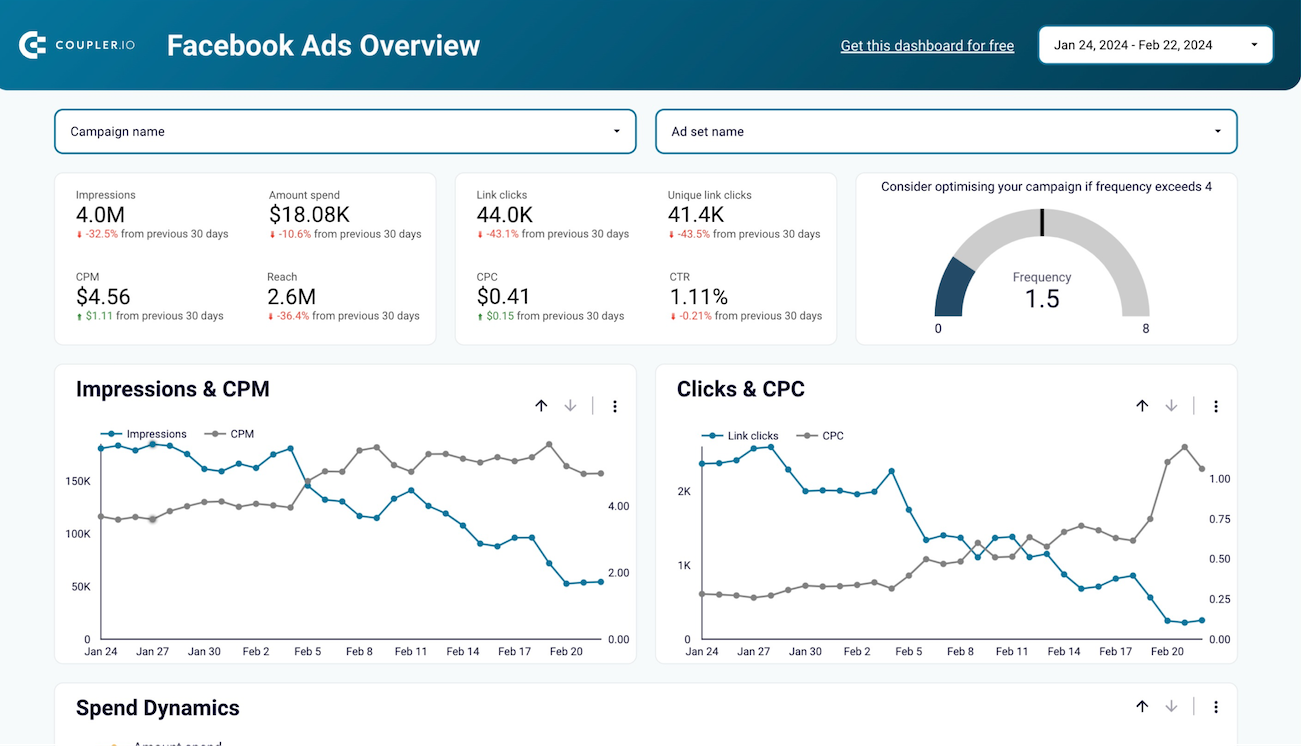
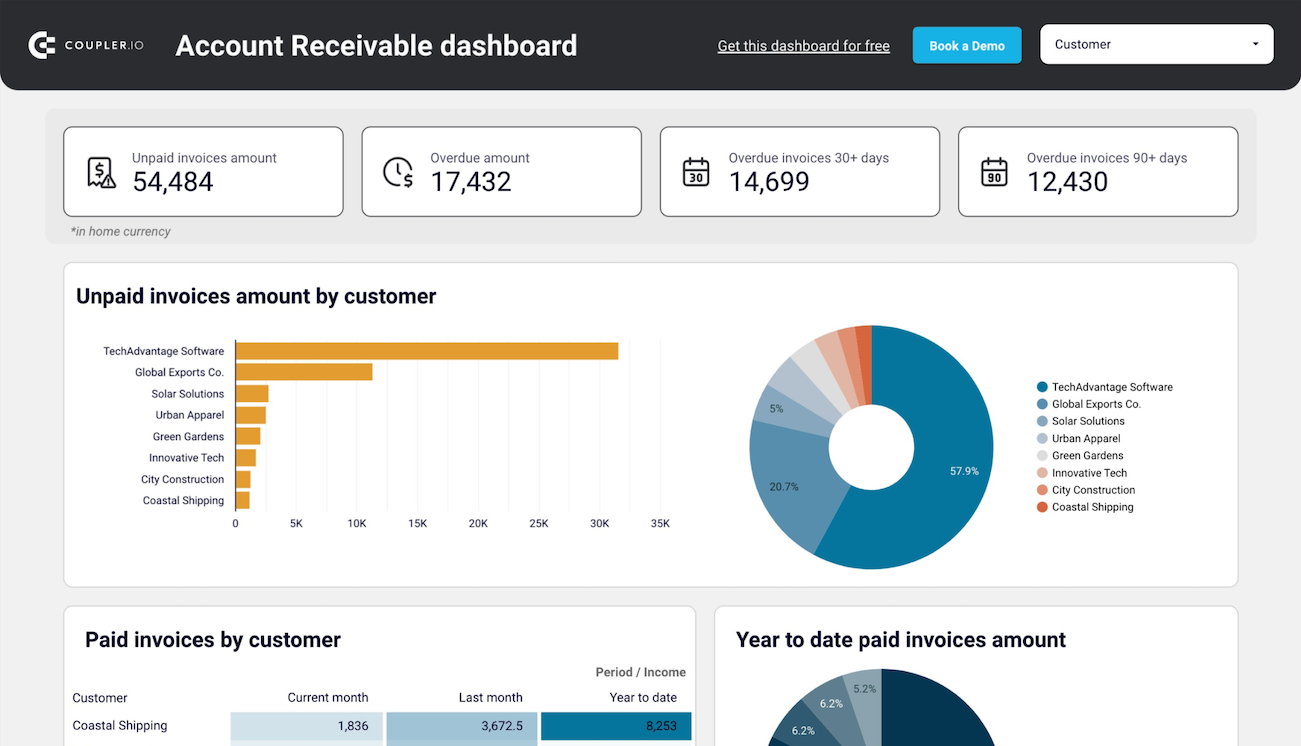
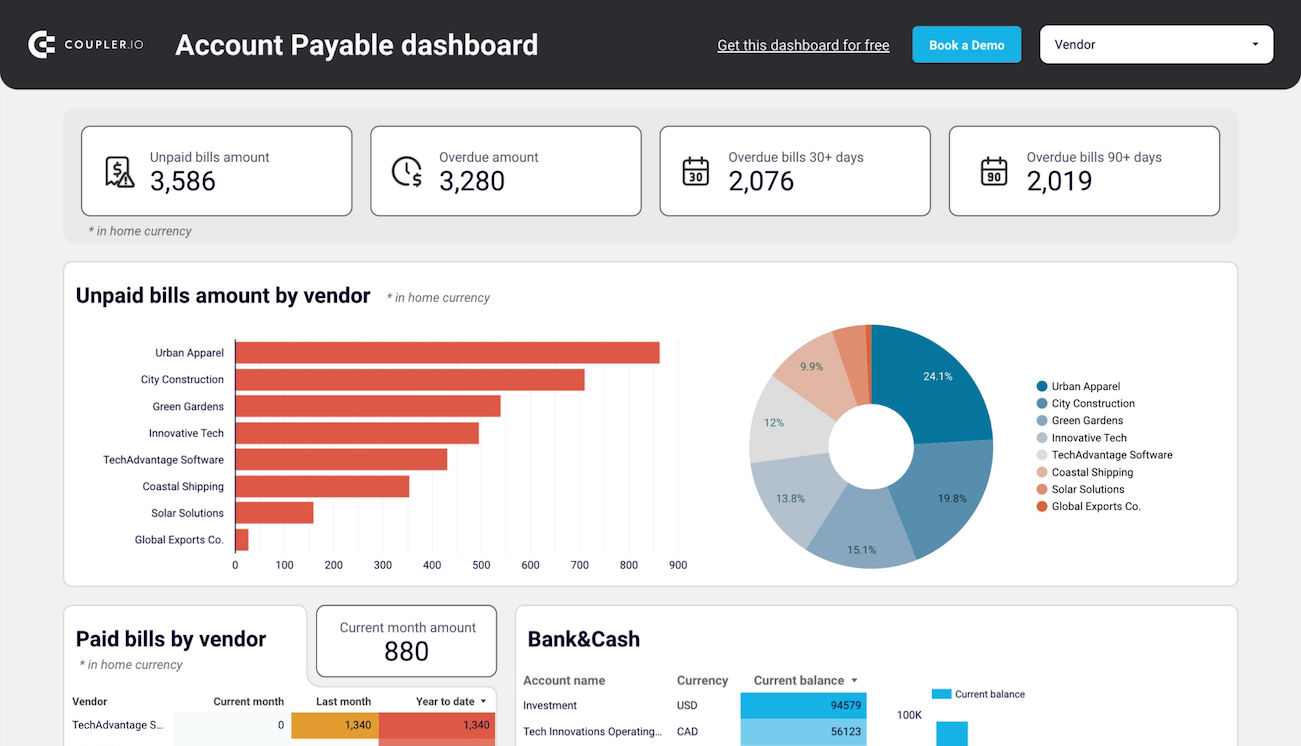
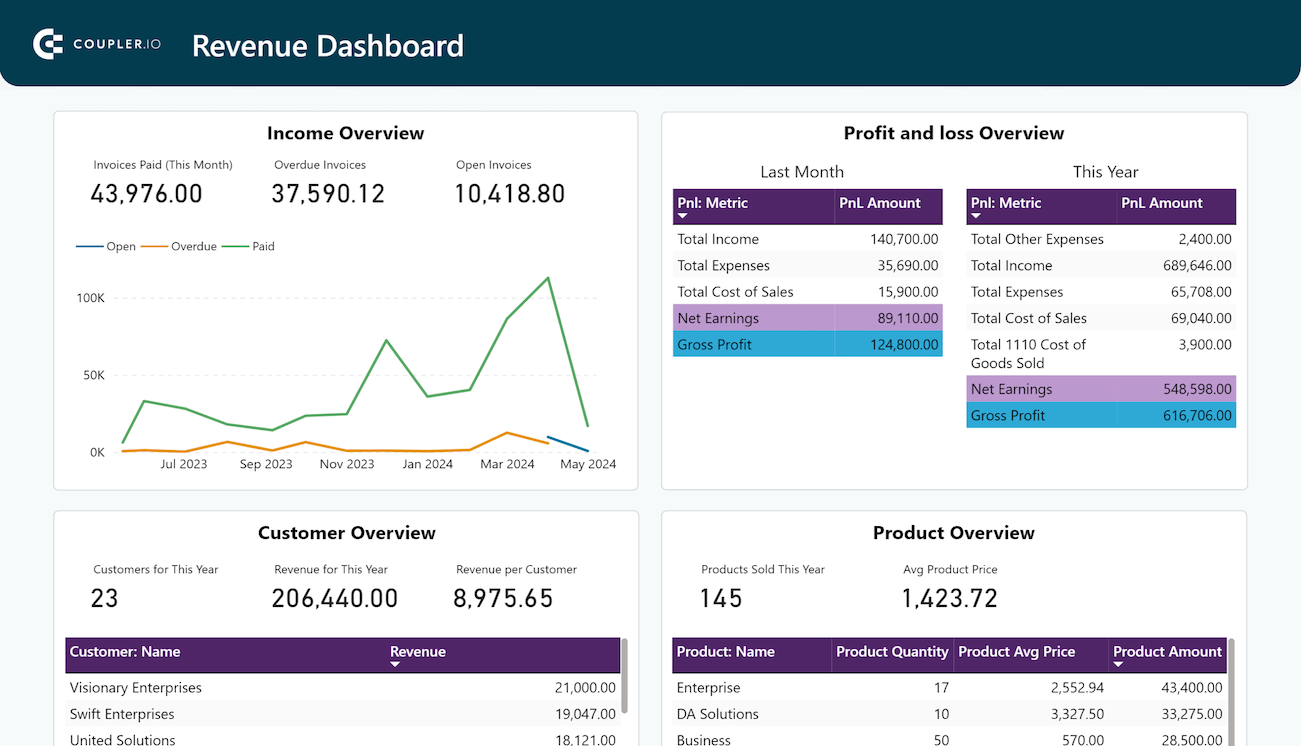
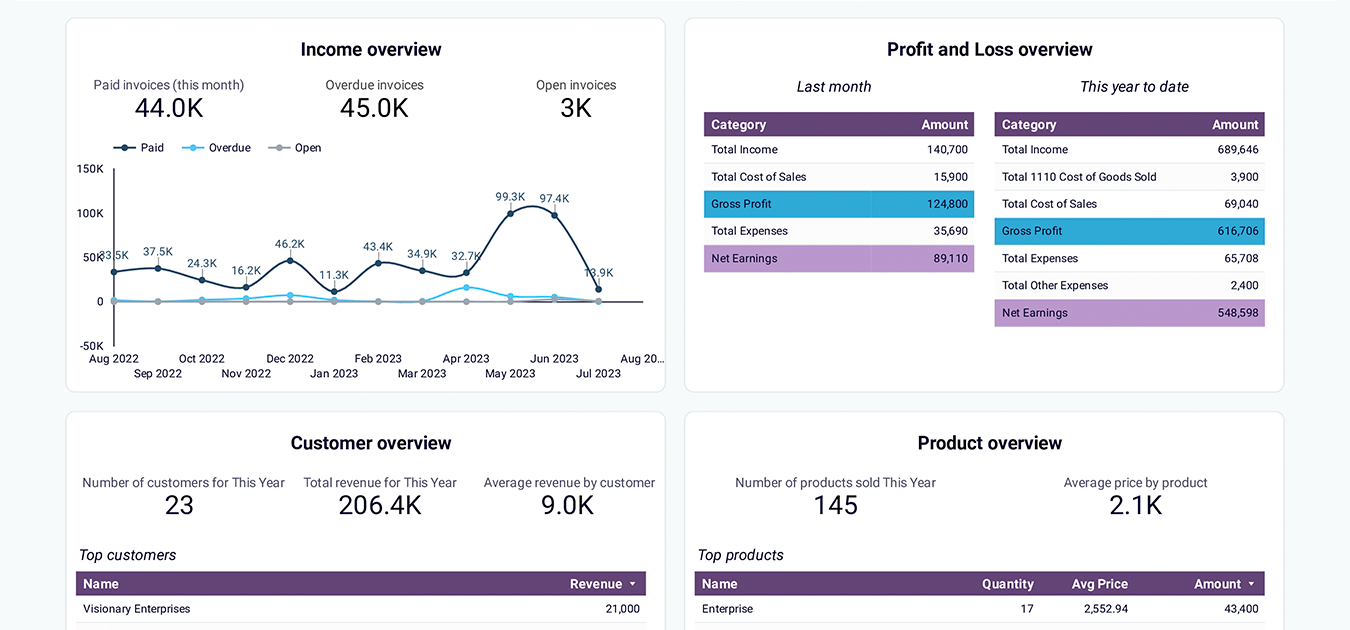
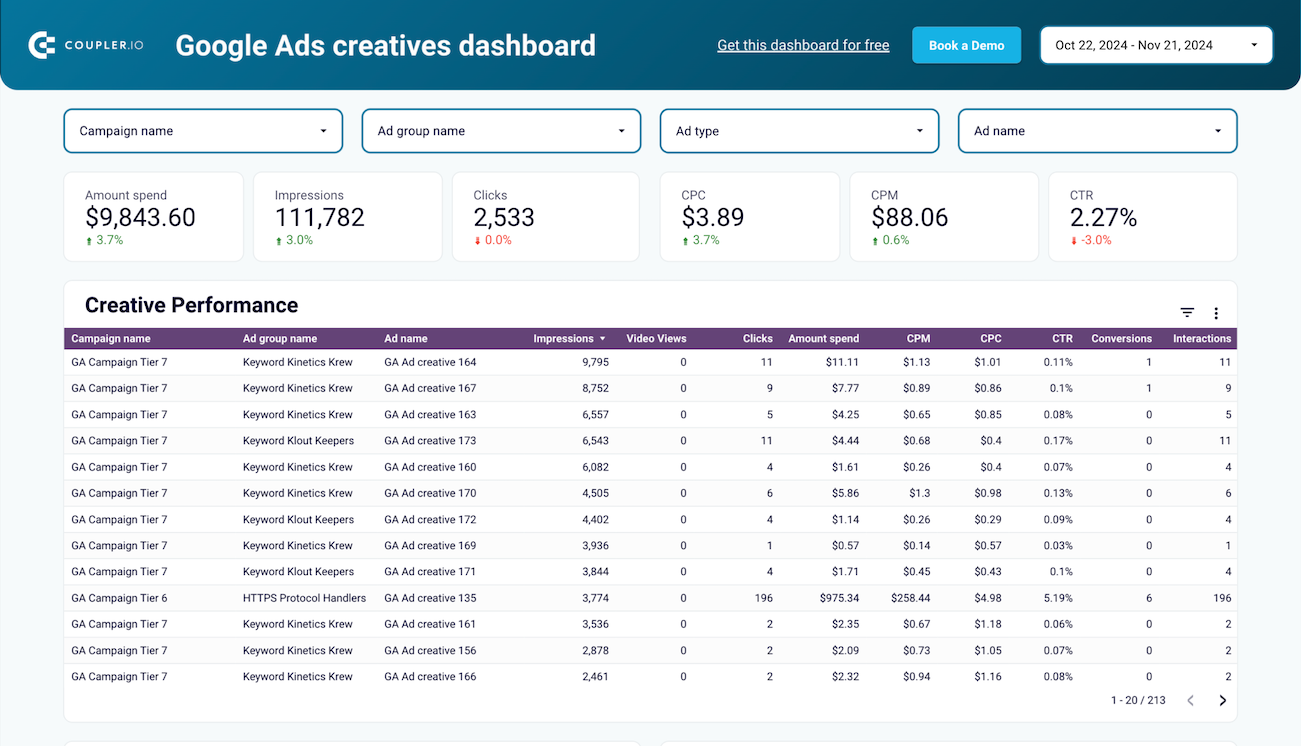
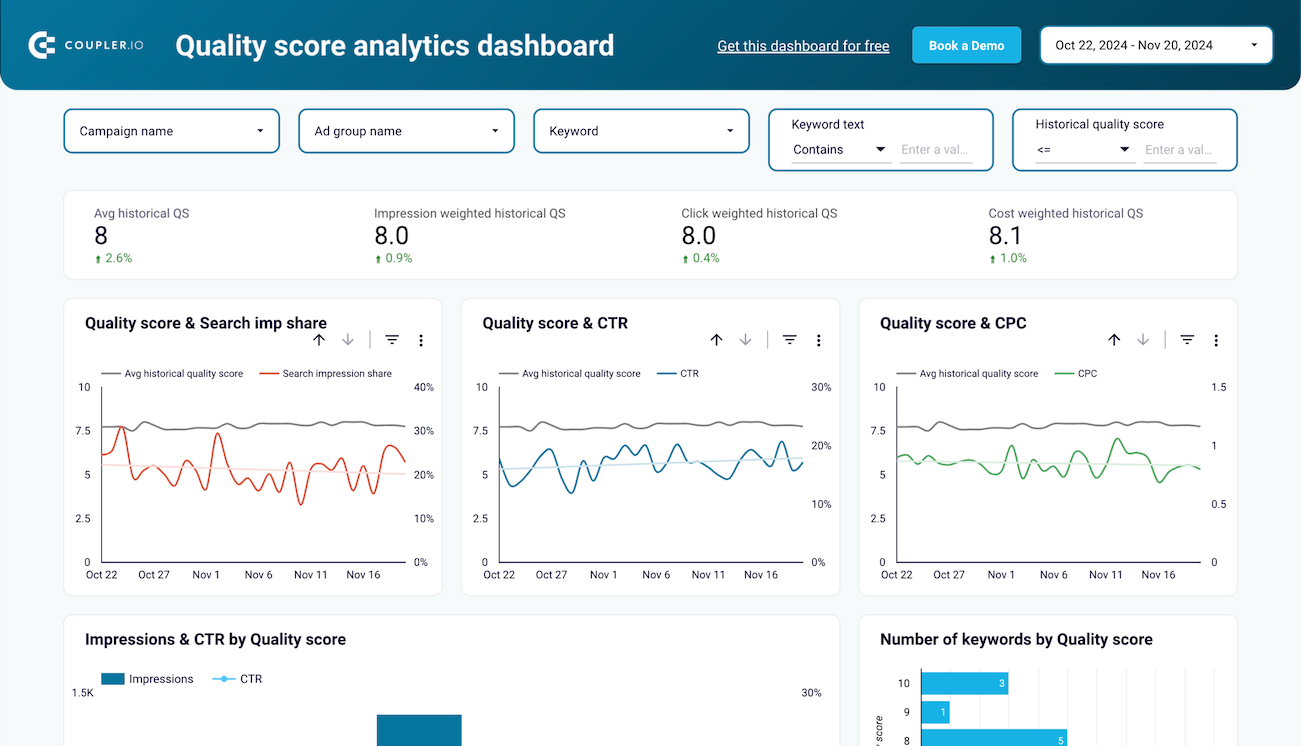
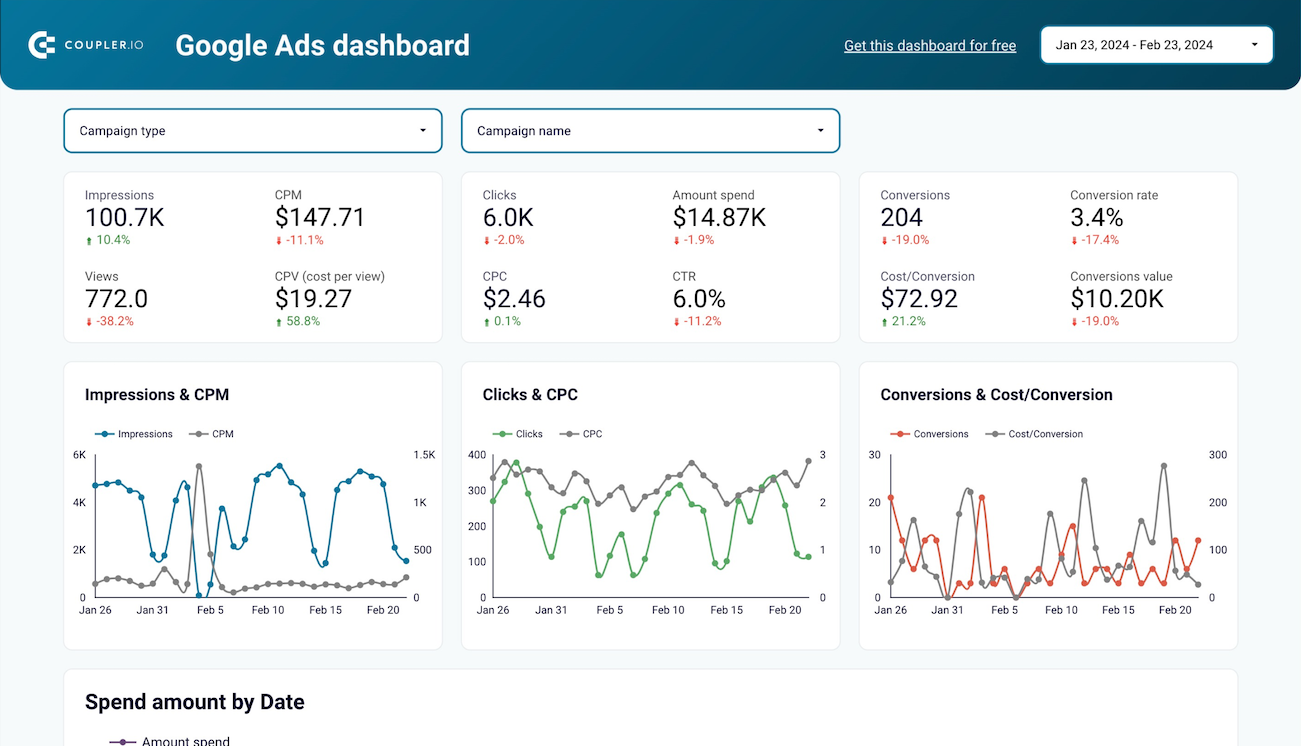
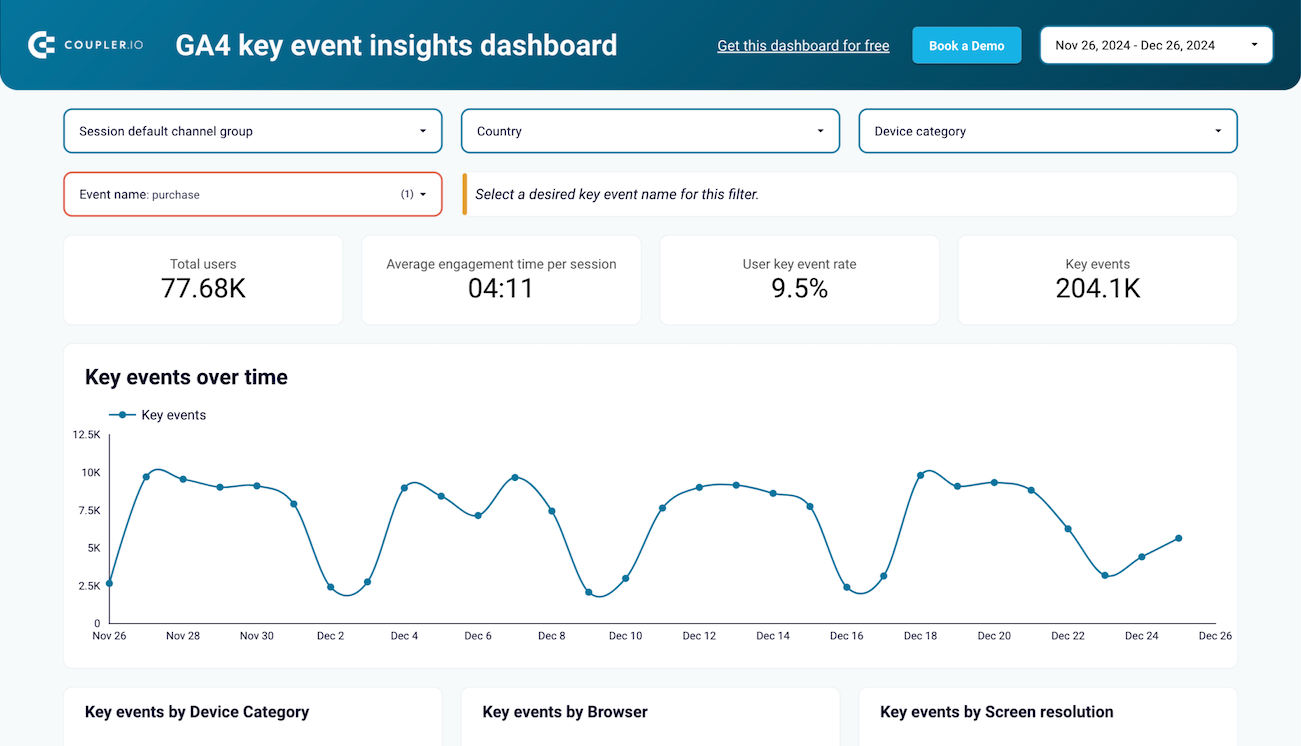
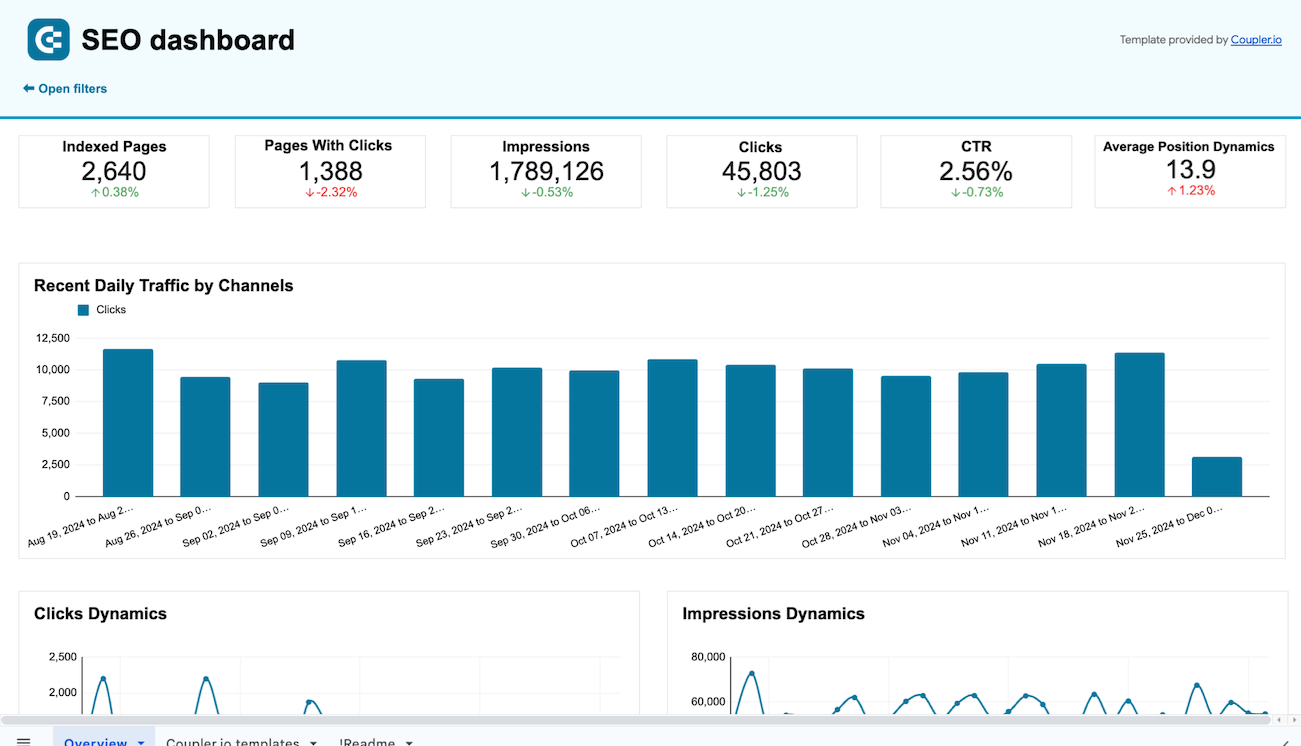
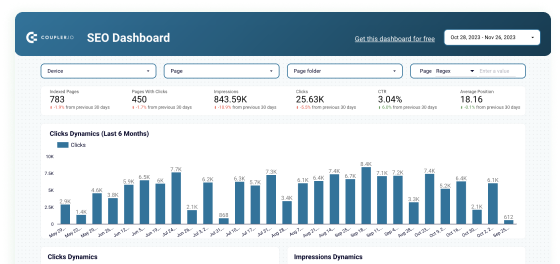
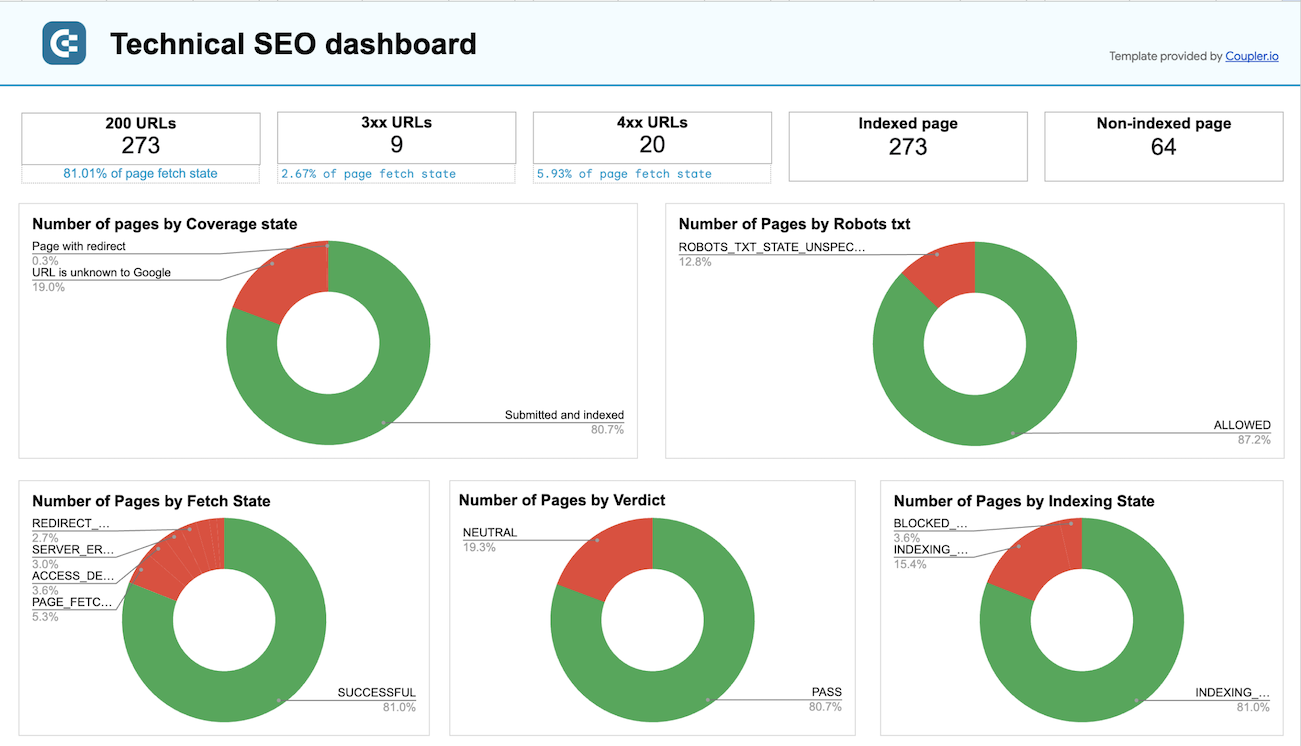
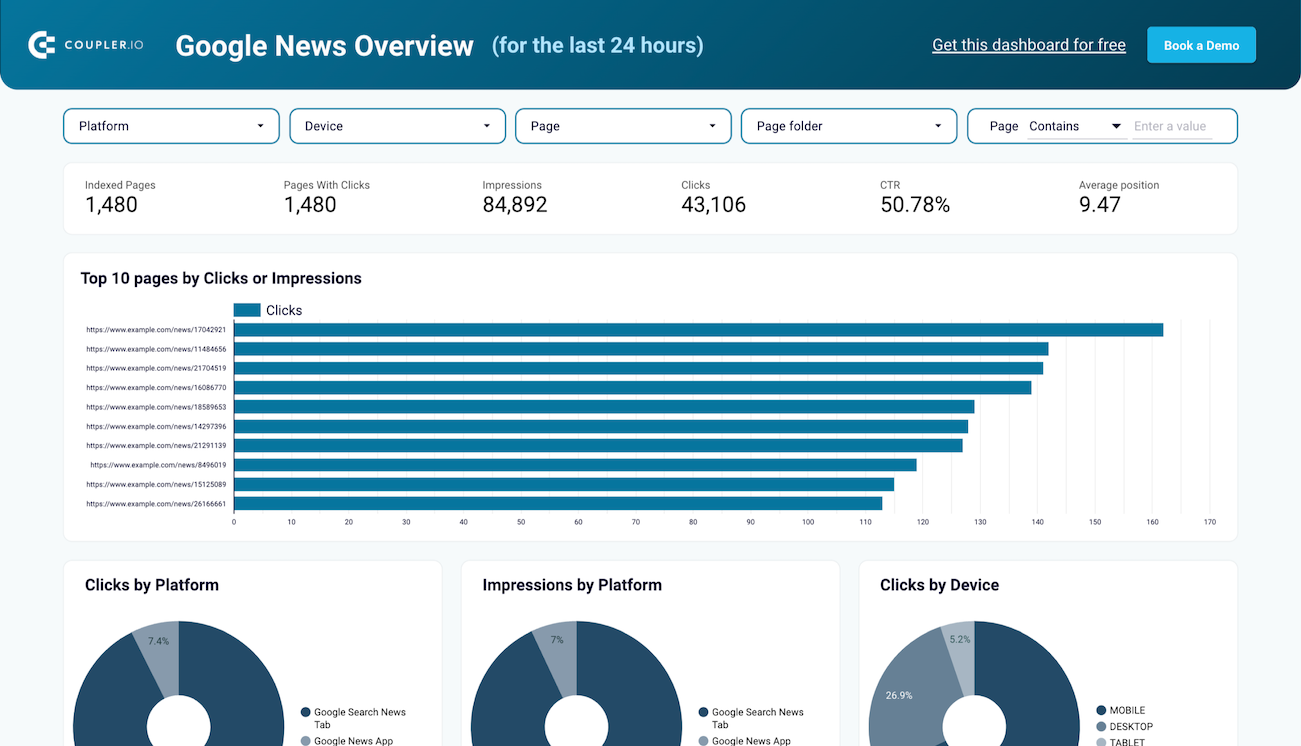
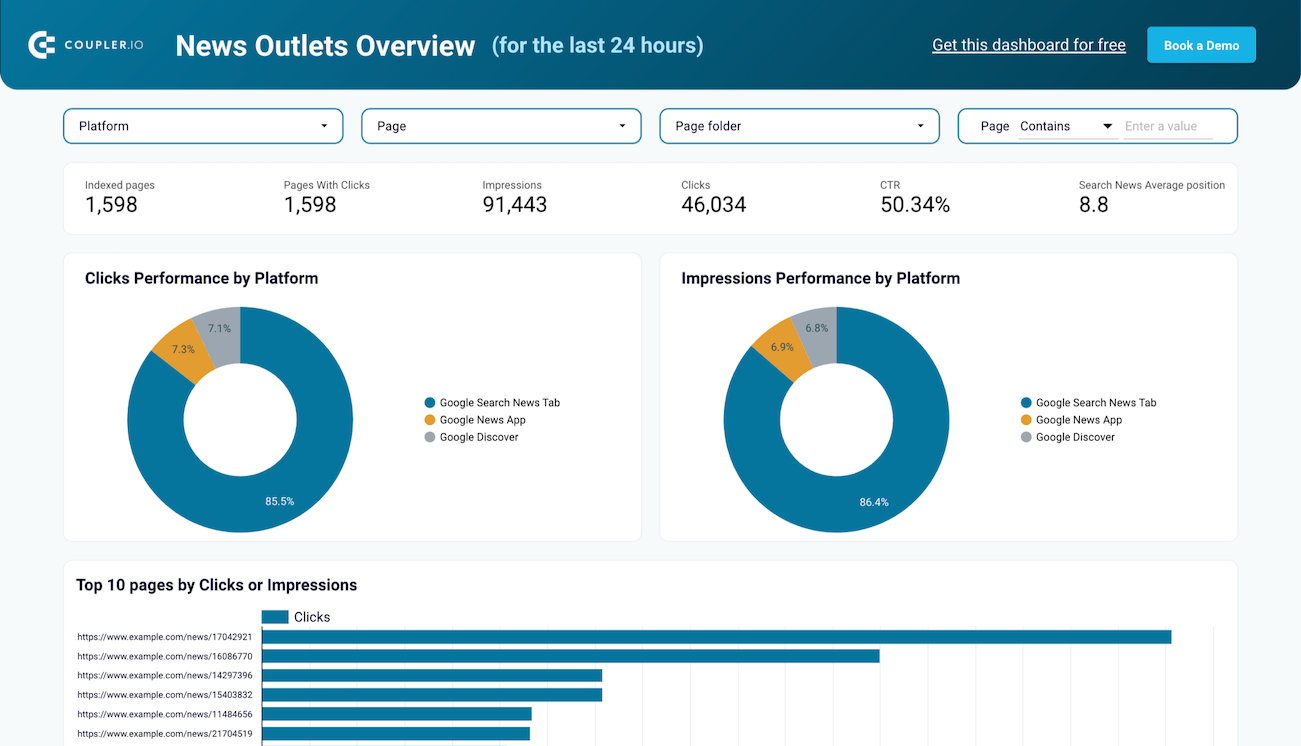
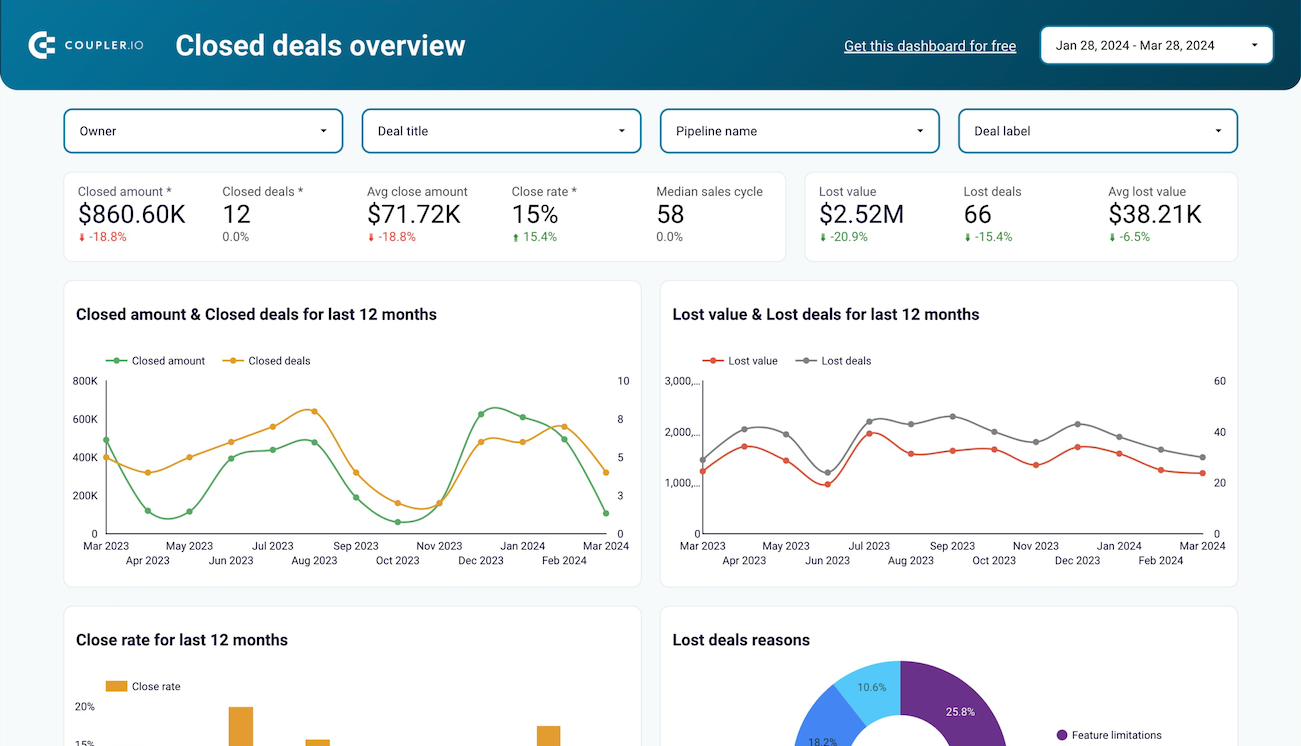
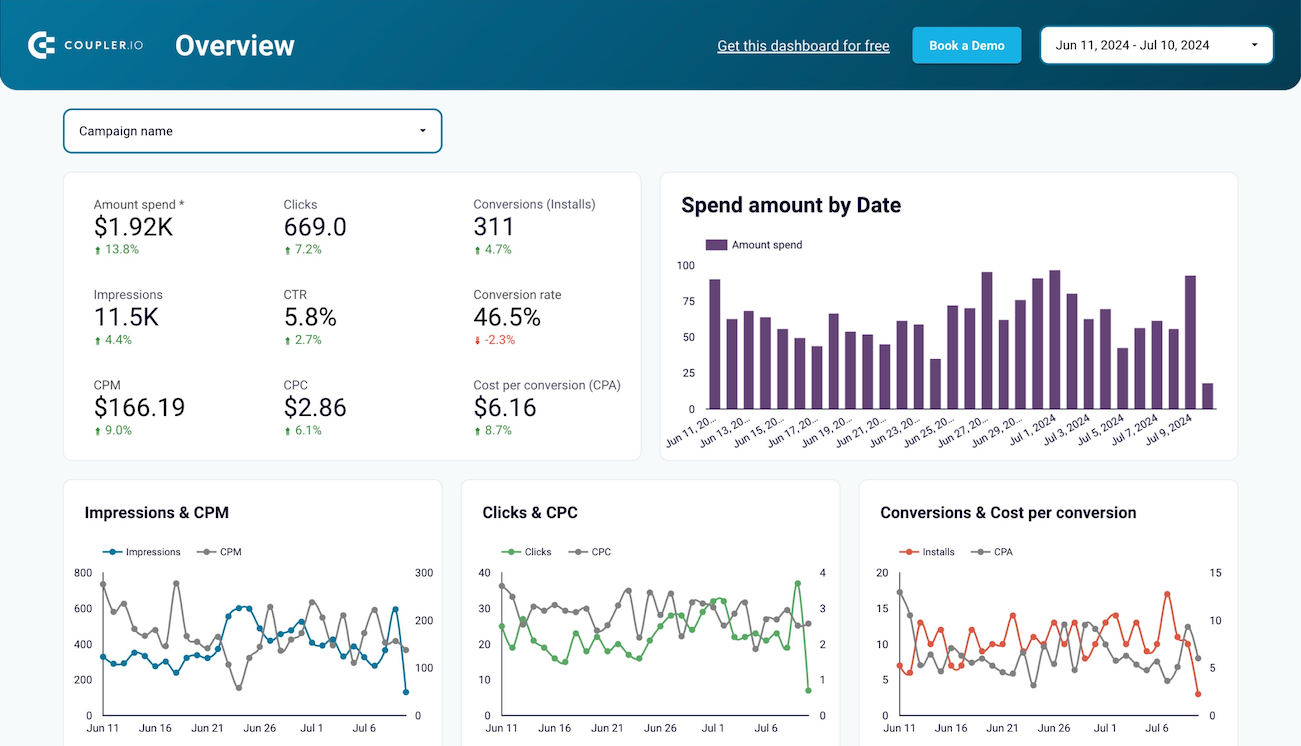
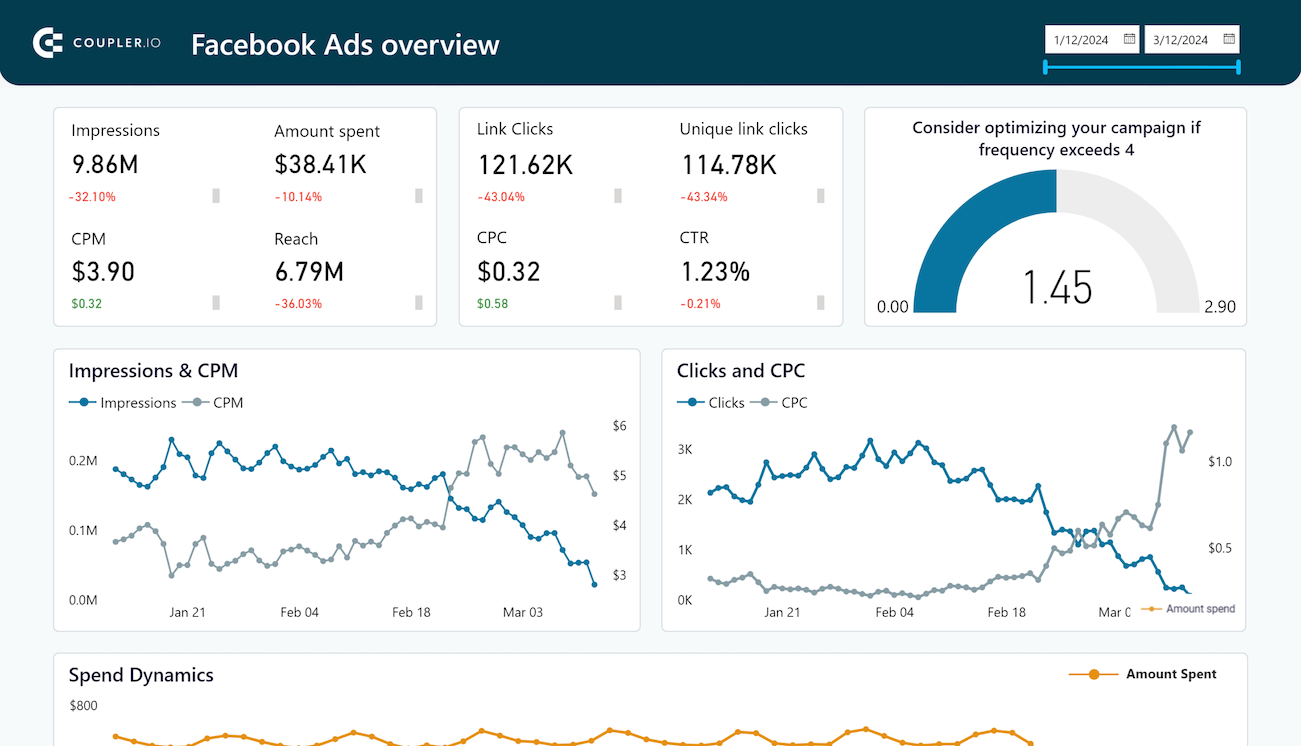
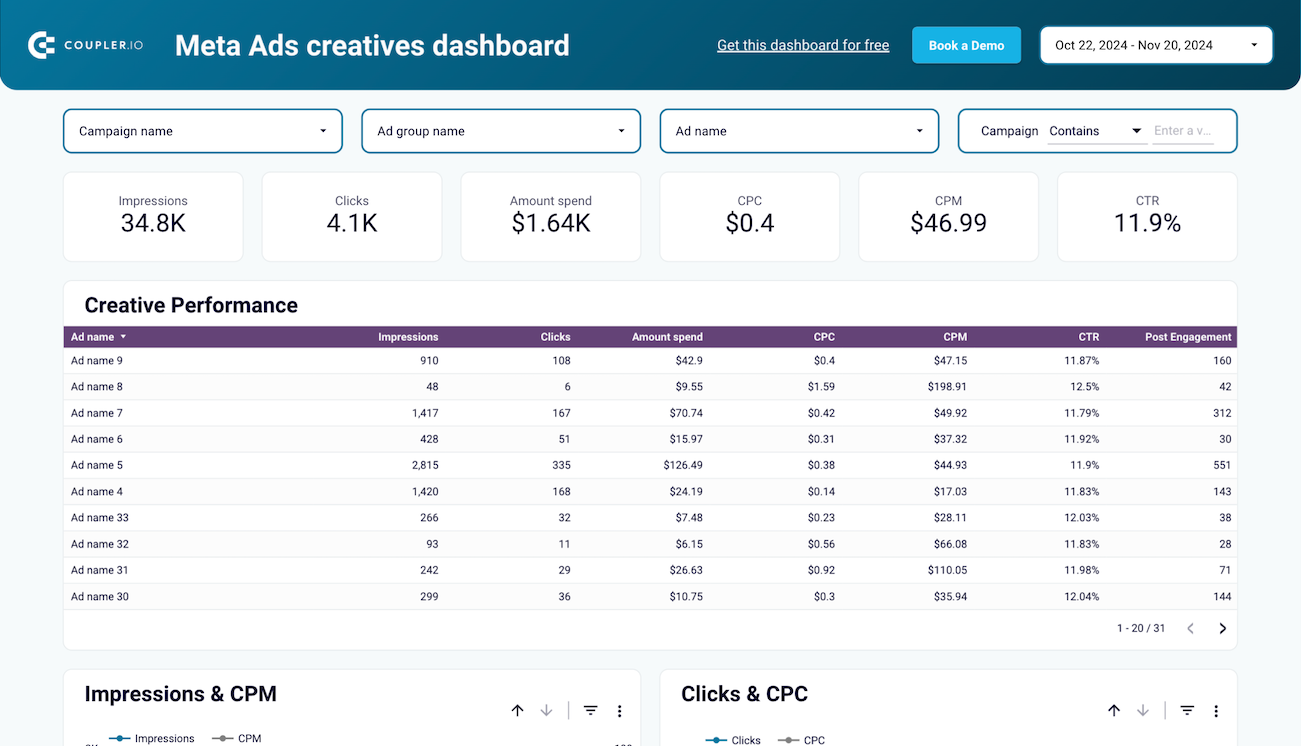
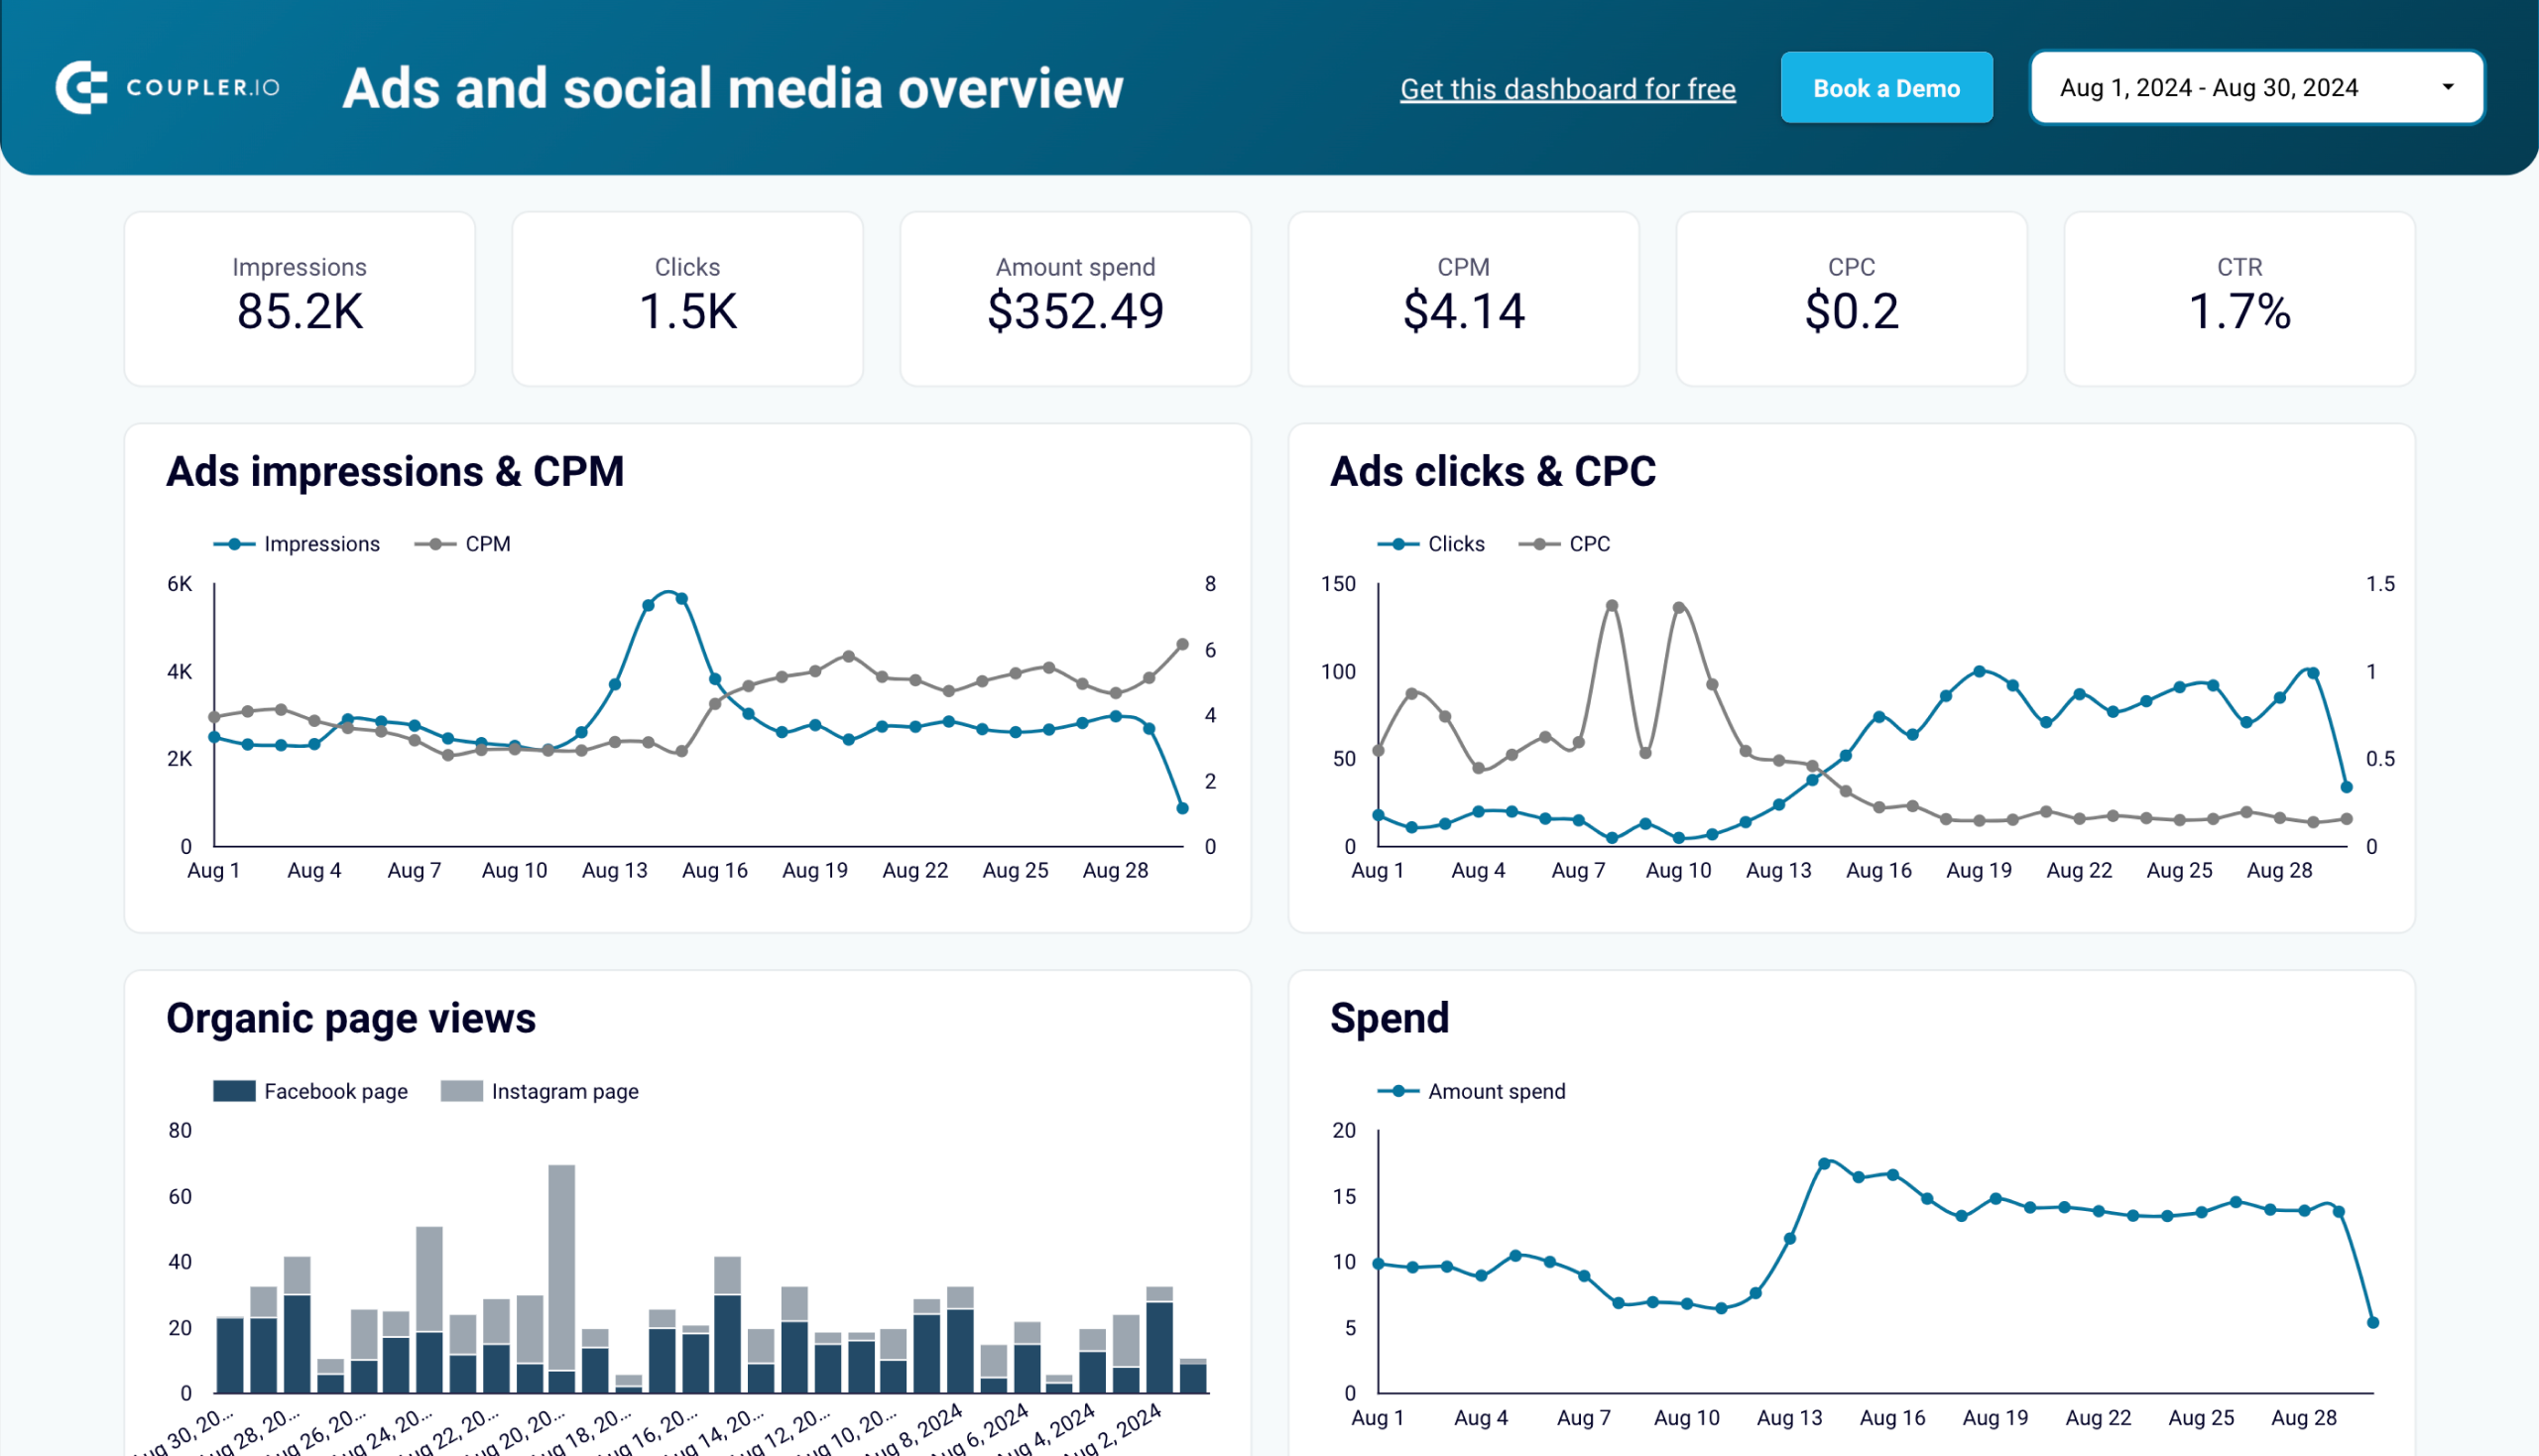
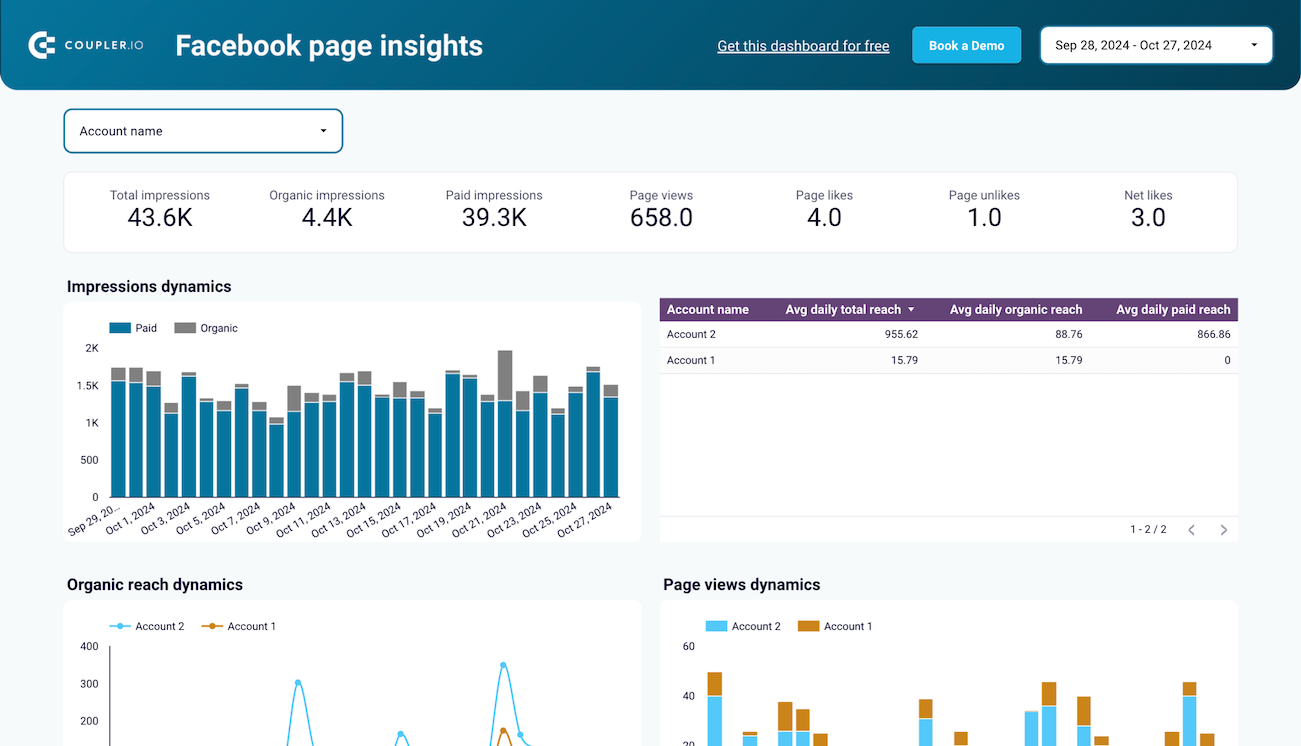
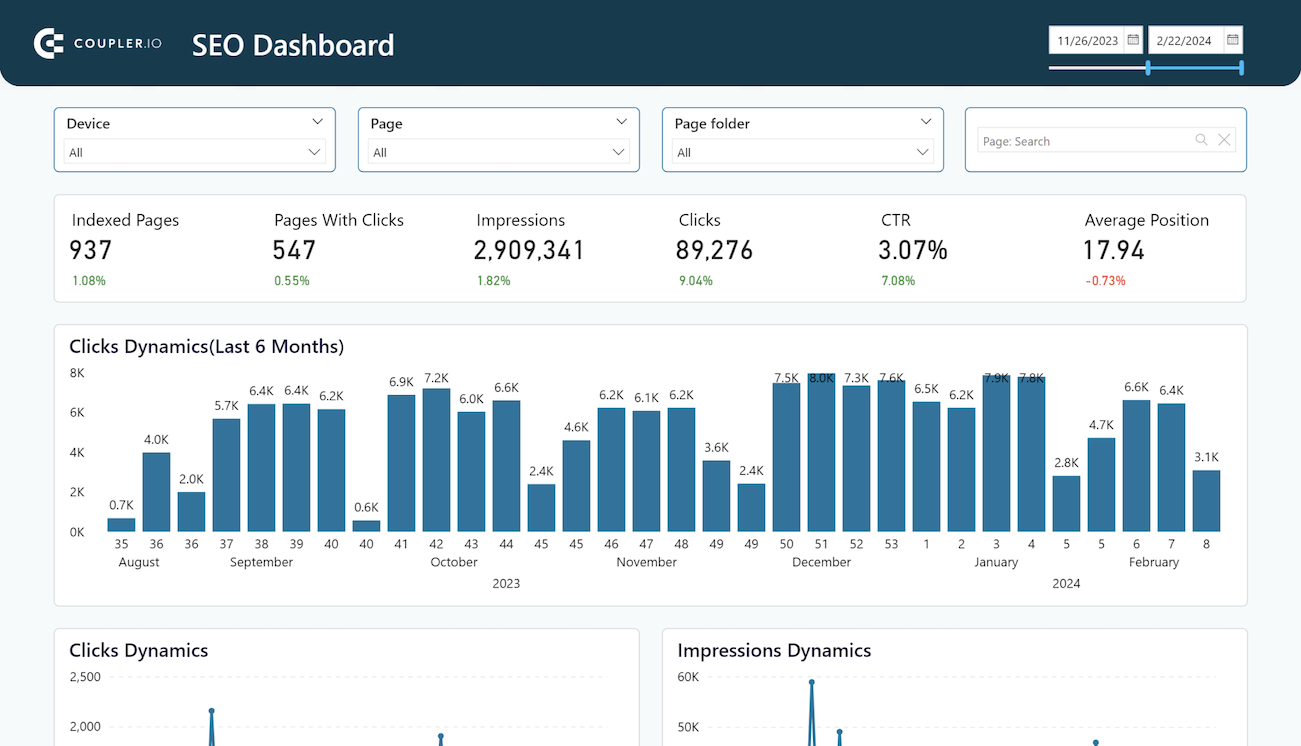
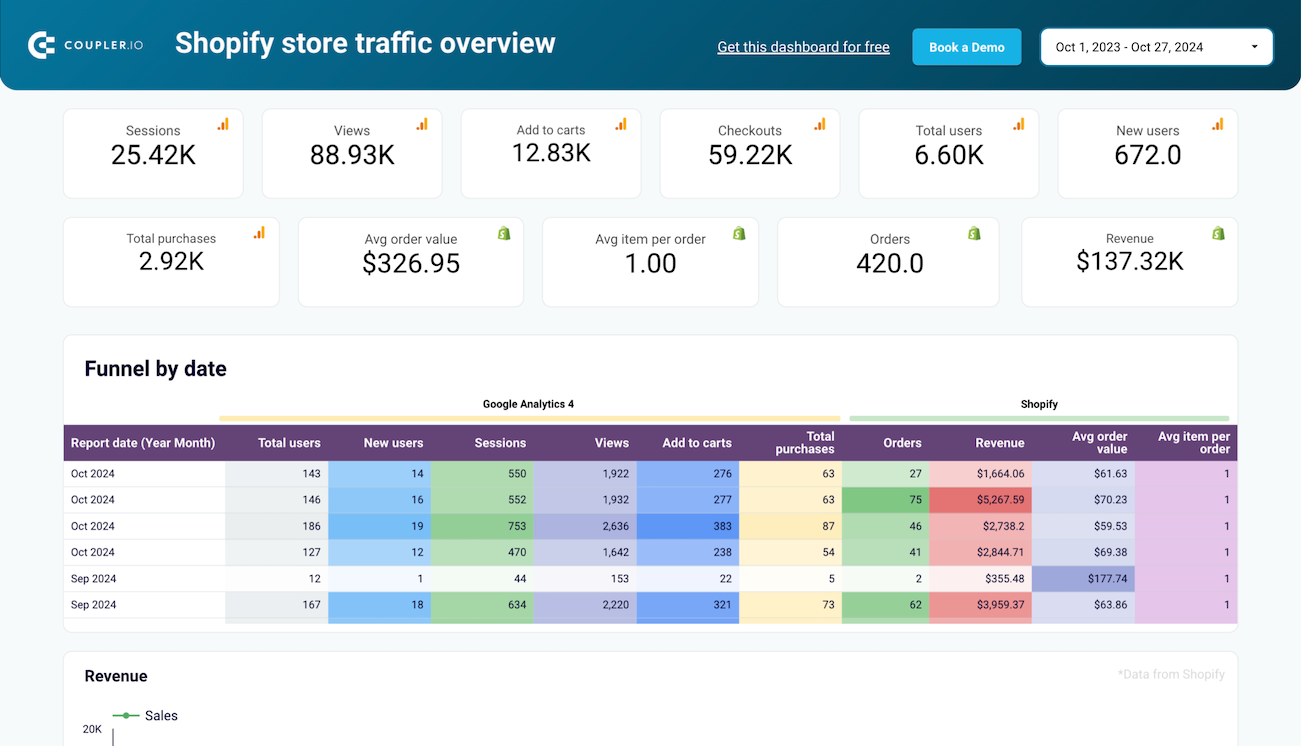
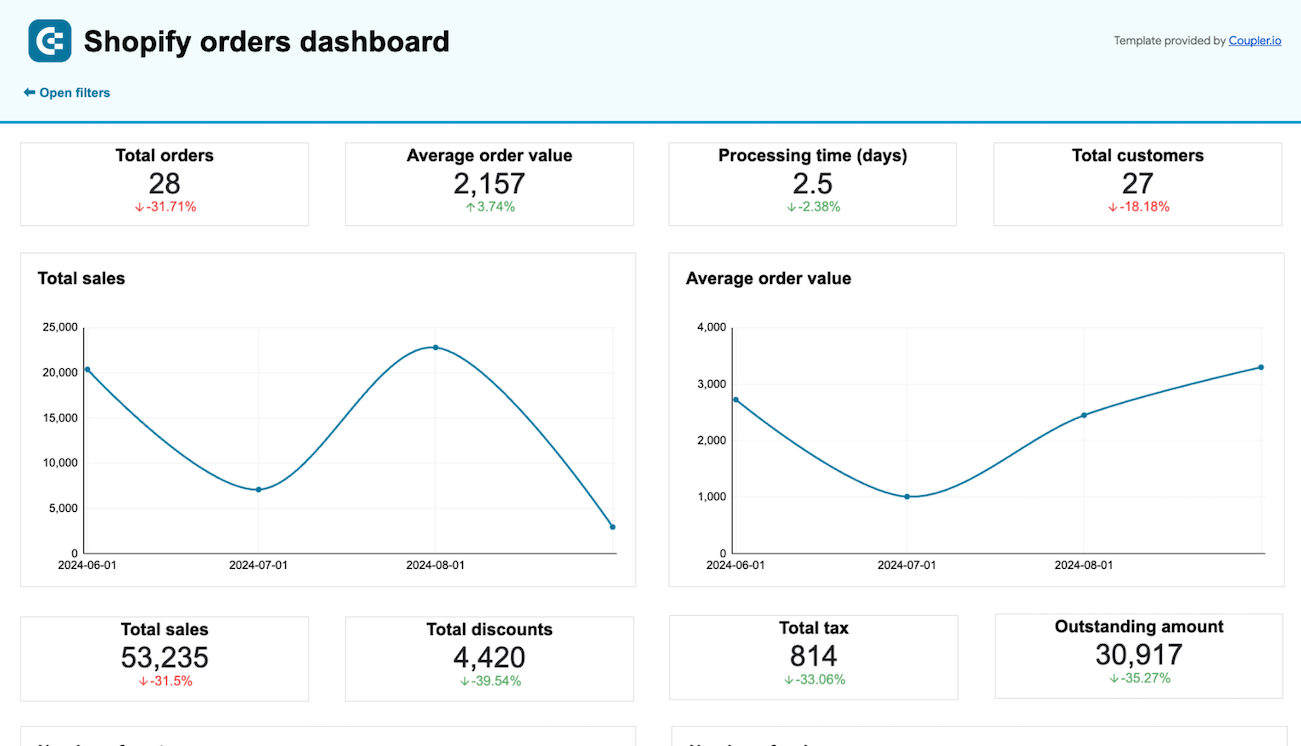
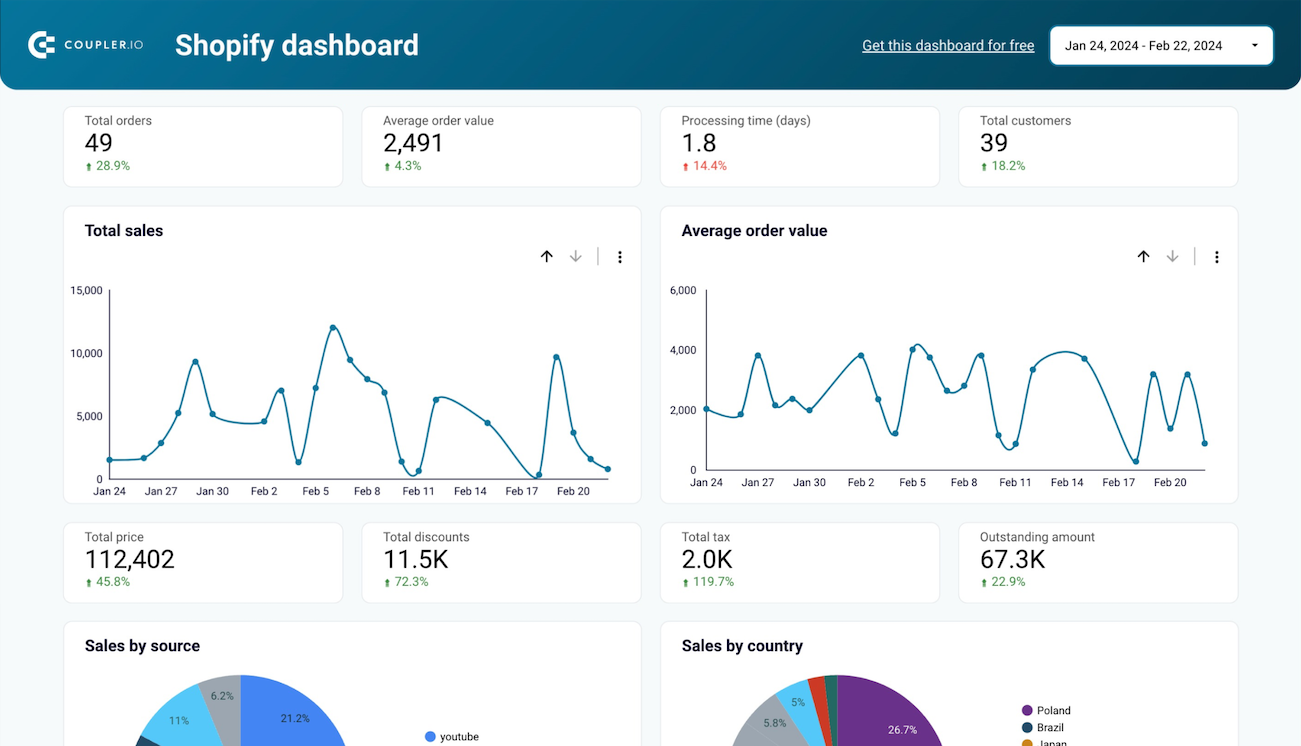
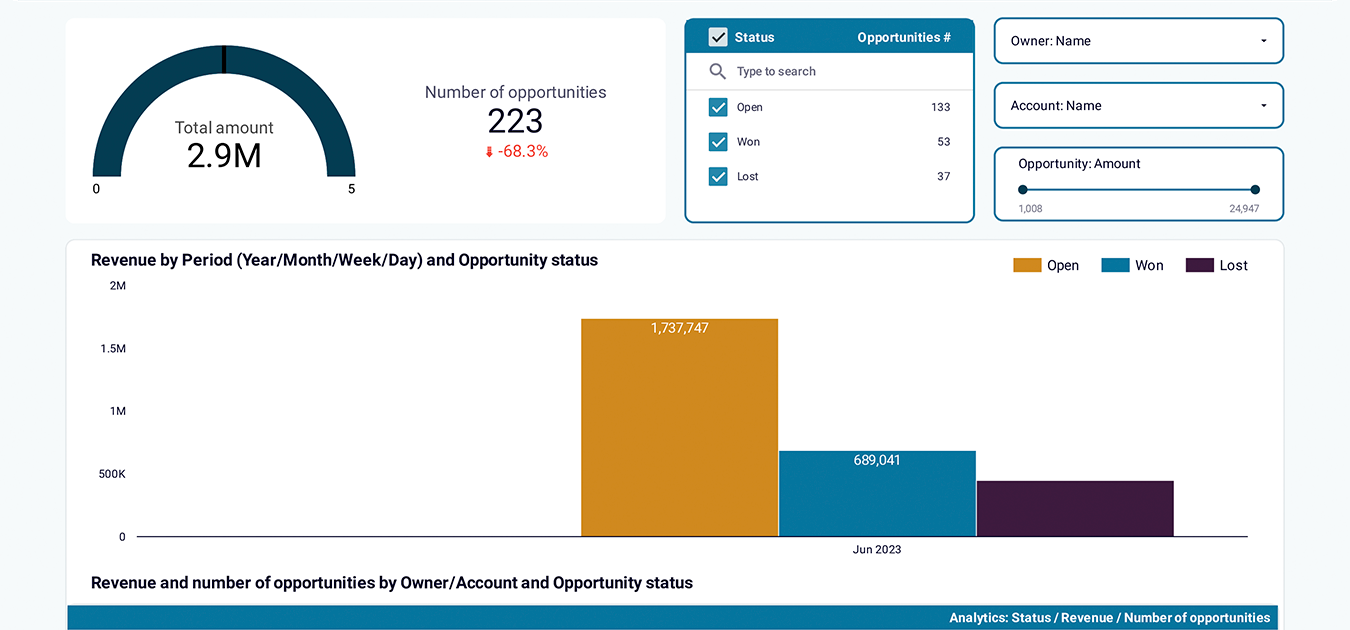
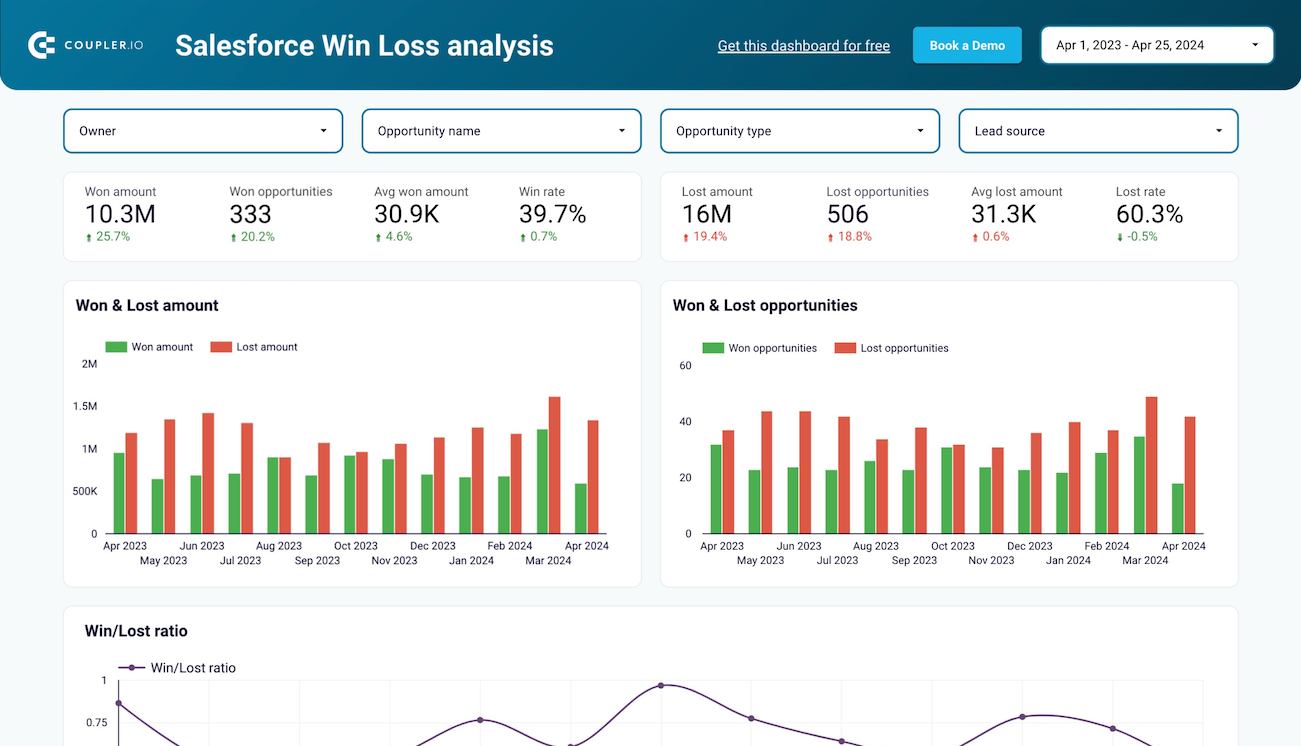
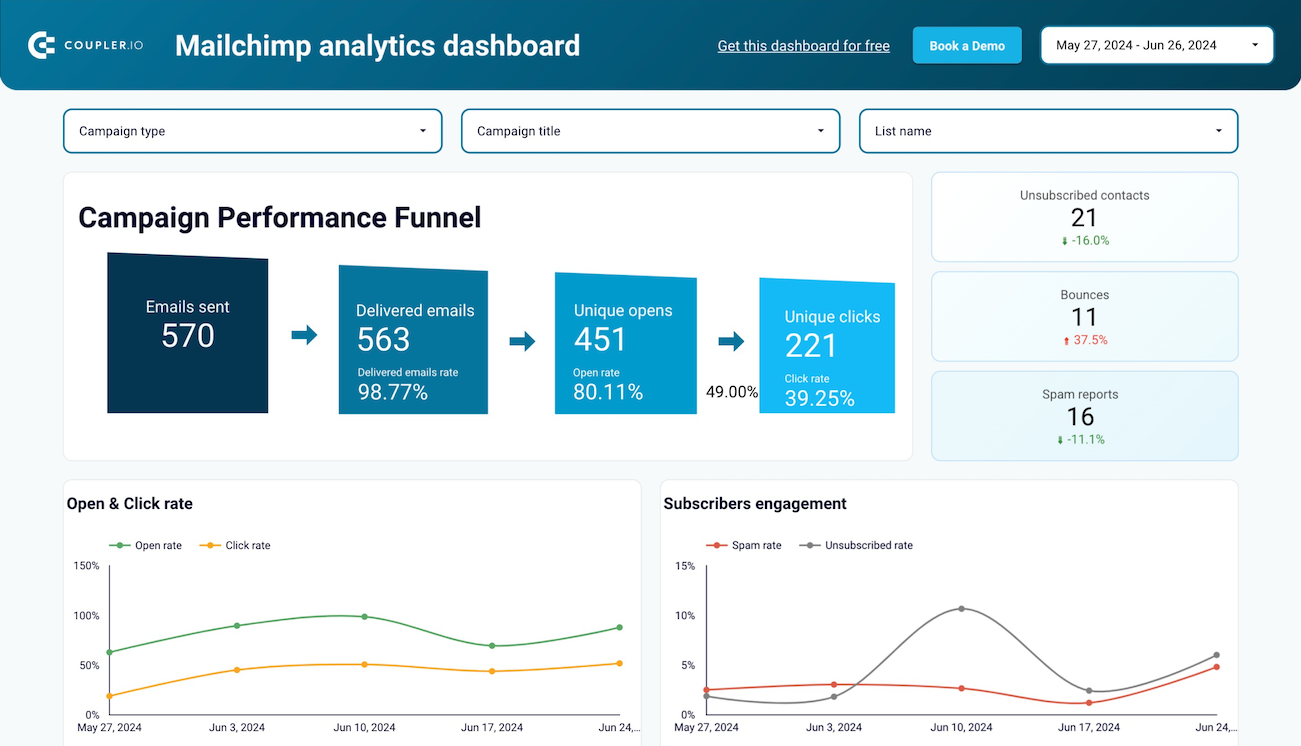
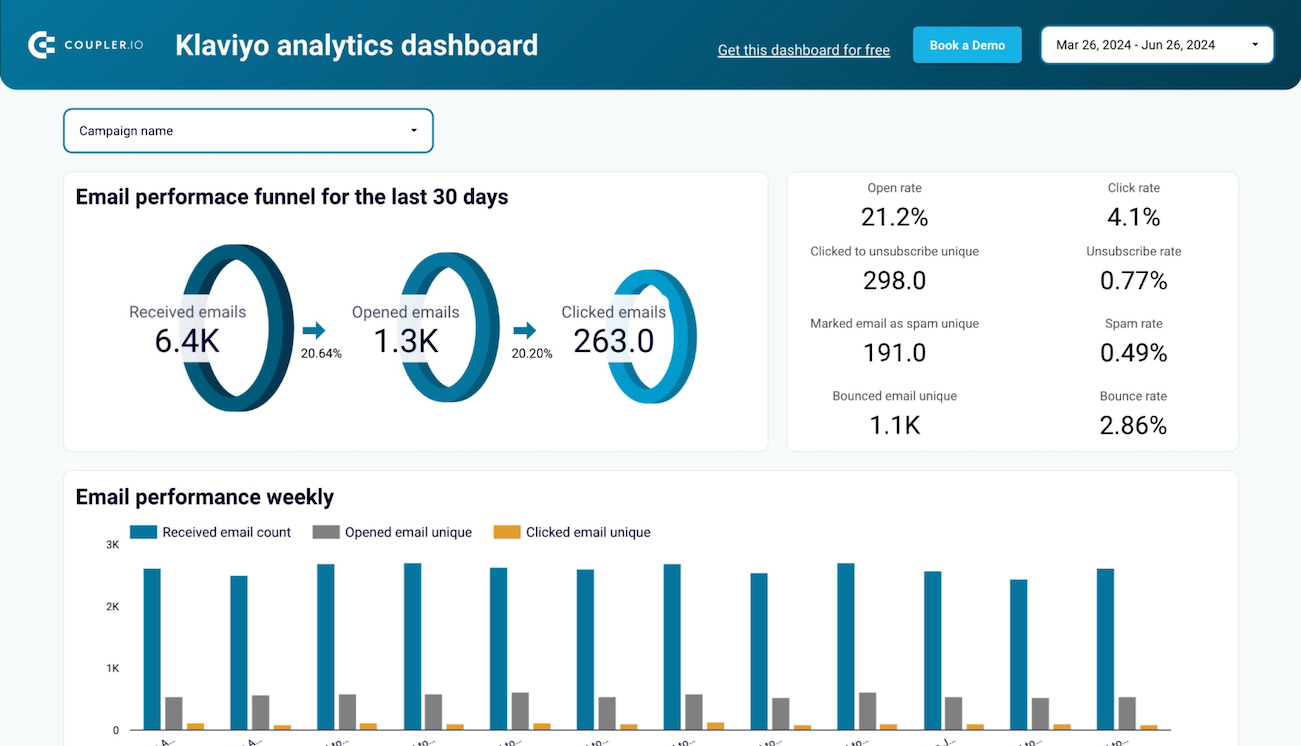
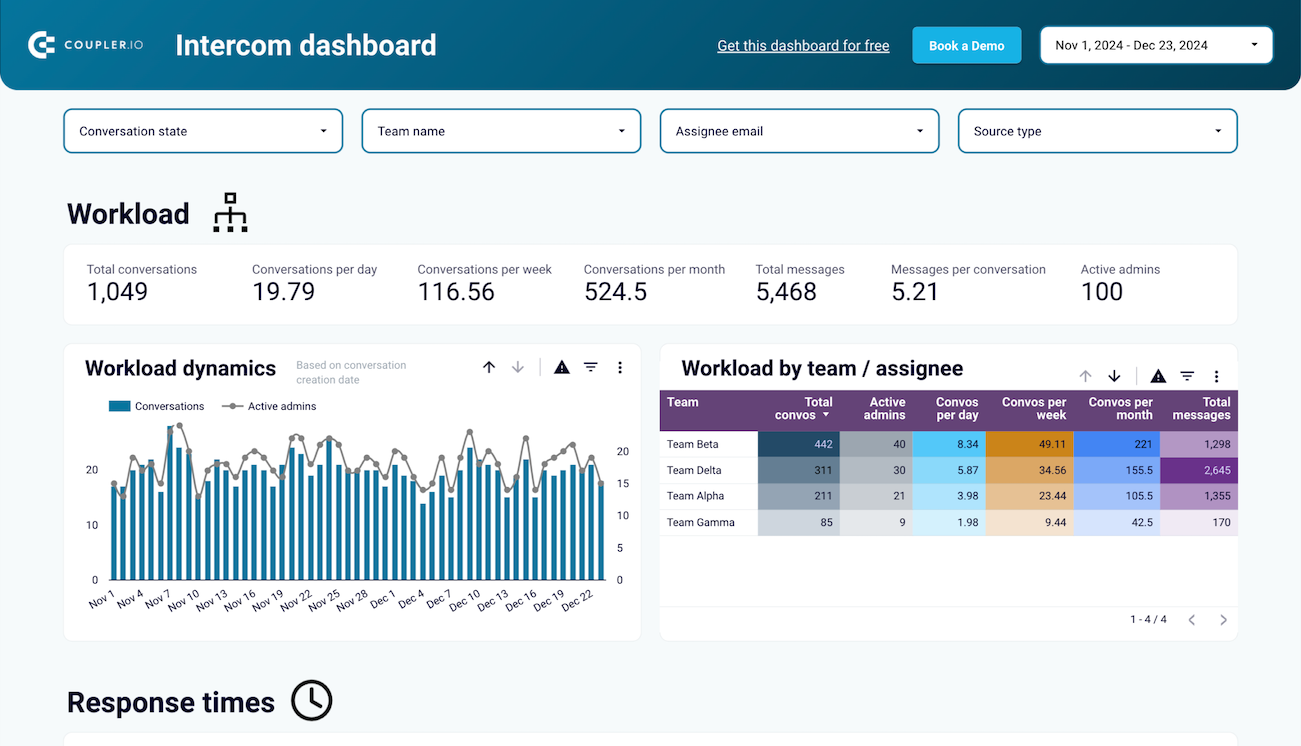
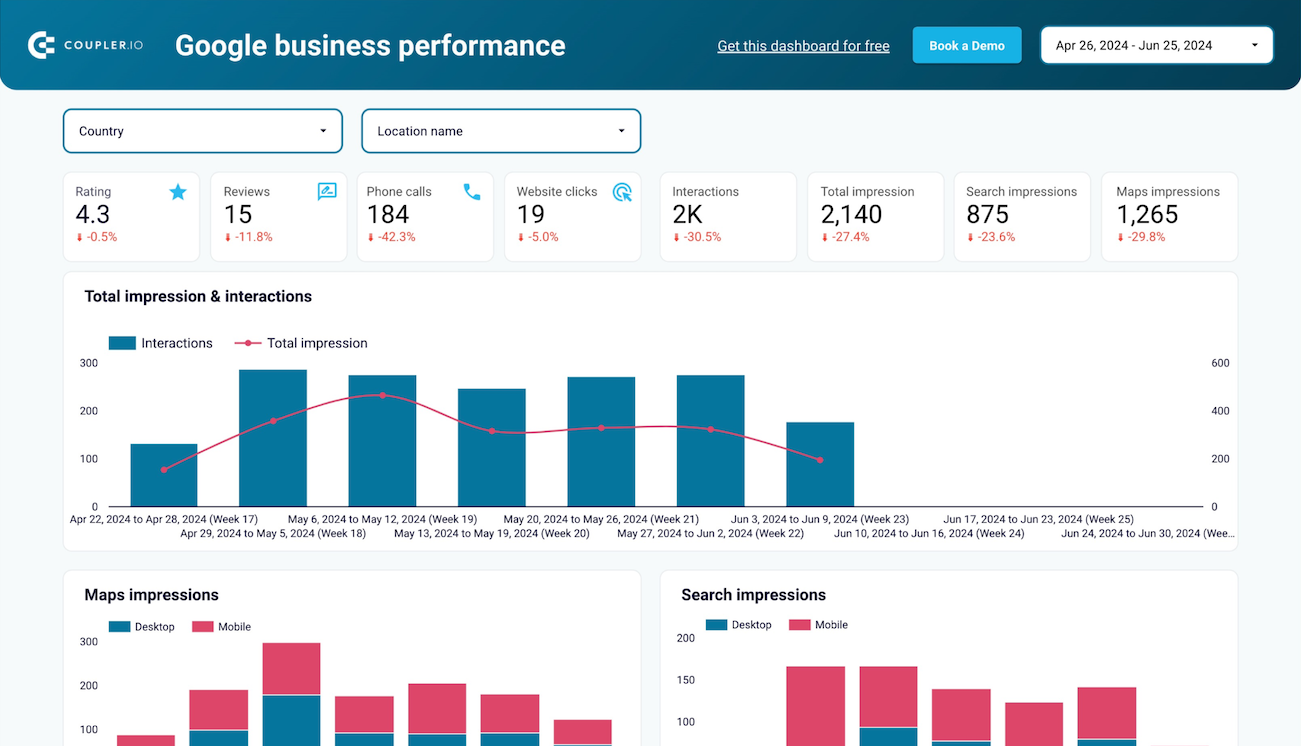
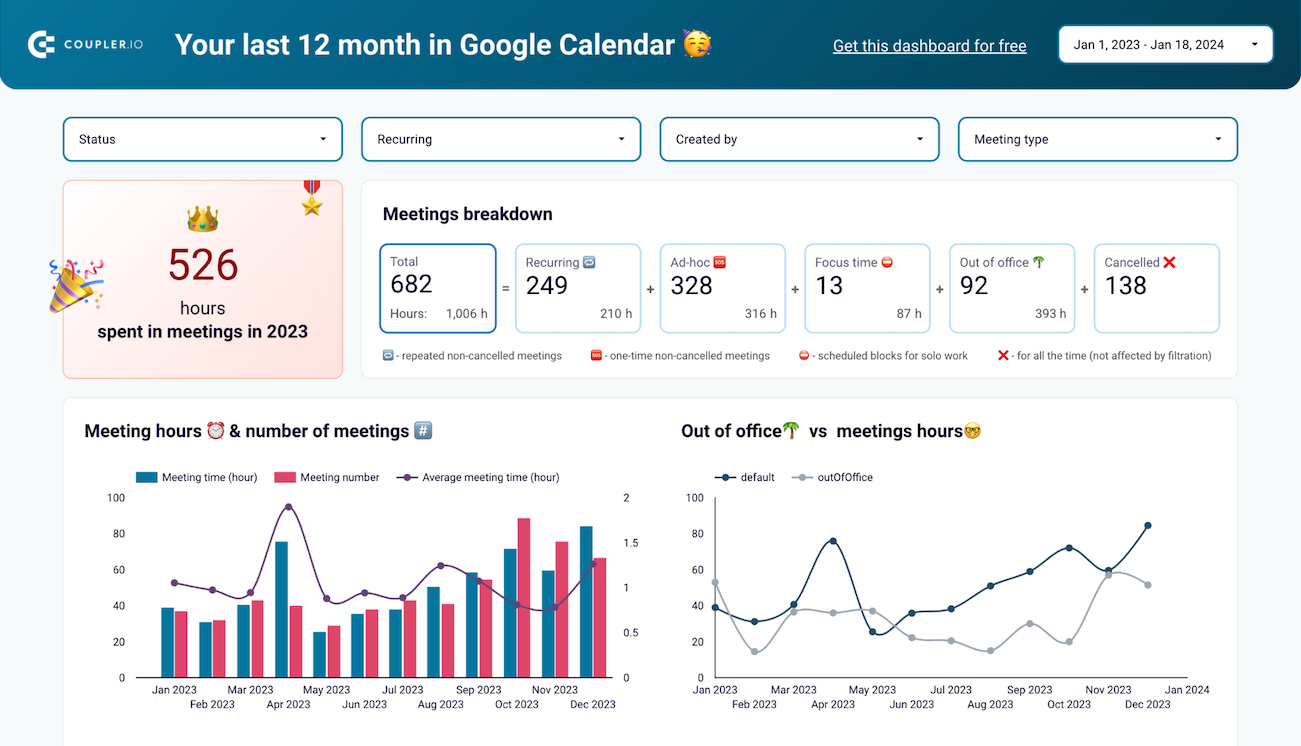
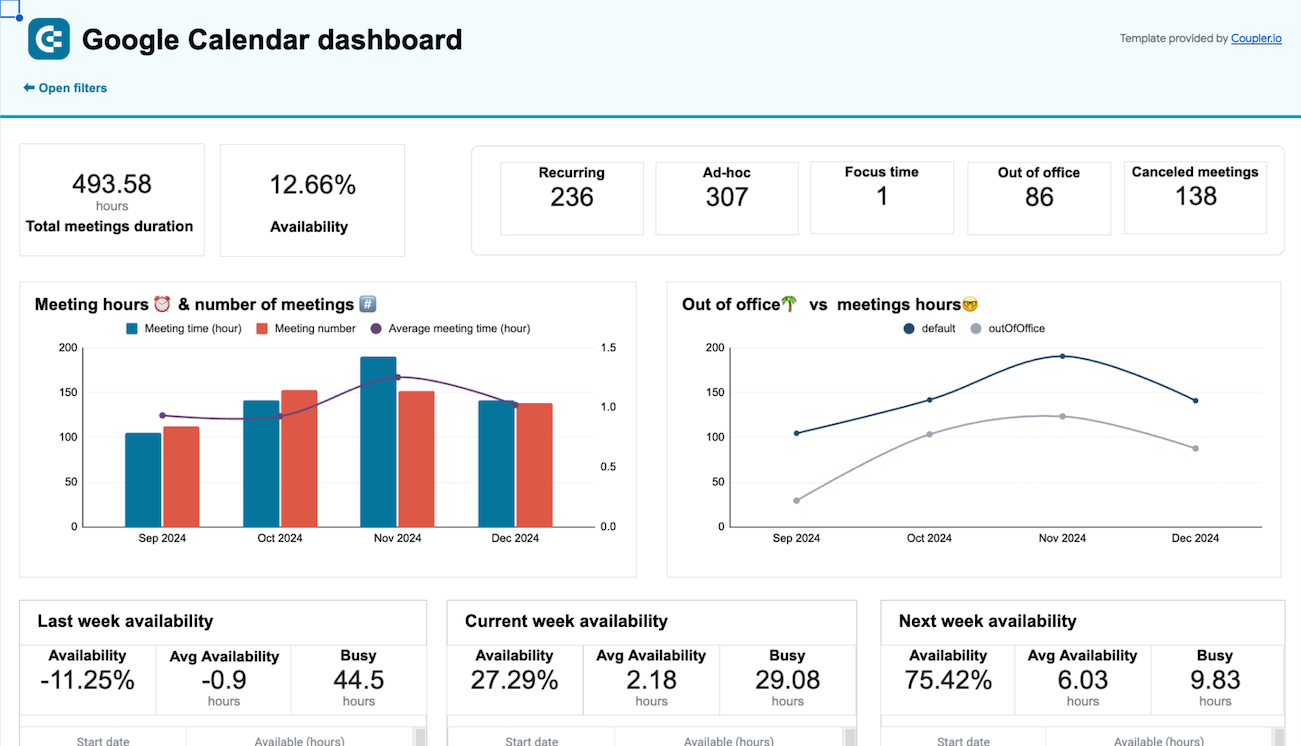
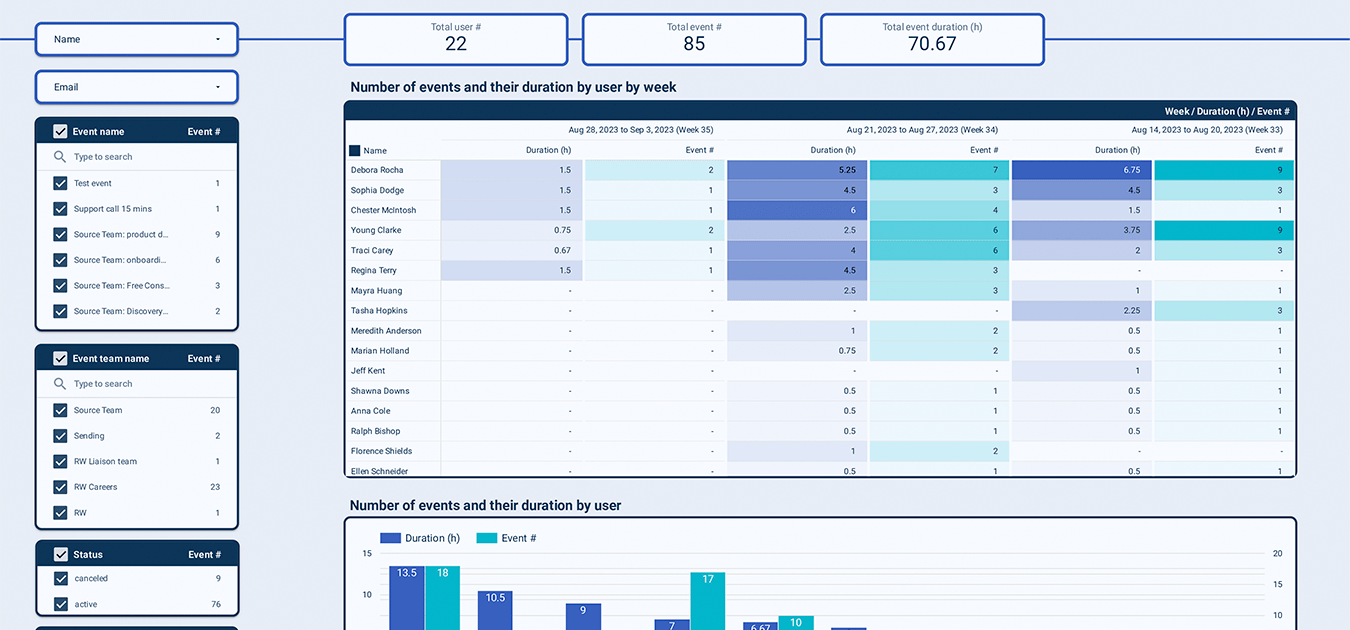
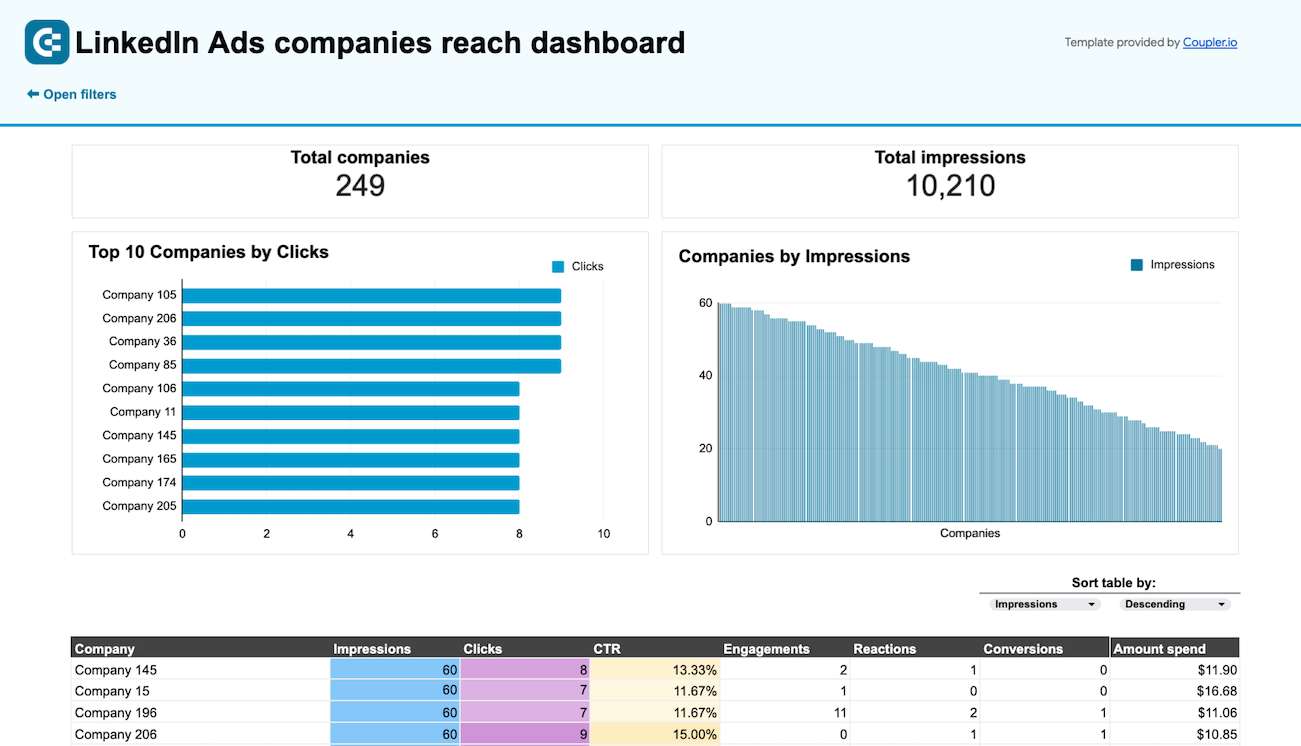
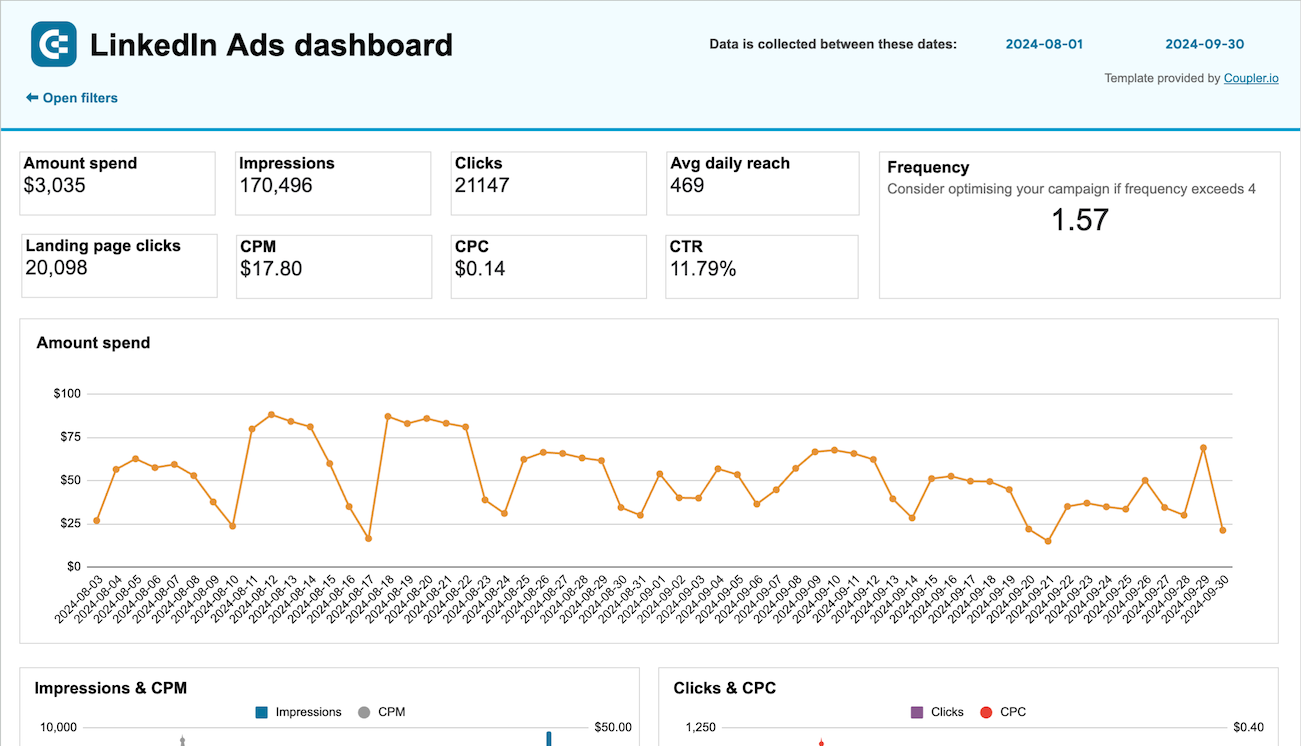
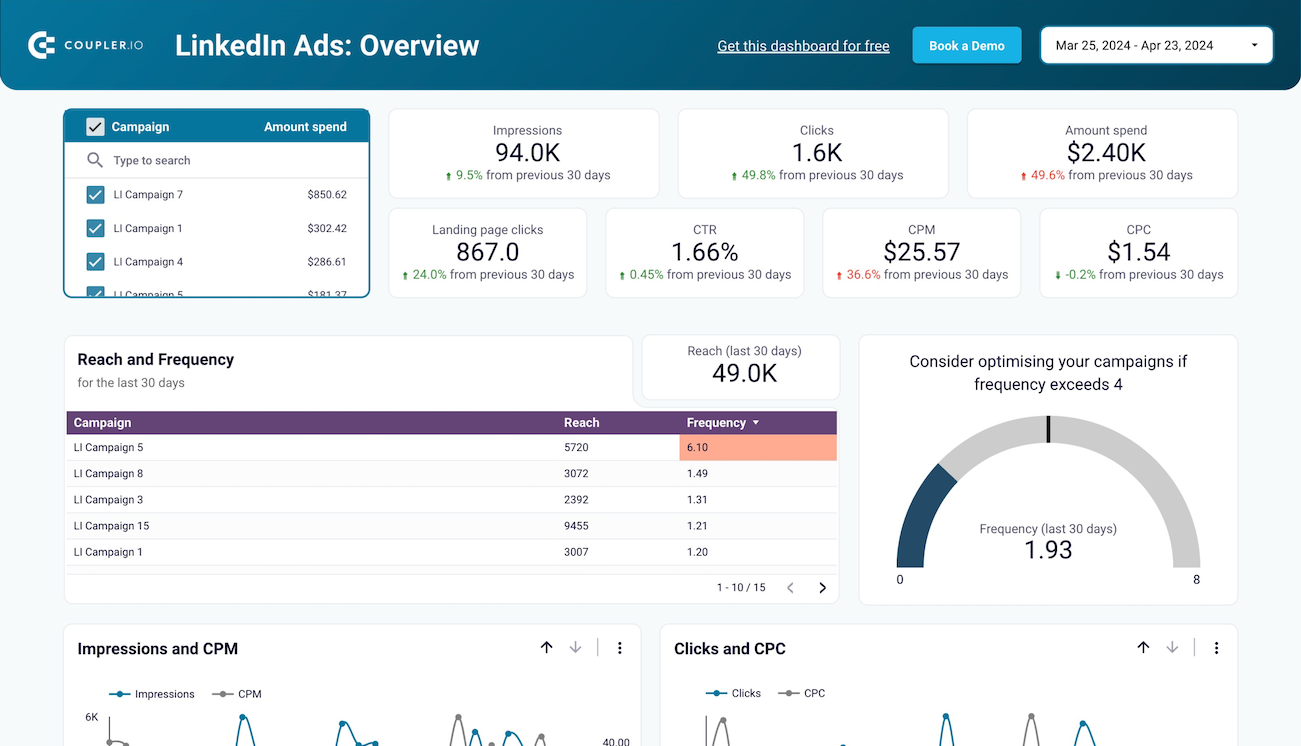
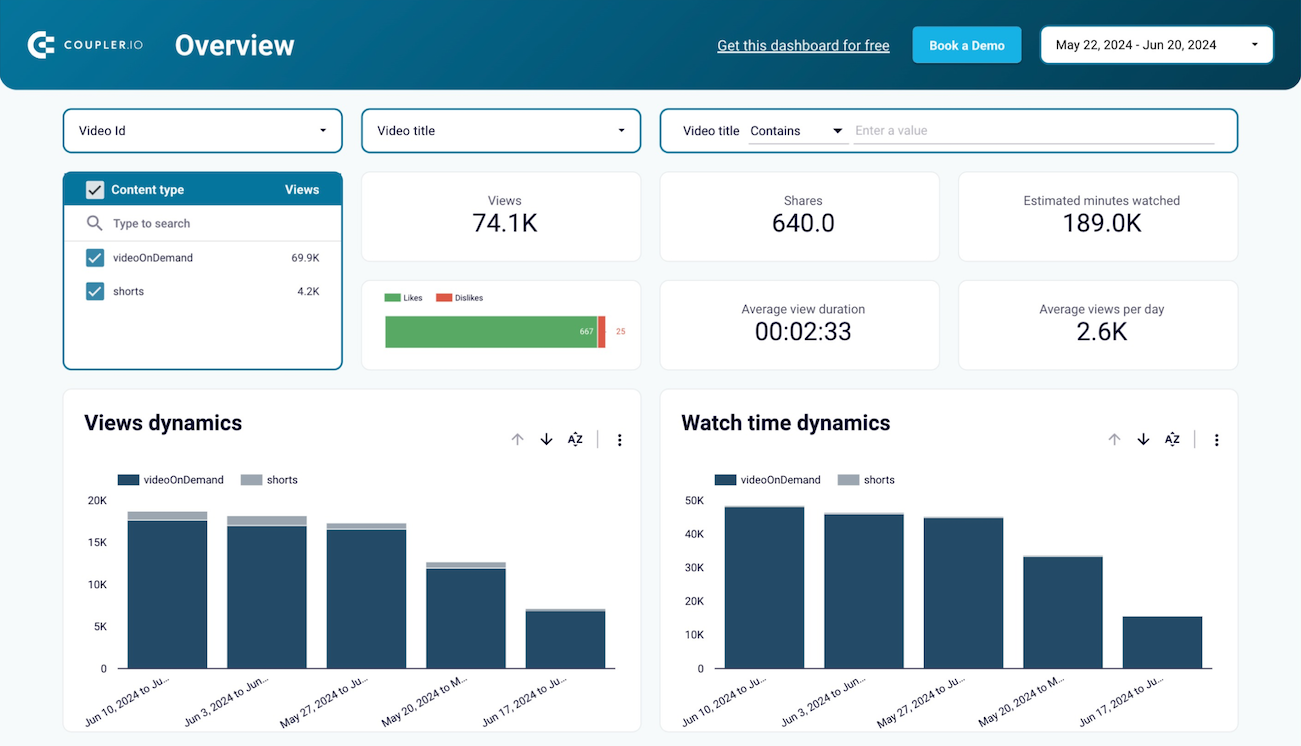
- Scorecards with key metrics - You have all your KPIs, such as CPC, CPM, clicks, and other metrics on one panel at the top.
- Different charts with dynamics or split by categories - This is a visual part of the dashboard that presents key metrics as line charts, pie charts, or column graphs.
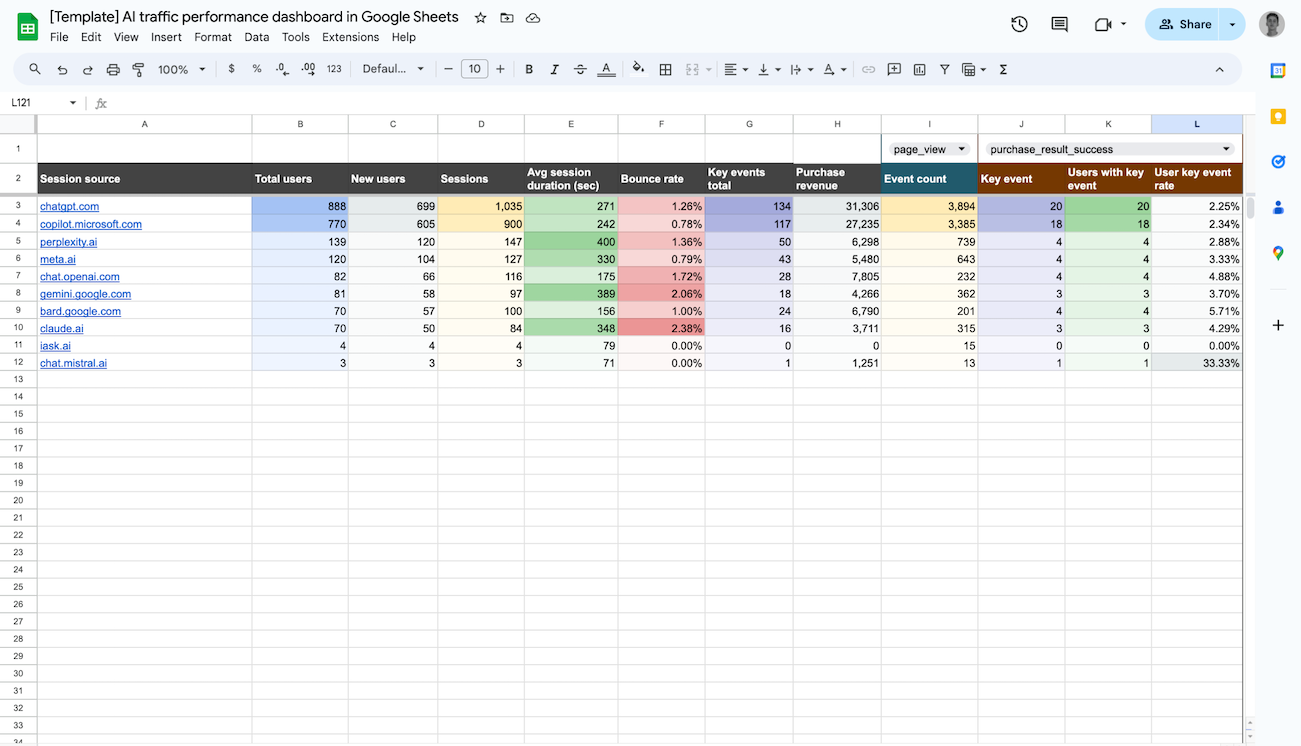
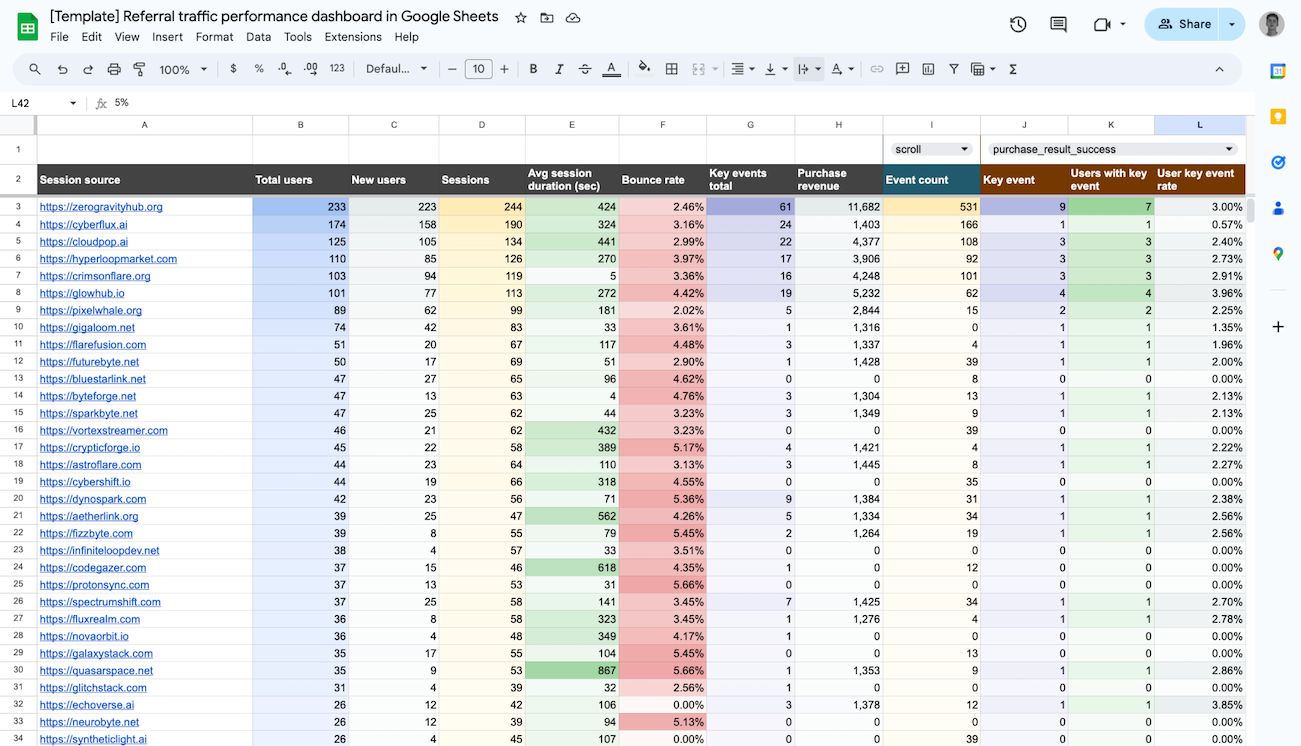
- Table with campaigns breakdown - On the bottom of the dashboard, you have a table showing a drill down into your PPC performance by campaign.
